 Click to zoom
Cause and Effect Fishbone PowerPoint Charts Template: Unravel Issues Effortlessly
| Format | .pptx |
| Slides | 22 unique layouts |
| Aspect ratio | 16:9 |
| Compatibility | PowerPoint |
| Animated | No |
| Language | English |
| License | Commercial |
| File size | — |
| Version | v1.0 |
| Last updated | September 2023 |
What's inside
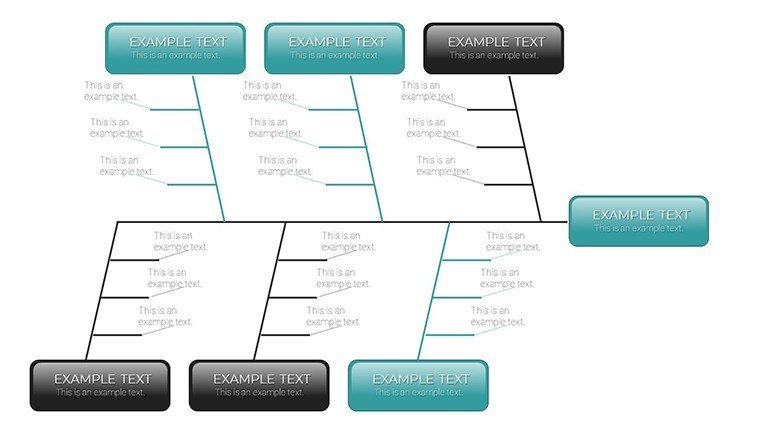
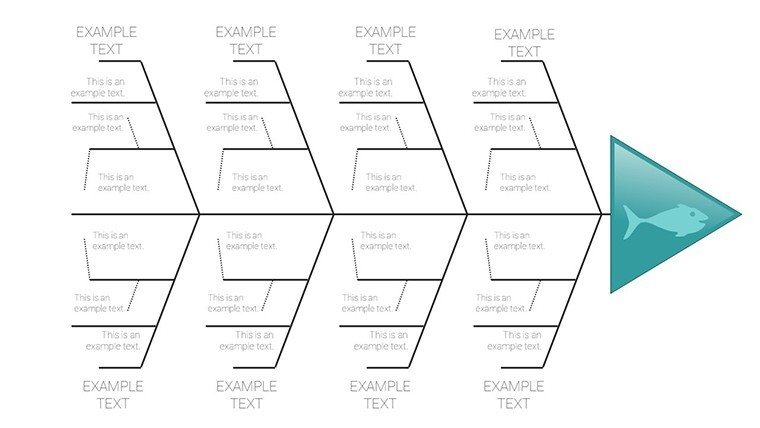
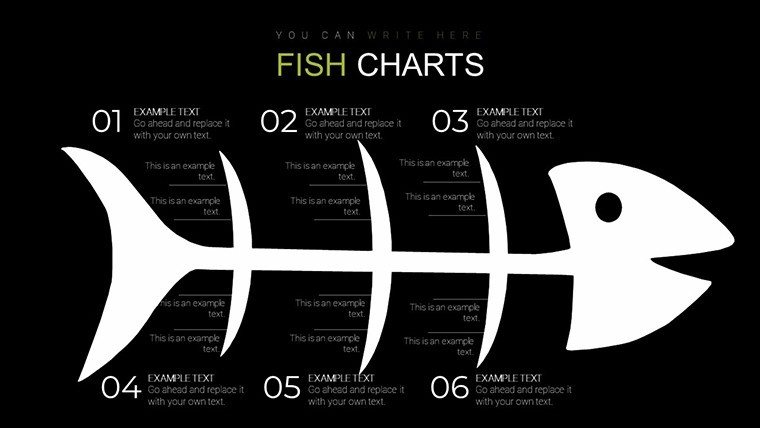
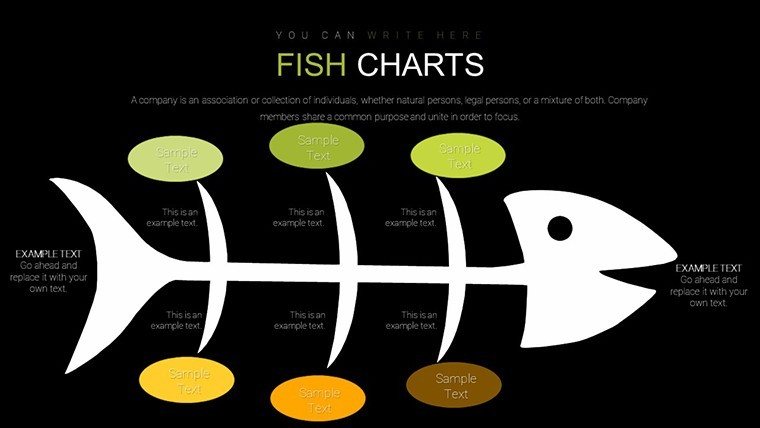
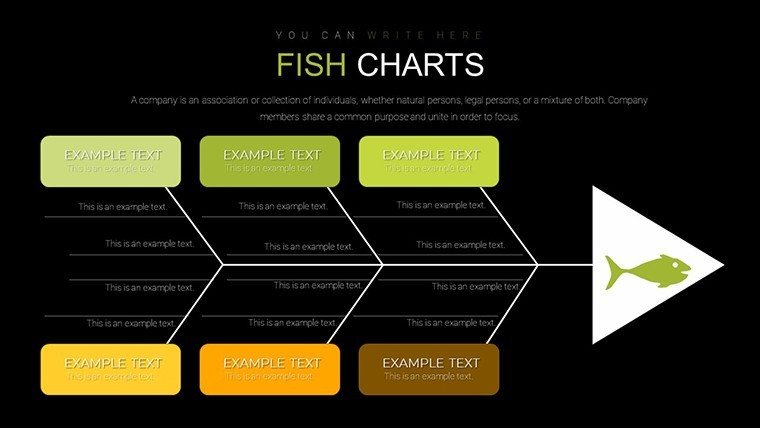
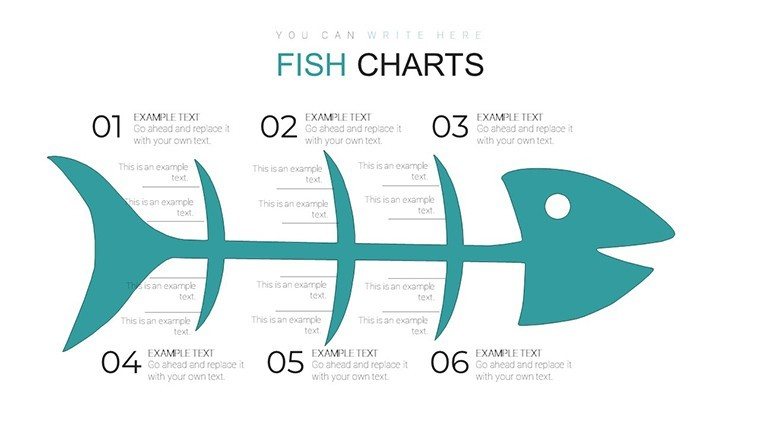
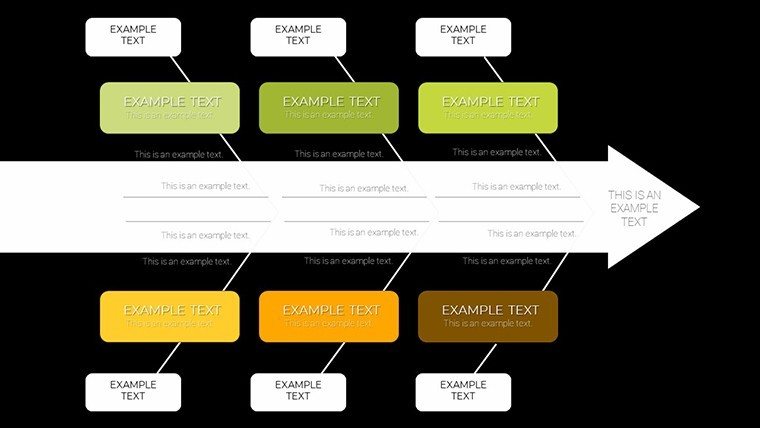
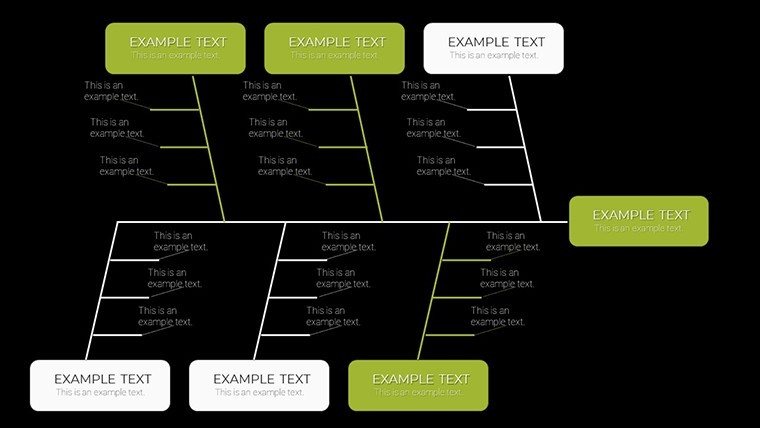
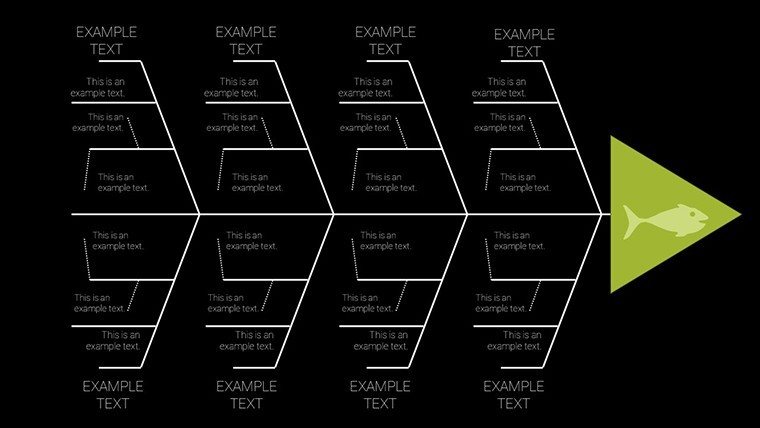
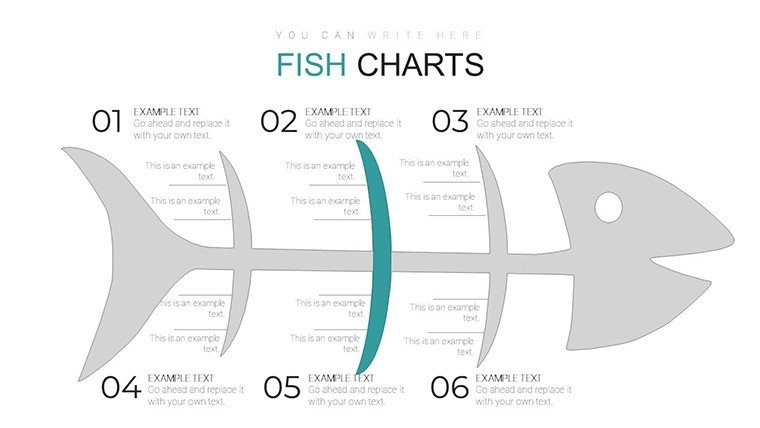
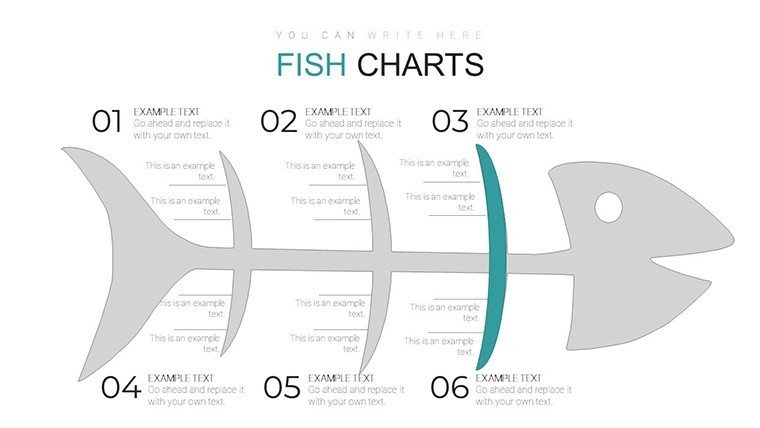
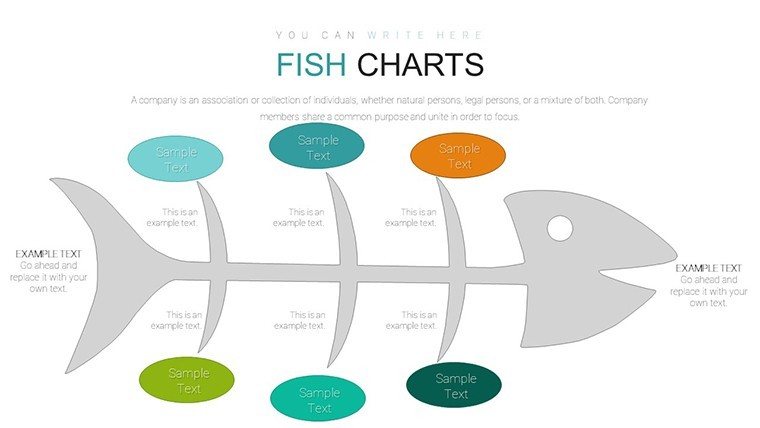
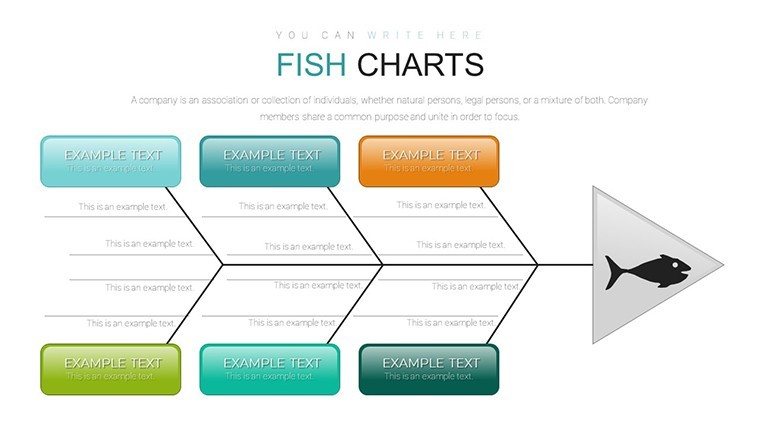
Facing persistent problems in your operations or teachings? The Cause and Effect Fishbone PowerPoint Charts Template provides a streamlined way to visualize and tackle them head-on. With 22 editable slides centered on the classic fishbone diagram, this resource helps categorize causes into core areas like people, processes, and environment. Suited for quality managers, educators, and business teams, it transforms brainstorming into structured insights. Picture a workshop where team members add branches in real-time, uncovering root causes behind sales dips or learning gaps. Its clean, customizable layouts ensure your presentations are both informative and engaging, promoting collective understanding and swift resolutions. Drawing from proven quality tools, this template boosts your analytical prowess, making complex diagnostics simple and collaborative. Step into a world where problems become opportunities for growth, all through visually compelling slides.
Mastering the Fishbone Framework
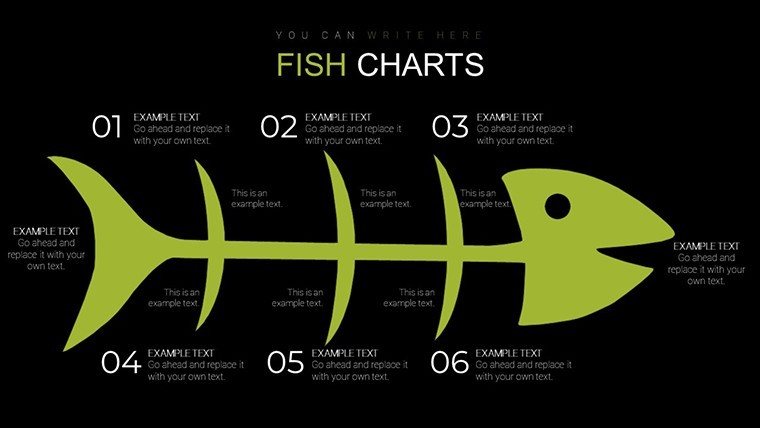
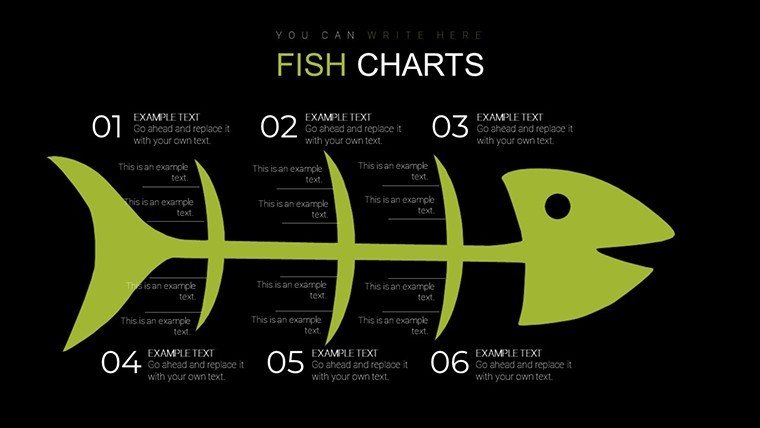
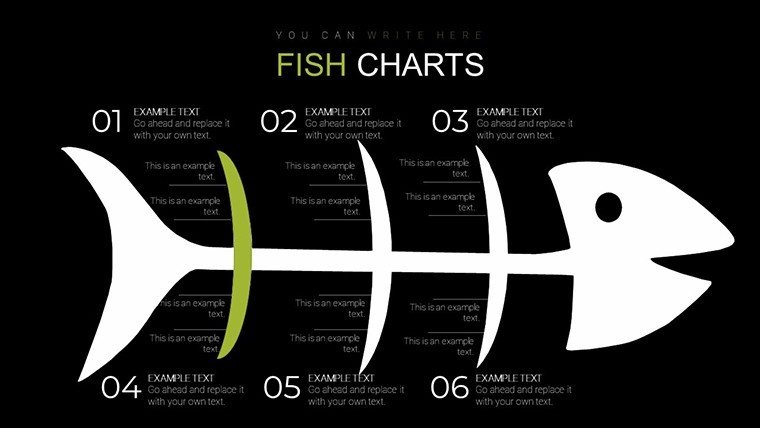
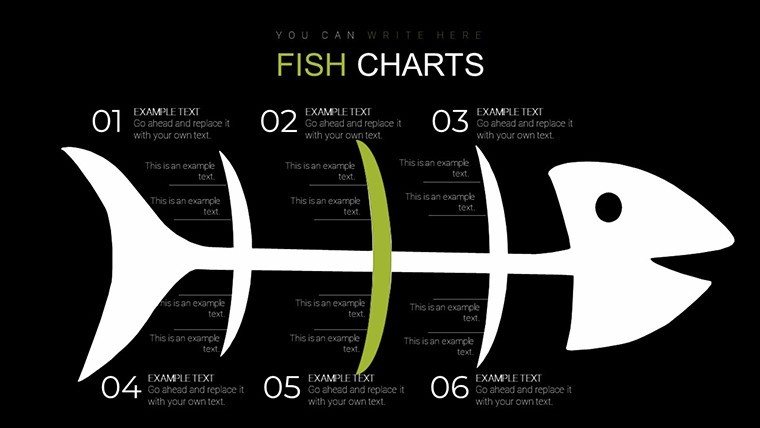
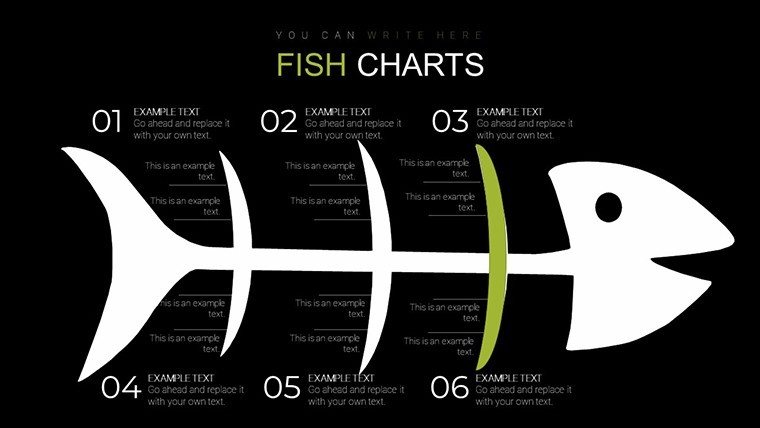
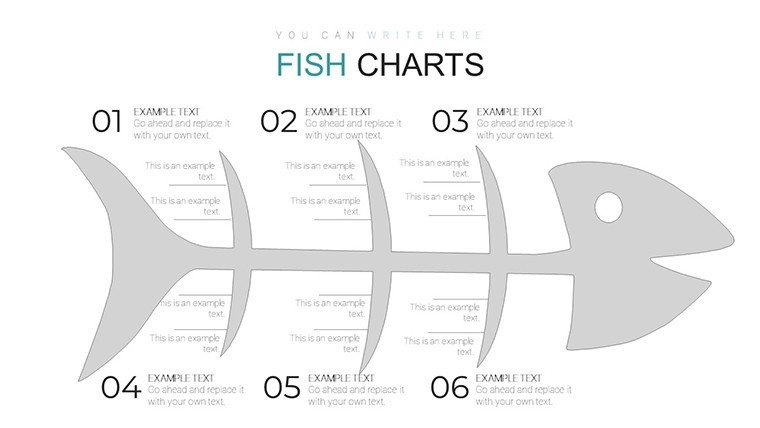
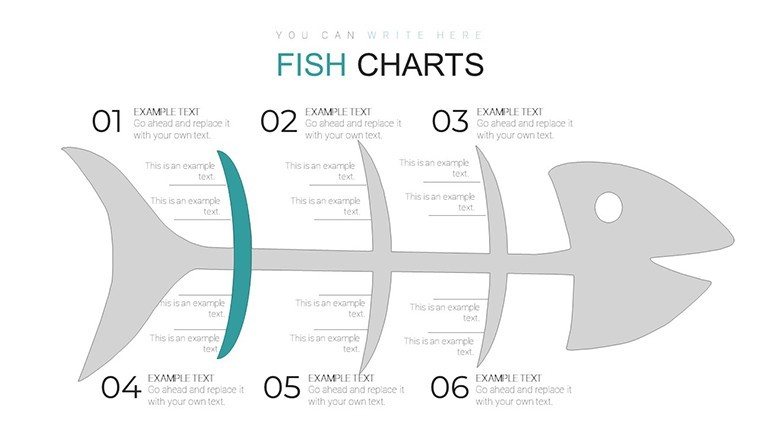
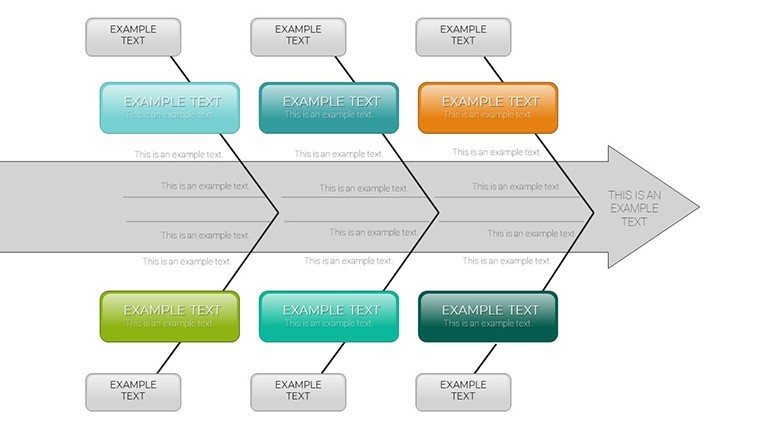
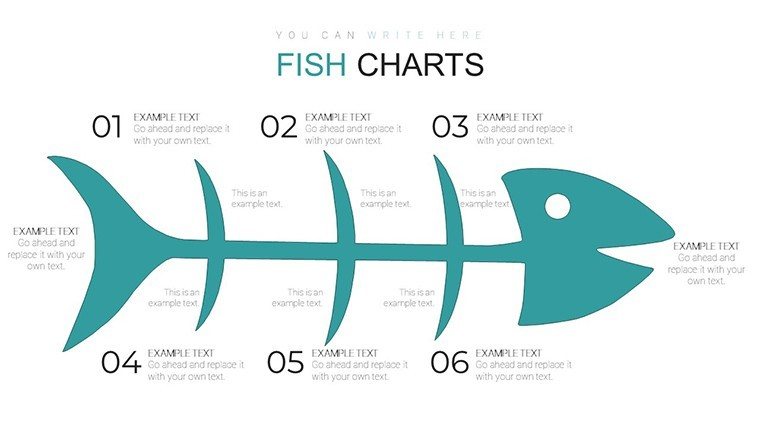
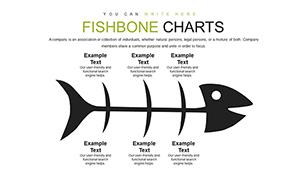
The template revolves around the fishbone structure, with a head for the effect and bones for causes. Slides vary from basic skeletons to detailed versions with sub-branches, allowing progressive builds. Editability shines: change fonts for emphasis, recolor categories to denote priority, or add images for illustrative power. This goes beyond static charts, offering a canvas for interactive sessions.
Essential Features for Collaborative Analysis
- Editable Structures: Modify the fishbone's spine and ribs to fit your specific problem scope.
- Category Flexibility: Pre-labeled with common groups, but easily renamed for industry-specific needs.
- Visual Aids: Incorporate icons, arrows, and notes to enrich cause descriptions.
- Compatibility: Works flawlessly in PowerPoint and Google Slides for cross-platform use.
- Layout Variety: Includes horizontal and vertical orientations for diverse presentation styles.
These tackle the chaos of unorganized discussions, providing a methodical path inspired by total quality management.
Applying Fishbone in Diverse Contexts
For process improvement in manufacturing, map defects to materials or machines. In education, dissect student performance issues across curriculum, teaching methods, and resources. Business meetings can use it for strategy reviews, like why a campaign underperformed. A case from healthcare: Using fishbone, a clinic identified staffing as a key cause of delays, leading to targeted hires and improved patient flow.
Guided Process for Building Your Diagram
- State the effect: Place the problem at the fish head on your selected slide.
- Brainstorm categories: Use team input to define major cause groups.
- Detail sub-causes: Add branches with evidence or hypotheses.
- Prioritize: Highlight critical paths with bold lines or colors.
- Action plan: Dedicate slides to solutions tied to identified causes.
This method outperforms ad-hoc notes, aligning with methodologies like DMAIC in Six Sigma for measurable outcomes.
Strategies to Amplify Your Fishbone Sessions
Foster inclusivity by rotating input rounds, ensuring all voices contribute. Combine with voting dots for cause ranking. For authority, reference Ishikawa's original work in automotive quality. In a software firm example, fishbone analysis resolved bugs faster, cutting downtime by 40%. Link to tools like MindMeister for digital expansions or export for reports.
The template's reliable design instills confidence, making your analyses trustworthy and forward-thinking.
Transform Challenges into Triumphs
Armed with 22 versatile slides, this fishbone template is your go-to for insightful diagnostics. It's crafted for those who value precision in problem-solving. Why wait on resolutions? Acquire this essential tool today and fish out the roots of success.
Frequently Asked Questions
What's the difference from Ishikawa?
Fishbone is another name for Ishikawa; this template uses the same principle.
How customizable are the diagrams?
Fully - alter layouts, add/remove branches, and personalize visuals.
Suitable for virtual teams?
Yes, Google Slides compatibility enables remote collaboration.
Can it handle complex problems?
Absolutely; use multiple slides for layered analyses.
Are there pre-filled examples?
Placeholders guide you; fill with your context for relevance.
Integration with other tools?
Easily export to PDFs or link data from Excel.
Good for
- Project roadmaps and sprint plans
- Product launch timelines
- Quarterly or annual review decks
- Company history and milestone summaries
Licence
reviews
The infographic slides were useful for my school project.
I liked the simple arrow diagrams because they explained the process clearly.
Some pages felt repetitive but I still used most of them.
Pretty fast to customize even on an older laptop.
I added my own icons and the whole thing looked more personal after that.
FAQ
Will it work in Google Slides?
Are fonts embedded?
Can I use this for client work?
What's the refund policy?
Do you update the template after purchase?
Similar templates
See all PowerPoint Charts →
All 22 slides