 Click to zoom
Binoculars Search Marketing Keynote Charts Template: Zoom In on Insights
| Format | .pptx |
| Slides | 59 unique layouts |
| Aspect ratio | 16:9 |
| Compatibility | PowerPoint |
| Animated | No |
| Language | English |
| License | Commercial |
| File size | — |
| Version | v1.0 |
| Last updated | September 2023 |
What's inside
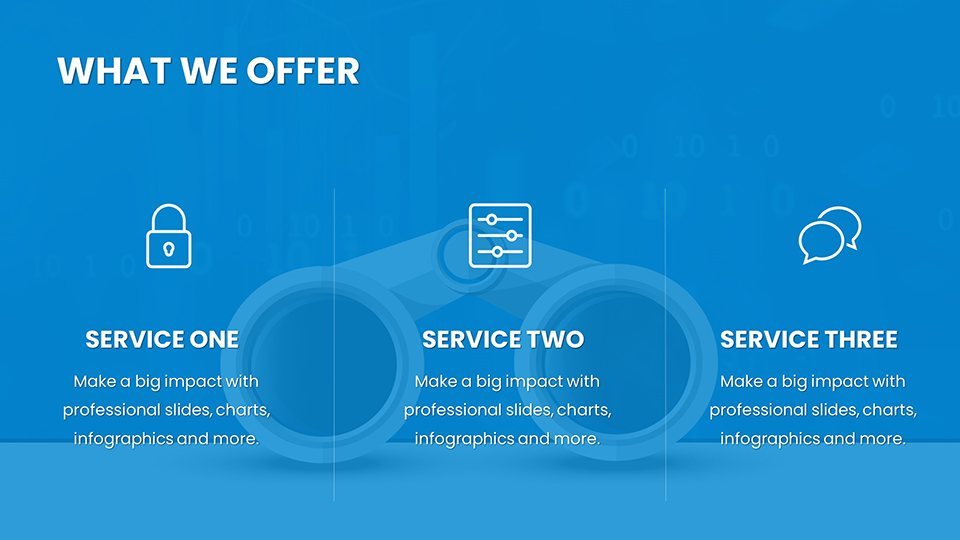
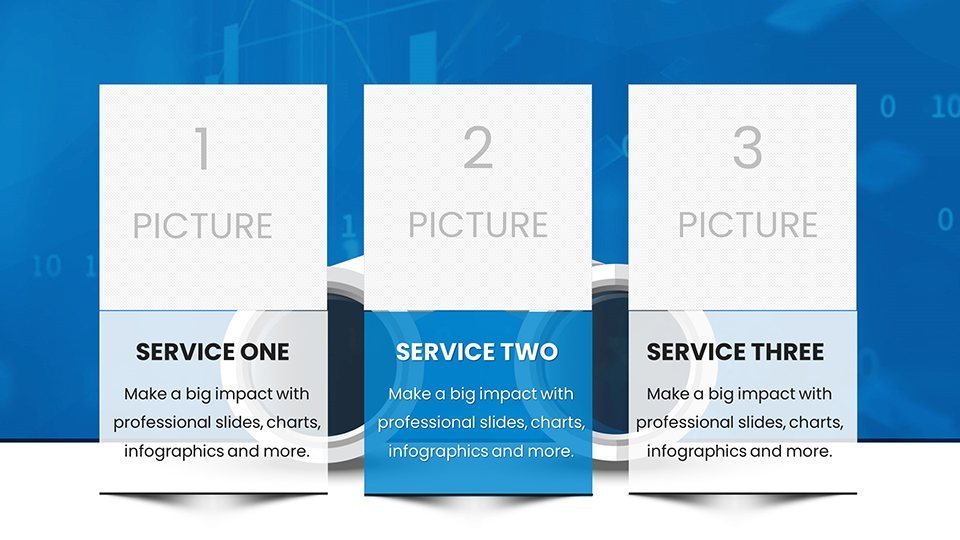
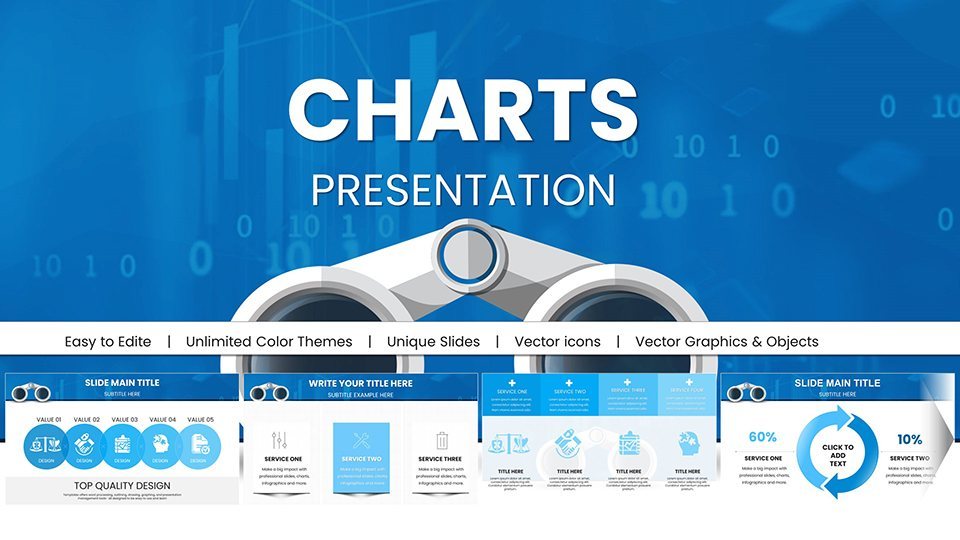
Picture this: you're presenting a marketing strategy for outdoor gear, and your slides need to capture the vast landscape of consumer trends like a pair of high-powered binoculars. The Binoculars Search Marketing Keynote Charts template is your go-to tool, offering 59 editable slides designed specifically for Keynote users. This template merges the thrill of exploration - think birdwatching or stadium views - with sharp marketing analytics, helping you spotlight opportunities in a crowded market. Aimed at nature lovers, sports enthusiasts, and marketing mavens, it turns complex data into clear, engaging visuals. Inspired by real campaigns from brands like REI or Nikon, where visual storytelling drives sales, this resource equips you to craft pitches that resonate. No more fuzzy overviews; get crystal-clear presentations that guide your audience to actionable insights, all while saving time on design.
Unveiling Key Features for Sharp Presentations
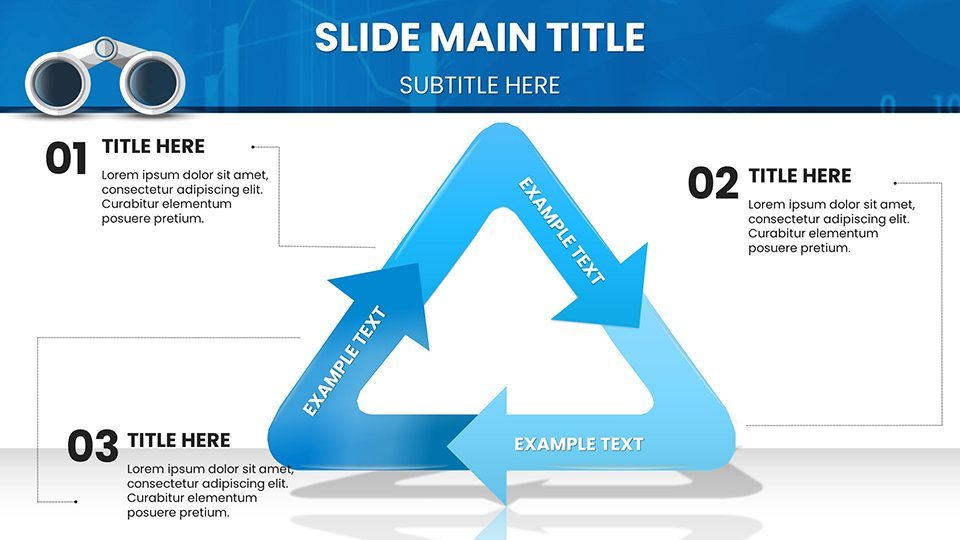
Dive into a world where every slide enhances your narrative. This template boasts intuitive layouts that integrate seamlessly with Keynote's features, allowing quick customizations. From magnification-themed icons to search-optimized color schemes in greens and earth tones, it's built for thematic consistency. Features include drag-and-drop chart placeholders, ensuring even novices can create pro-level visuals. For example, use the "zoom lens" infographics to drill down into user demographics, much like how SEO experts analyze search intent. Aligned with marketing best practices from the American Marketing Association, these elements prioritize clarity, reducing cognitive load for viewers and amplifying message retention.
Navigating Chart Types for Data Exploration
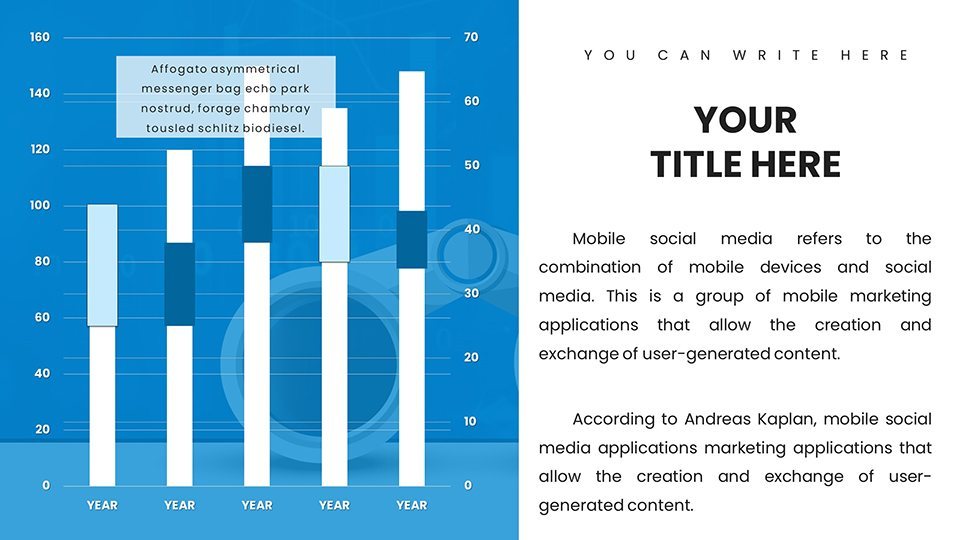
Charts here aren't generic; they're tailored to search marketing dynamics. Explore funnel charts that mimic binocular views, narrowing from broad awareness to targeted conversions. Or deploy heat maps for keyword performance, highlighting hot spots in your strategy. Each chart is fully editable - adjust axes, legends, and data series with ease. In a case study scenario, imagine a sports brand using bubble charts to correlate ad spend with event attendance, revealing untapped markets. This versatility extends to comparative graphs, perfect for A/B testing search campaigns, drawing from methodologies in books like "This is Marketing" by Seth Godin.
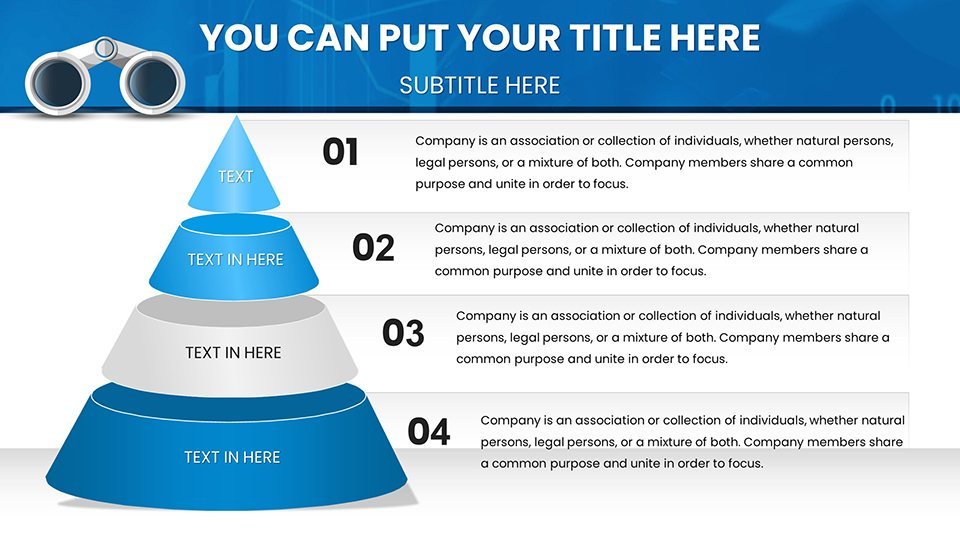
- Funnel and Pyramid Charts: Ideal for conversion paths, with binocular motifs for visual flair.
- Heat and Radar Charts: For multidimensional analysis, like competitor landscapes.
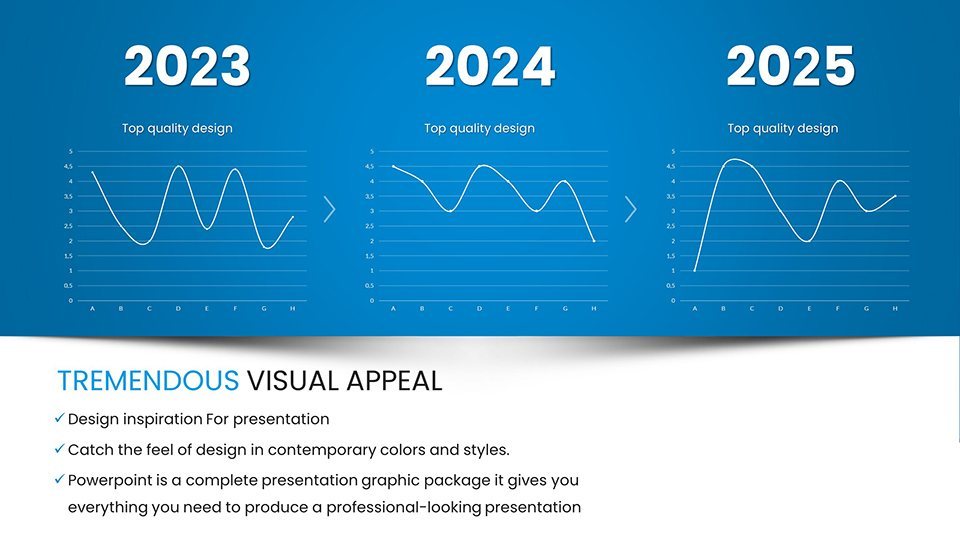
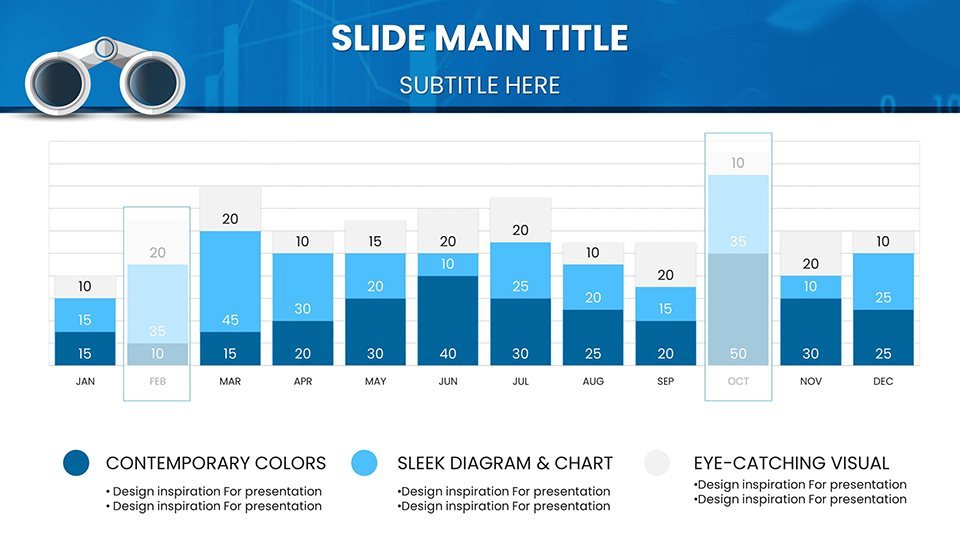
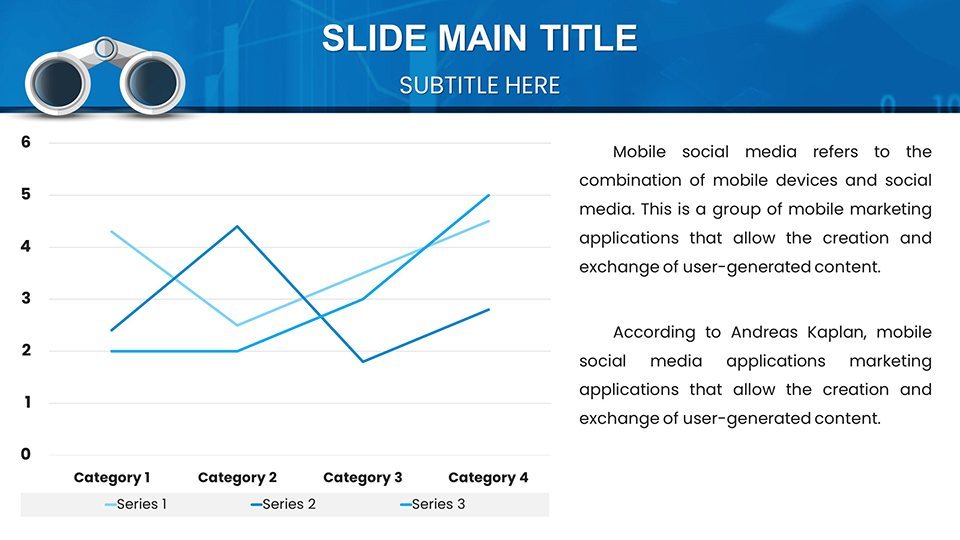
- Bar and Line Hybrids: Track trends over time, emphasizing search volume fluctuations.
- Infographic Elements: Custom icons for passions like hiking or birding.
Tailoring to Your Audience's Passions
Whether you're pitching to nature enthusiasts or sports fans, this template adapts effortlessly. Customize slides to include real-time data imports from tools like Google Analytics, transforming static presentations into dynamic discussions. For marketers, integrate SEO metrics with ease, using pre-built tables for keyword rankings. A practical tip: layer animations to "reveal" insights, simulating a focus pull in binoculars, which keeps engagement high. Users in fields like e-commerce report faster preparation times, allowing more focus on strategy - echoing efficiencies seen in agile marketing teams.
Strategic Use Cases in Marketing and Beyond
Apply this template across scenarios: a marketing agency presenting SEO audits with visual timelines, or a product manager showcasing user preference surveys via pie charts. In outdoor retail, use it to compare binocular models' market share, backed by data from industry reports like those from Statista. Educators might employ it for teaching digital marketing, with slides breaking down search algorithms. Step-by-step: Start by outlining your objectives, populate charts with data, refine visuals for brand alignment, and rehearse transitions. This workflow not only streamlines creation but ensures presentations align with user intent, boosting conversion rates.
- Define your search marketing goals.
- Select and edit relevant charts.
- Incorporate audience-specific examples.
- Present with interactive elements.
Elevate Your Pitches with Data-Driven Flair
Stand out by blending passion with precision - this template's unique selling point. Unlike standard charts, it incorporates thematic elements that make abstract concepts tangible, fostering deeper connections. Compatible with recent Keynote updates, it includes widescreen options for modern displays. With over 70 ratings attesting to its value, it's a trustworthy choice for refining skills. Weave in LSI terms like "SEO visualization" naturally to enhance search relevance. For those in competitive fields, this is your lens to clarity. Focus your efforts - download and customize for sharper outcomes now.
Frequently Asked Questions
What makes this template unique for marketing?
It integrates binoculars-themed visuals with search marketing tools, perfect for niche pitches.
How many slides can I customize?
All 59 are editable, from data inputs to design elements.
Does it support data import?
Yes, easily import from spreadsheets into Keynote charts.
Is it suitable for beginners?
Absolutely, with intuitive drag-and-drop features.
What industries benefit most?
Outdoor, sports, and digital marketing sectors thrive with it.
Good for
- Project roadmaps and sprint plans
- Product launch timelines
- Quarterly or annual review decks
- Company history and milestone summaries
Licence
reviews
A solid template for the price but I wish there were more chart types.
Worked well for my climate change talk the biodiversity loss slides were a hit.
The emission level bar graphs are easy to customize but the text boxes are small.
Not the most amazing template but it saved me a few hours of design work.
The vector elements scaled well for my print report so that was a plus.
FAQ
Will it work in Google Slides?
Are fonts embedded?
Can I use this for client work?
What's the refund policy?
Do you update the template after purchase?
Similar templates
See all Keynote Charts →

All 59 slides