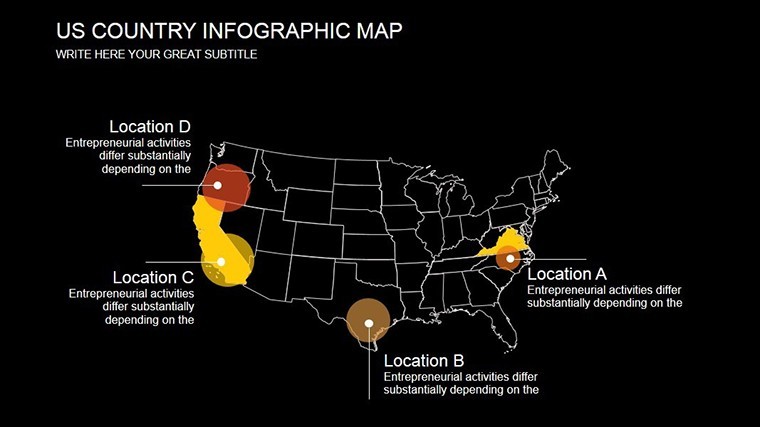
 Click to zoom
Animated Infographic Keynote Charts: 17 Dynamic Slides
| Format | .pptx |
| Slides | 17 unique layouts |
| Aspect ratio | 16:9 |
| Compatibility | PowerPoint |
| Animated | No |
| Language | English |
| License | Commercial |
| File size | — |
| Version | v1.0 |
| Last updated | December 2020 |
What's inside
Data doesn't have to be dry - it can swirl, zoom, and inspire like a well-choreographed dance. Our Animated Infographic Keynote Charts template redefines presentation visuals with 17 meticulously crafted slides that blend illustration prowess with Keynote's animation magic. Tailored for designers, educators, and content creators who crave engagement over ennui, this pack turns stats into spectacles, whether you're decoding market trends or narrating project milestones.
Envision unveiling a process flow where icons cascade like digital rain, each drop revealing a step in your workflow. Pulled from successes like a tech startup's investor deck that went viral thanks to hypnotic timelines, this template champions vector icons and PNG overlays for hybrid flexibility. Fully editable, it invites your tweaks - from color floods to timing tweaks - ensuring every reveal aligns with your story's rhythm.
Its edge? A fusion of form and function, covering LSI staples like flowchart diagrams and stat wheels, all while prioritizing accessibility with high-contrast defaults. Export to video for social shares, or keep it interactive for live sessions.
Features That Animate Your Ideas
Powered by custom effects, these slides aren't static sketches; they're living illustrations. Think slide transitions that morph shapes seamlessly, or icons that assemble puzzle-like to form bigger pictures.
- 17 Illustrated Slides: Diverse types from timelines to comparison matrices, all infographic-forward.
- Vector & PNG Assets: Scalable icons plus raster backups for complex textures.
- Animated Flourishes: Build paths, fades, and spins - tweak durations per slide.
- Color Variations: Five schemes, from earthy tones to neon pops, all theme-switchable.
From Sketch to Screen: Quick Customization
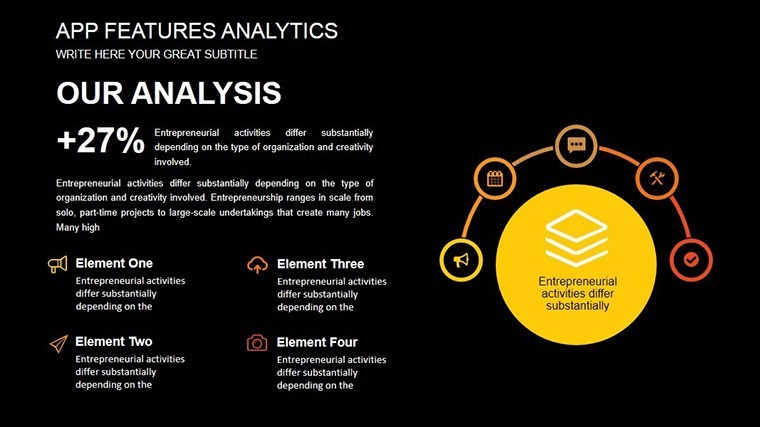
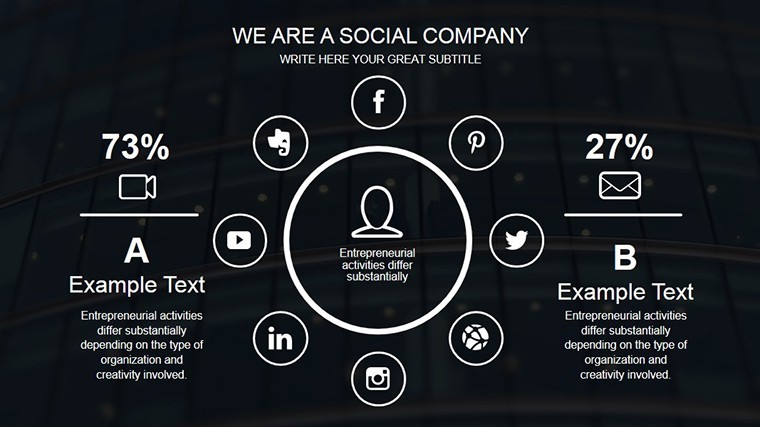
Slide 2's hero: A radial infographic orbiting key facts around a central theme, with spokes animating outward like expanding horizons. For novices, drag icons from the library; pros, layer blends for depth. A graphic designer we know halved revision cycles by using this for client mood boards, where animations simulated user journeys vividly.
Use Cases: Infusing Life into Narratives
In education, animate historical timelines - events popping like fireworks to engage Gen Z learners. For marketing, craft product roadmaps where milestones bloom sequentially, turning abstracts into roadshows that seal partnerships.
Creative agencies deploy it for pitch books: Infuse brand stories with custom icons, like architecture visuals where blueprints unfold into 3D models via simple rotations. One firm landed a redesign gig by animating space utilization stats, making square footage feel alive.
- Import Assets: Drop SVGs or photos; auto-align to grid.
- Sequence Animations: Chain effects - e.g., text flies in as charts rise.
- Test Interactivity: Play mode reveals hitches early.
- Output Options: GIF exports for teasers or full MP4s for reels.
Versus Plain Graphics: The Animation Advantage
Standard infographics inform; animated ones immerse. While Canva templates loop generically, ours respond to Keynote's timeline precision, syncing with voiceovers flawlessly. Adhering to Nielsen's usability heuristics, elements avoid clutter, focusing on progressive disclosure.
Workflow boost: Integrate with Adobe Illustrator for icon tweaks, then paste back - seamless. For urban planners, visualize growth projections with animated layers stacking like building floors, per ASCE guidelines for clear comms.
Slide Spotlights and Design Wisdom
Spotlight Slide 10: A stepped pyramid for hierarchy breakdowns, with blocks stacking via momentum physics for realism. Wisdom: Balance motion with pauses - under 5 seconds per build keeps pulses racing without racing ahead.
For collaborative projects, share via Keynote Live; co-edit animations in tandem. The payoff? Decks that don't just show data - they show vision.
Animate your edge: Grab this Infographic template and let your ideas move mountains.
Frequently Asked Questions
Does it work on Windows?
Keynote-exclusive, but .key files open in compatible apps like iCloud web.
How many animations per slide?
Up to 20 layered effects; prioritize for performance.
Are icons royalty-free?
Yes, all original vectors for commercial use.
Can I remove animations?
Easily - select and delete paths, reverting to static.
Integration with other tools?
Pastes from Sketch or Figma; exports to After Effects.
Good for
- Project roadmaps and sprint plans
- Product launch timelines
- Quarterly or annual review decks
- Company history and milestone summaries
Licence
reviews
School data slides were organized
Work presentation charts were fine after customization
Graphs were readable and useful
I used it fast and it worked
FAQ
Will it work in Google Slides?
Are fonts embedded?
Can I use this for client work?
What's the refund policy?
Do you update the template after purchase?
Similar templates
See all Keynote Charts →
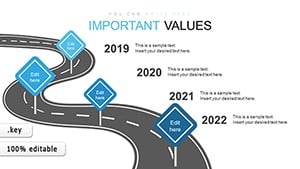
All 17 slides