 Click to zoom
Activity Based Costing PowerPoint Template: Arrow Through Cost Complexities
| Format | .pptx |
| Slides | 18 unique layouts |
| Aspect ratio | 16:9 |
| Compatibility | PowerPoint |
| Animated | No |
| Language | English |
| License | Commercial |
| File size | — |
| Version | v1.0 |
| Last updated | January 2022 |
What's inside
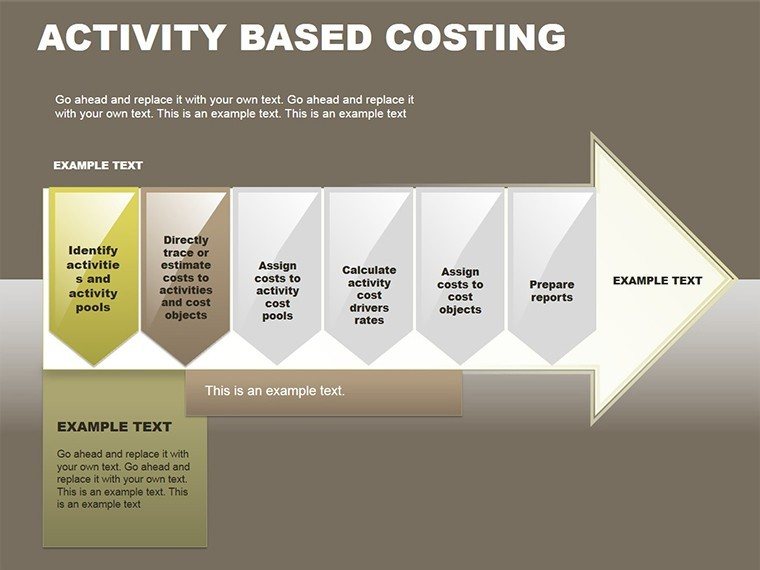
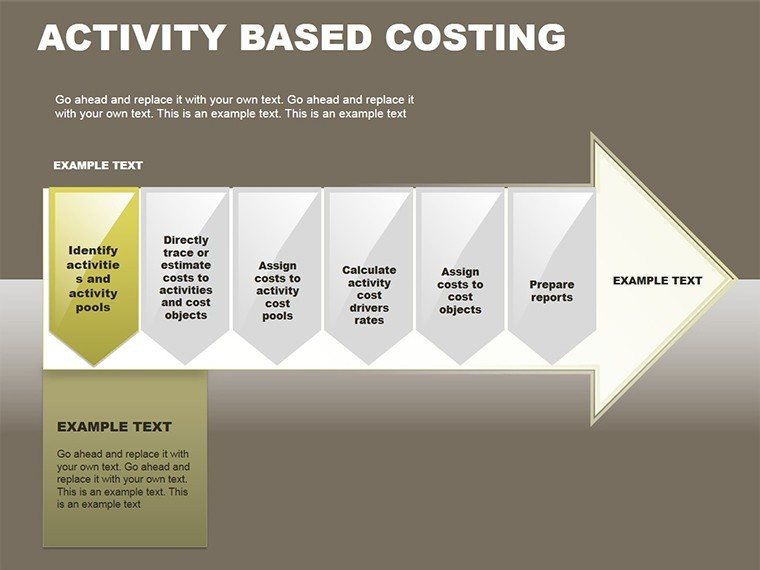
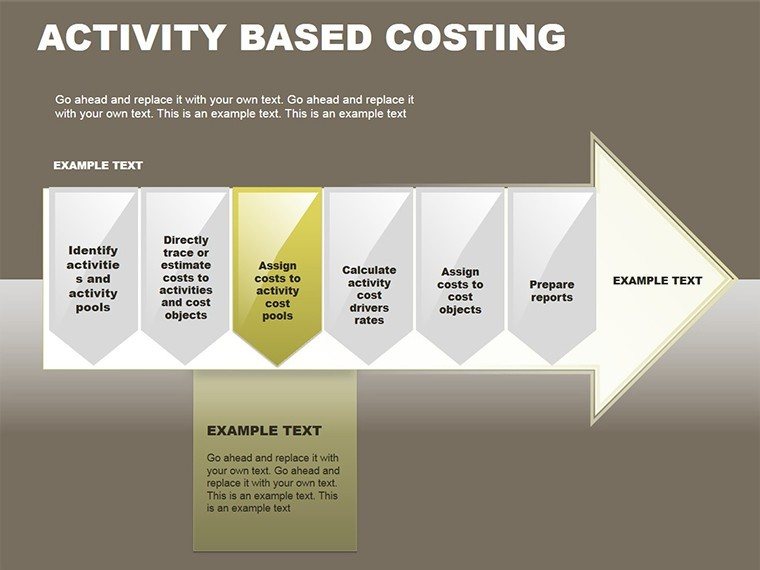
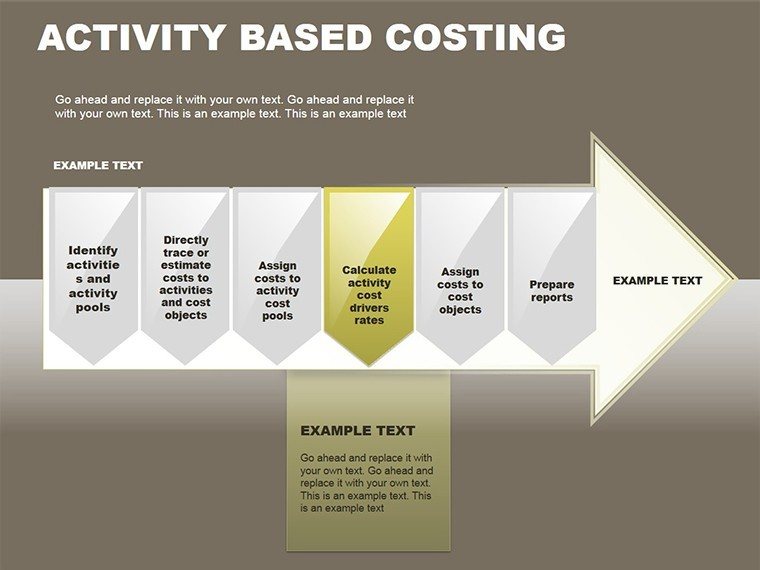
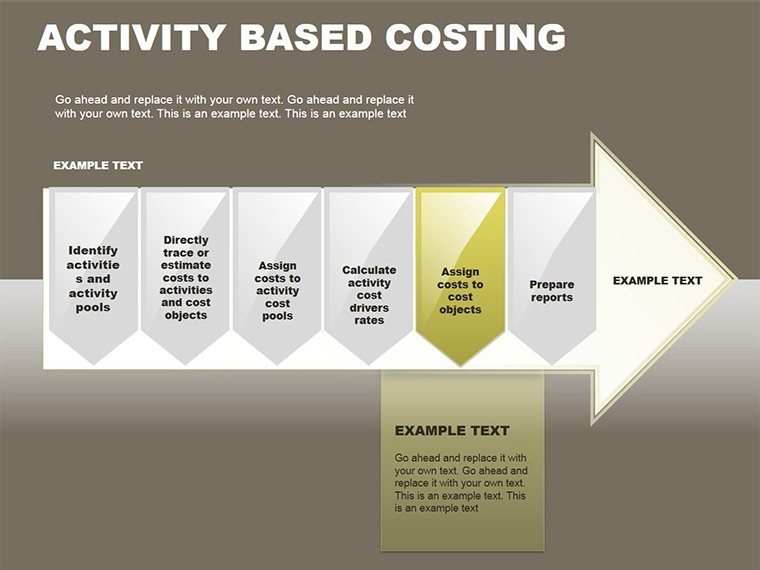
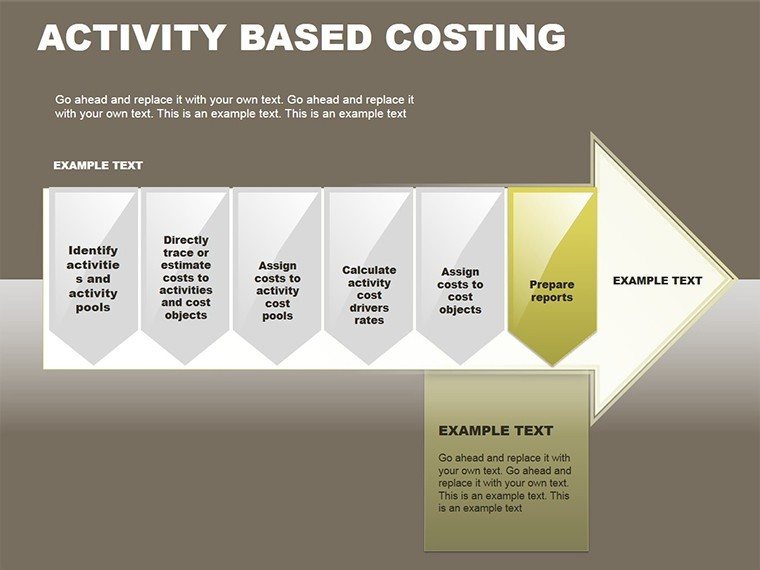
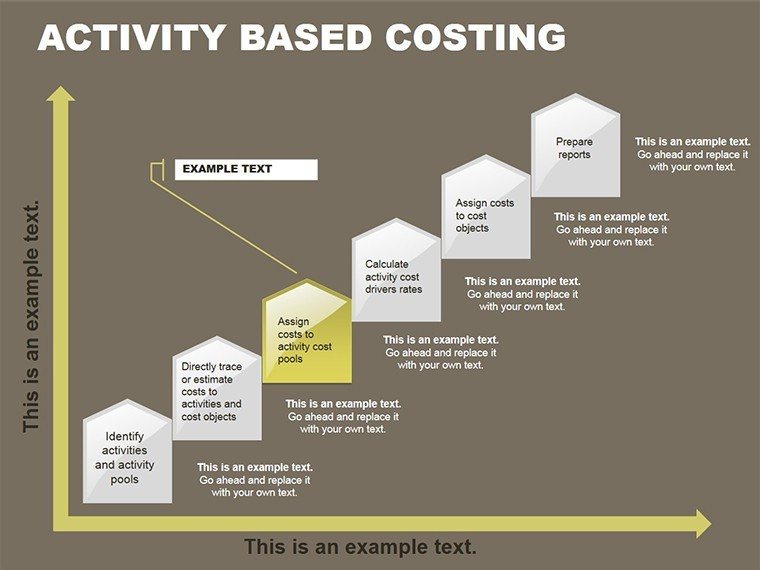
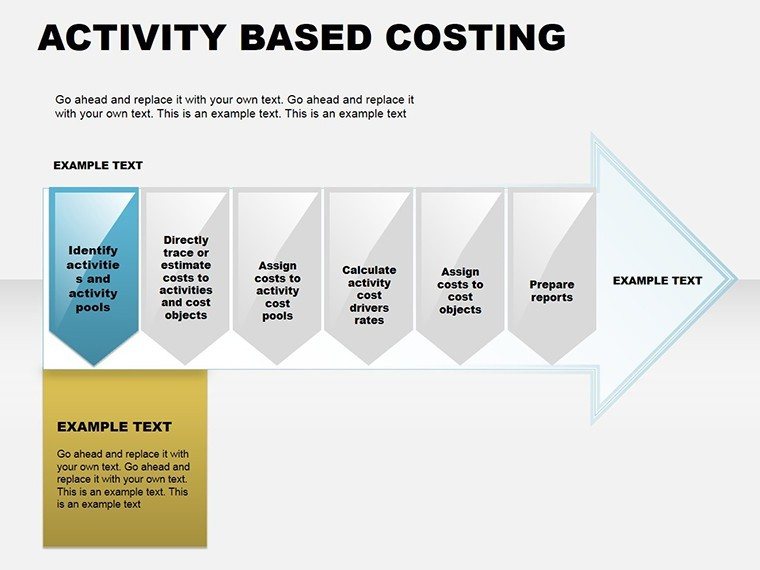
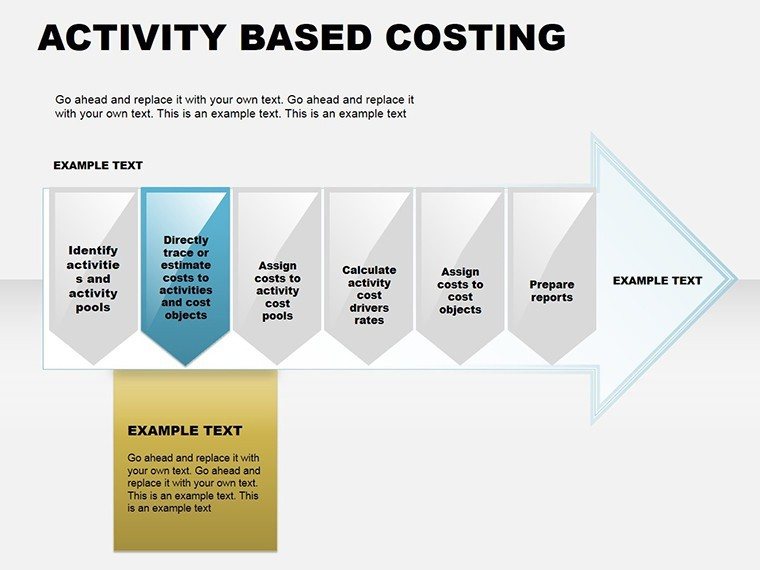
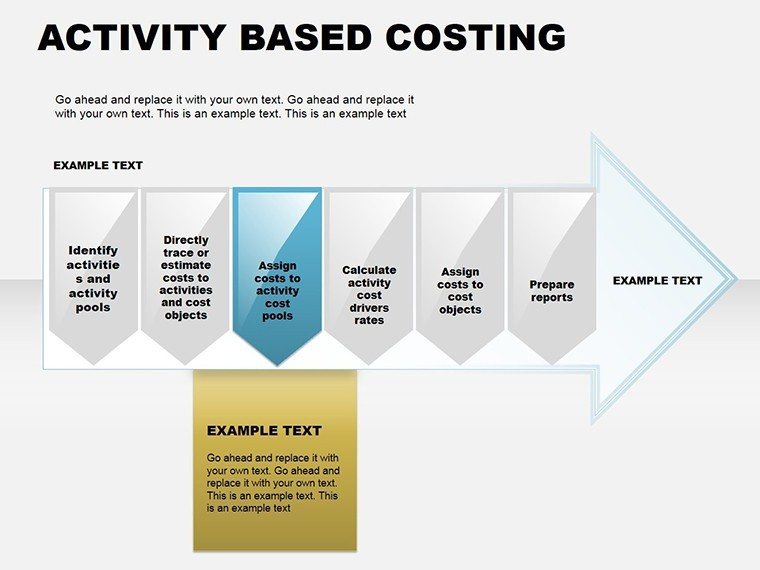
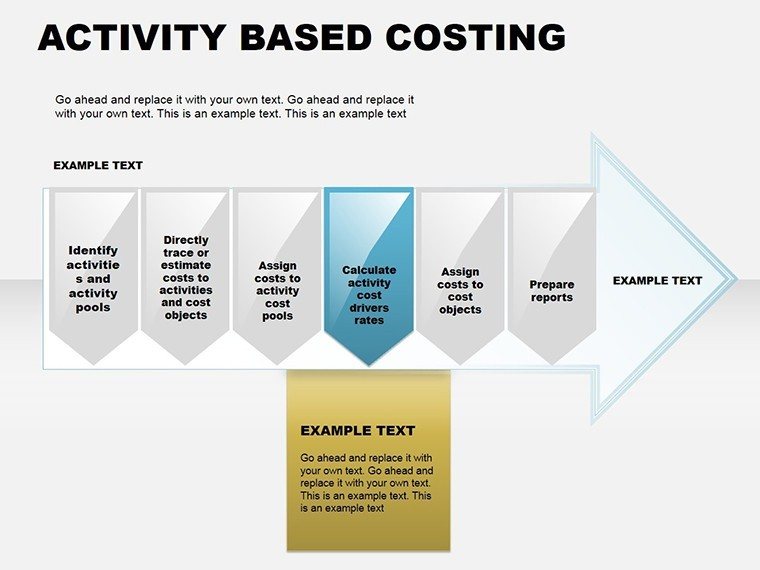
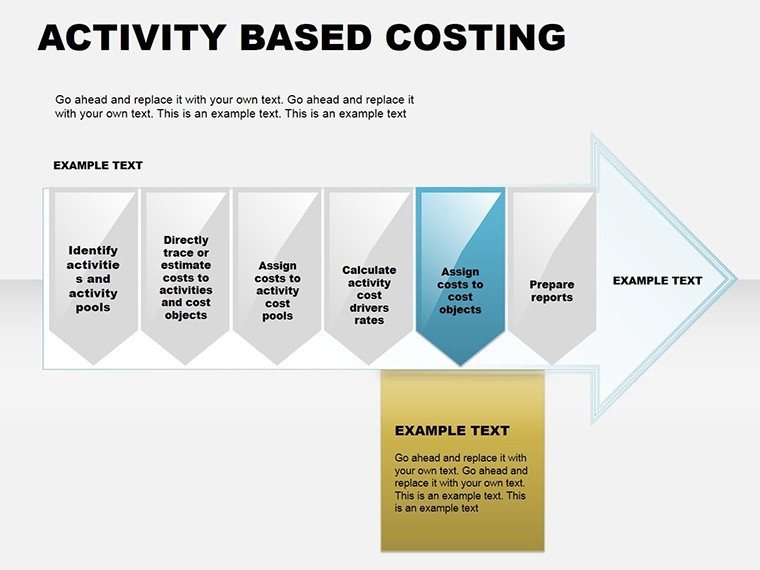
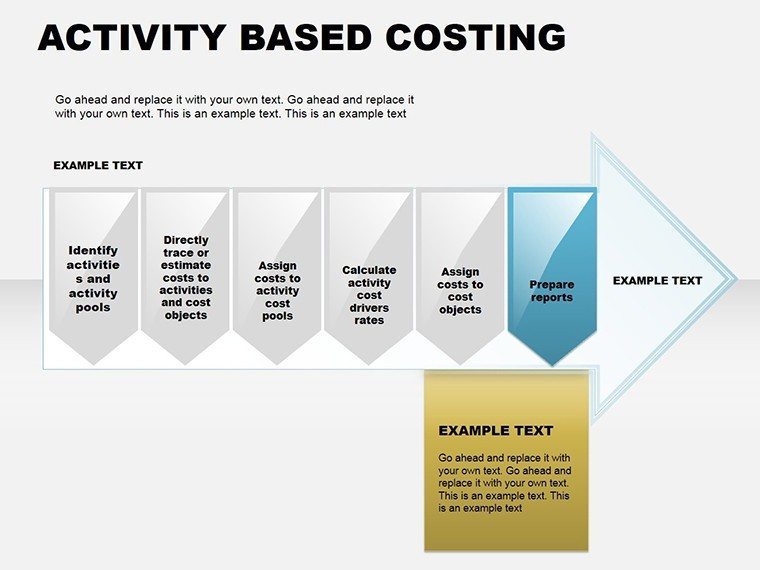
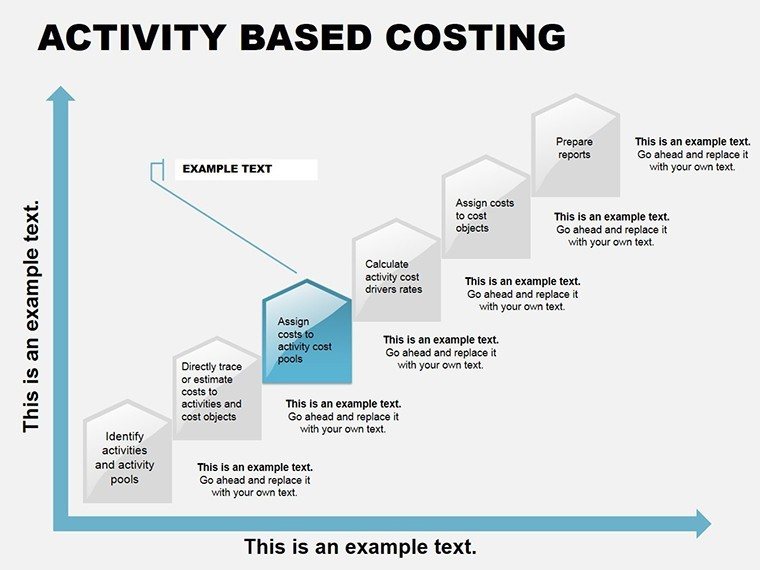
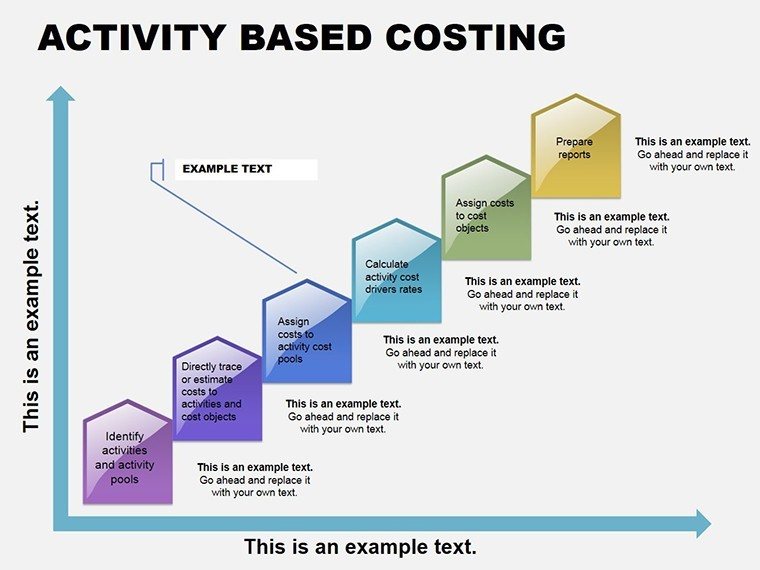
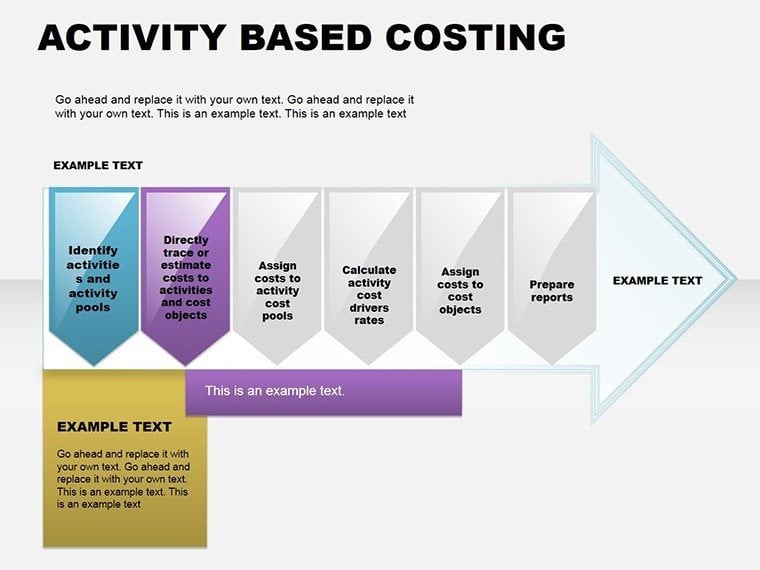
In the fast-paced world of finance, where every dollar's path needs tracing, clarity isn't a luxury - it's a necessity. Enter the Activity Based Costing PowerPoint diagram template, a precision tool for dissecting costs with surgical accuracy. Tailored for accountants, controllers, and business analysts, this template uses dynamic arrow diagrams to map activities, resources, and outcomes, revealing hidden inefficiencies that flat spreadsheets obscure. With 18 editable slides, you can copy-paste elements into any deck, adapting variants to spotlight specific costing scenarios like overhead allocation or process optimization.
Think of it as your visual compass in cost management: arrows point directly to drivers, showing how routine tasks consume budgets and where tweaks yield savings. Whether preparing for an audit presentation or a management review, this template turns dense data into directional stories that guide decisions. No more vague pie charts; instead, flowing arrows that mimic real workflows, making your points land with direction and force. Compatible with PowerPoint 2013 onward, it's designed for quick edits - swap arrow styles, recolor paths, or layer in metrics - all while maintaining professional polish.
Priced at a straightforward $12, this isn't just a download; it's a shortcut to presentations that drive action. Ideal for sectors like manufacturing or services, where activity costing uncovers profit levers.
Essential Features for Cost-Focused Flow
This template's strength lies in its arrow-centric design, offering 18 slides that evolve from basic linear flows to intricate multi-path networks. Each variant emphasizes changes in costing logic, ensuring flexibility for diverse needs.
- Arrow Variants: Straight, curved, and clustered arrows to represent sequential, parallel, or branching activities.
- Editable Metrics: Nodes for inputting costs, volumes, and rates, with auto-formatting for consistency.
- Layered Transparency: Overlapping paths to show interactions without visual chaos.
- Built-in Legends: Customizable keys that explain symbols, keeping audiences oriented.
These elements draw from standard costing frameworks, akin to how process engineers diagram assembly lines - precise, directional, and revealing.
Guide to Building Your Costing Deck
Assembly is intuitive, mirroring the costing process itself. Launch in PowerPoint, and the slides await your inputs.
- Pick Your Base Arrow: Start with a linear slide for straightforward activity chains, like "Order Processing to Billing."
- Assign Costs: Click arrow heads to add labels - e.g., "$5K in Labor" - and watch connectors adjust proportionally.
- Introduce Branches: For complex scenarios, use forked slides to diverge paths, such as "Direct vs. Indirect Costs."
- Integrate Data: Link to Excel for live updates, ensuring your diagram reflects real-time figures.
- Animate Directions: Set arrows to appear in sequence, tracing the cost journey from activity to allocation.
Expect to refine a full analysis in 45 minutes, a fraction of the time spent wrestling with generic shapes.
Practical Use Cases: Directing Financial Narratives
Finance pros swear by this for targeted storytelling. A cost accountant at a logistics firm, for instance, deploys it during budget cycles: root arrows in "Inbound Logistics," fanning out to sub-activities like sorting and storage, each tagged with per-unit costs. When variances arise, the diagram pinpoints culprits, sparking focused tweaks over broad cuts.
In consulting, partners use branched variants for client audits - central arrow for "Overhead Pool," splitting to departmental sinks. This visual audit trail, reminiscent of flowchart techniques in lean management, empowers stakeholders to question and refine without confusion.
For operational reviews, managers illustrate process improvements: pre- and post- arrows side-by-side, highlighting streamlined paths that reduce activity drags.
Versus Basic Diagramming
PowerPoint's default arrows? Functional but flat. This template adds costing-specific tweaks, like scalable widths for volume emphasis, turning simple lines into insightful vectors.
Expert Tips to Sharpen Your Arrows
Limit arrows per slide to five for digestibility; use bold for high-impact paths. For virtual meetings, opt for high-res exports to preserve sharpness. Regularly archive versions to track costing evolutions, integrating into your ERP workflow for ongoing relevance.
Want to point your presentations toward precision? Secure the Activity Based Costing template for $12 and start directing today.
Frequently Asked Questions
What makes this template unique for costing?
It specializes in arrow diagrams tailored to activity flows, with variants for easy adaptation to different cost models.
Are the slides fully editable?
Yes, every arrow, text, and shape can be modified to fit your specific data.
Which PowerPoint versions does it support?
Compatible with PowerPoint 2013, 2016, 2019, and Microsoft 365.
Can I use it for non-financial presentations?
While optimized for costing, the arrow structures work for any process mapping.
Does it include data import features?
Slides support hyperlinks to Excel, but no automated import - manual entry ensures control.
Good for
- Project roadmaps and sprint plans
- Product launch timelines
- Quarterly or annual review decks
- Company history and milestone summaries
Licence
reviews
I downloaded this for a last minute client deck.
The structure helped explain our workflow clearly.
Not every slide matched visually but I only needed a few anyway.
The icon sections were simple and useful.
Worked okay in PowerPoint without extra fixes.
FAQ
Will it work in Google Slides?
Are fonts embedded?
Can I use this for client work?
What's the refund policy?
Do you update the template after purchase?
Similar templates
See all Powerpoint Diagrams →
All 18 slides