 Click to zoom
Accumulation Keynote Charts - Capital Growth | Editable Keynote
| Format | .pptx |
| Slides | 24 unique layouts |
| Aspect ratio | 16:9 |
| Compatibility | PowerPoint |
| Animated | No |
| Language | English |
| License | Commercial |
| File size | — |
| Version | v1.0 |
| Last updated | April 2026 |
What's inside
24 Slides for Presenting Capital Accumulation - No Diagram Building Required
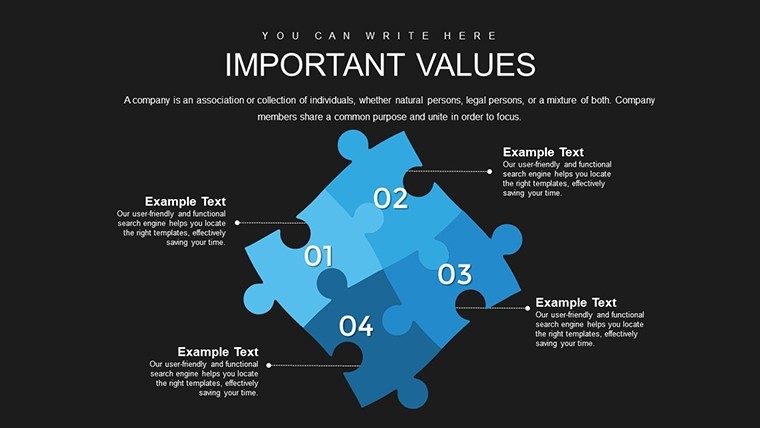
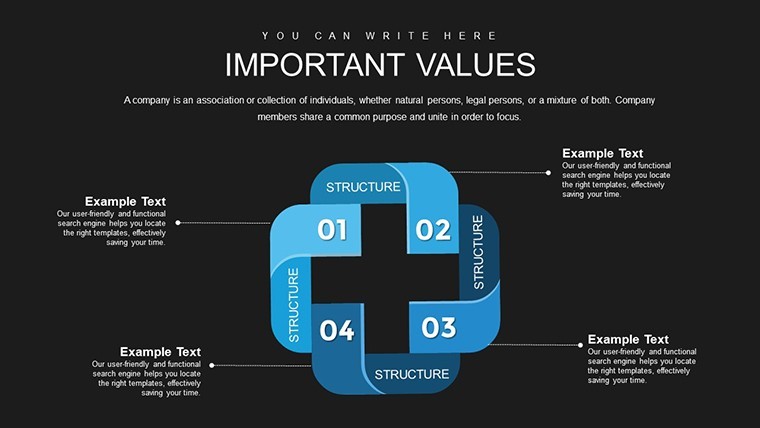
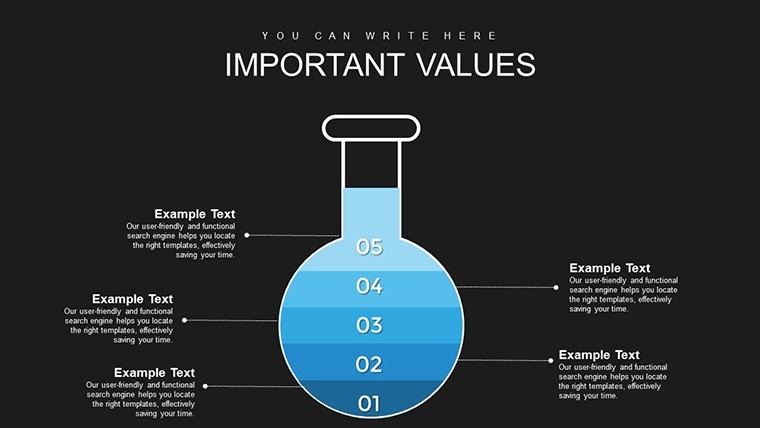
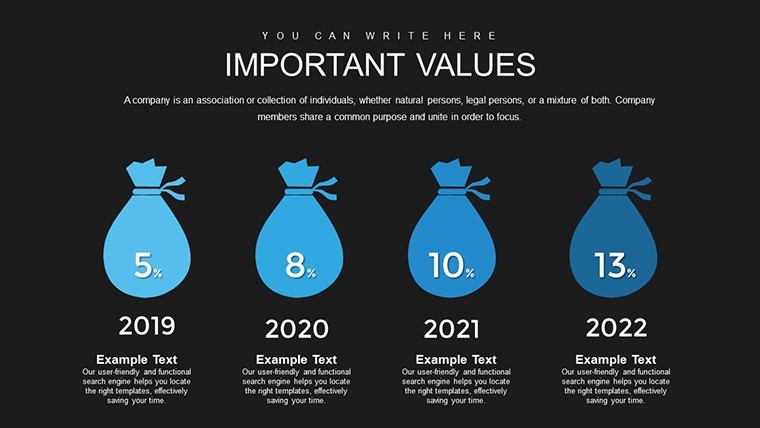
For quarterly board presentations or investor briefings where you need to show how reinvested profits translate into fixed or working capital growth, this Keynote chart template (KC00721) provides 24 editable slides in .key format at $15.00. The file is categorized under Puzzles and tagged for business analysis, auditing, and financial process visualization.
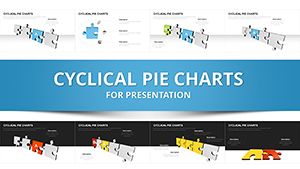
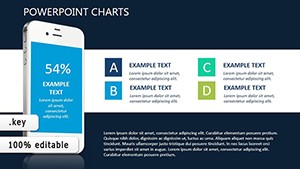
Visually, the layouts include vertical bar charts for comparing pre- and post-accumulation scenarios, pie charts divided into fixed versus working capital segments, line graphs for multi-period growth projections, and scatter plots suited for labor efficiency data. The icon style appears flat with outline elements. Structures are modular - each slide addresses a distinct analytical layer rather than layering all data onto one frame, which keeps individual slides readable without scrolling or zooming.
The functional value is comparative analysis. When you need to show a finance committee how capital allocation decisions - say, equipment investment versus headcount expansion - affect growth trajectories over multiple periods, the bar and line chart slides let you place those scenarios side by side. Viewers can draw conclusions about allocation priorities without parsing spreadsheet rows. A finance manager preparing an annual reinvestment report would typically drop in actuals on the bar chart slides and use the line graph slides for forward projections.
In most cases, you only replace text labels and swap in your numeric data. The slide structure handles the visual hierarchy. The page notes animated elements are included - basic animation setups are present in the file, which you can adjust or remove depending on the presentation context. Typically, teams reuse the same capital flow diagrams across quarterly updates by duplicating the slide group and updating figures.
Use this when you need to explain accumulation logic to stakeholders who are not economists - the visual separation of fixed capital (machinery, buildings) from working capital (labor, raw materials) makes the distinction immediate. Not designed for real-time data dashboards or presentations requiring live chart connections to external data sources. Works best for structured financial narratives, not exploratory data analysis.
The slide size is not explicitly listed as 16:9 on the page, but the standard Keynote widescreen format applies based on the .key file type. No free version is available - the full 24-slide set is the only purchase option.
Specifications
FeatureDetailsSlides24 editable slides - bar charts, pie charts, line graphs, scatter plots, capital flow diagramsFile format.key (Keynote)SoftwareKeynote (macOS / iOS); exact version not specified - standard .key format compatible with current Keynote installationsAspect ratioNot specified on page; standard Keynote widescreen (16:9) appliesColor schemesCustomizable; change themes to match corporate branding via slide masterEditable elementsChart data, scale values, icon colors, text labels - all editable directly in KeynoteAnimationsBasic animations included; adjustable or removable per slideFree vs PaidSingle paid tier at $15.00; no free version listedProduct IDKC00721You open the file and start editing. Download and start editing immediately
How do I change the color theme across all slides using Keynote's slide master?In Keynote, go to View > Edit Master Slides to access the master layout applied to this file. Update the accent color or background fill at the master level and Keynote will propagate the change to all slides using that master. For chart fill colors (bar charts, pie segments), double-click the chart element and use the Format panel on the right to adjust individual series colors. This approach is faster than editing each slide separately and keeps visual consistency across the 24-slide deck.
Can I use this file for client deliverables or commercial presentations?The standard ImagineLayout license covers personal and internal business use. If you plan to hand the file or a derived presentation to a client as part of a paid engagement, check the Terms of Use at imaginelayout.com/terms/ to confirm whether a commercial or extended license is required. Contact support before distributing to external parties to avoid license issues.
Is there a free version or trial of this template?No free version is listed for KC00721. The full 24-slide set is available as a one-time purchase at $15.00 with no recurring subscription. Some ImagineLayout products do offer free versions - check the Keynote Charts category page to find those if cost is a constraint.
What happens if the file is corrupted or doesn't open correctly?ImagineLayout's refund policy is available at imaginelayout.com/refund-policy/. Digital downloads are generally non-refundable, but technical issues with a corrupted or non-opening file are typically handled as exceptions. Document the issue, note your order number, and contact support promptly after the download - the earlier you report, the easier it is to resolve.
Which Keynote version is needed to open and edit this file?The page does not specify a minimum version, but the .key format is compatible with current Keynote on macOS and iOS. Keynote 12 or later (macOS Monterey and above) is recommended for full compatibility with animated elements and master slide editing. If you're on an older macOS, update Keynote from the App Store before opening the file to avoid rendering differences.
Browse related financial and business analysis files in the Puzzles Keynote Charts category or explore the full Keynote Charts collection.
Good for
- Project roadmaps and sprint plans
- Product launch timelines
- Quarterly or annual review decks
- Company history and milestone summaries
Licence
reviews
The charts and arrows made my workflow presentation easier to explain.
Not bad for quick office meetings.
Some text placeholders were too small though.
I liked that I could move everything around without breaking the layout.
Used it once already and probably will again.
FAQ
Will it work in Google Slides?
Are fonts embedded?
Can I use this for client work?
What's the refund policy?
Do you update the template after purchase?
Similar templates
See all Keynote Charts →

All 24 slides