 Click to zoom
8 Parts Real Estate Market Keynote Charts Template
| Format | .pptx |
| Slides | 27 unique layouts |
| Aspect ratio | 16:9 |
| Compatibility | PowerPoint |
| Animated | No |
| Language | English |
| License | Commercial |
| File size | — |
| Version | v1.0 |
| Last updated | December 2020 |
What's inside
Navigating the real estate landscape demands sharp, data-driven visuals that cut through the noise. The 8 Parts Real Estate Market Keynote Charts Template delivers exactly that, with 27 editable slides focused on dissecting market segments, growth factors, and future projections. Ideal for realtors, investors, and urban planners, this template turns raw stats into persuasive stories that close deals and inform strategies.
Optimized for Keynote on Mac, it imports smoothly into PowerPoint and Google Slides for versatile use. In an industry where visuals can sway decisions worth millions, this tool provides the edge with pie charts, segmented analyses, and trend lines tailored to real estate dynamics. Explore how it can fortify your next market report or client consultation.
Dissecting Market Dynamics with Precision
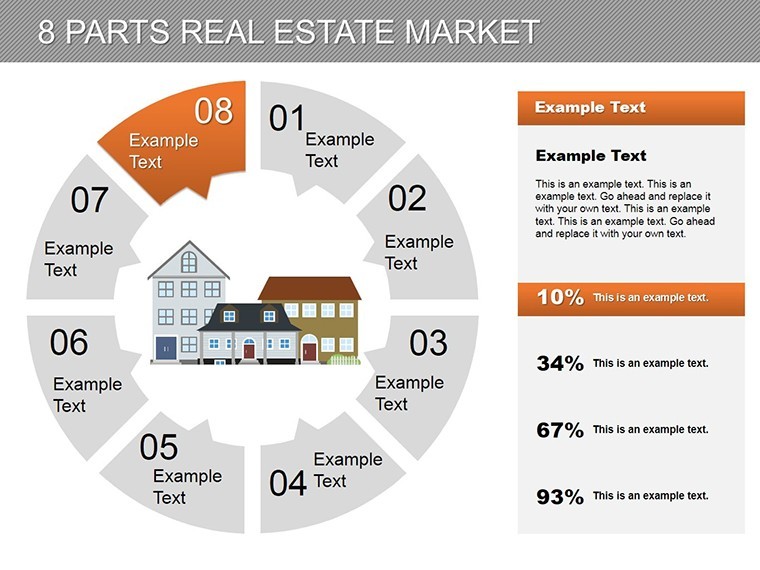
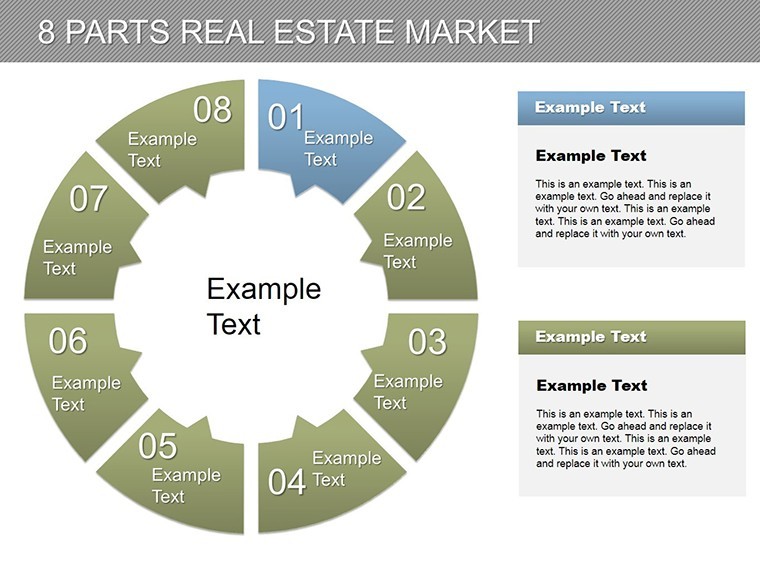
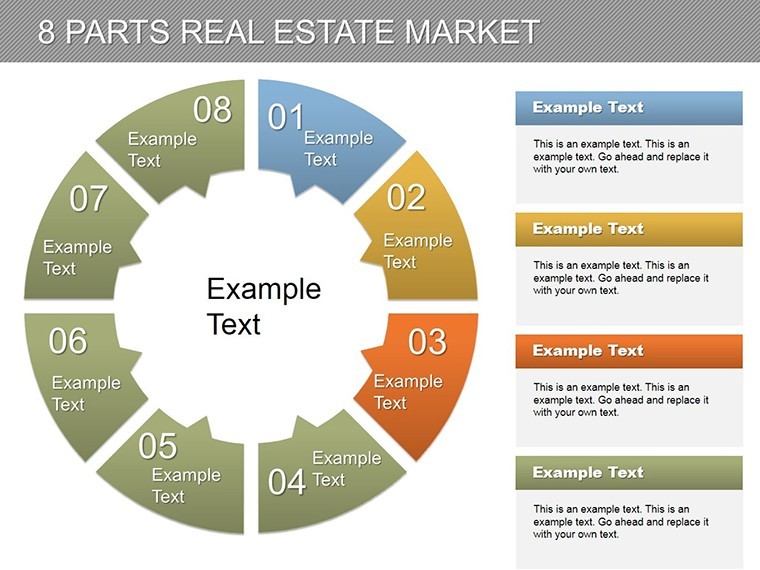
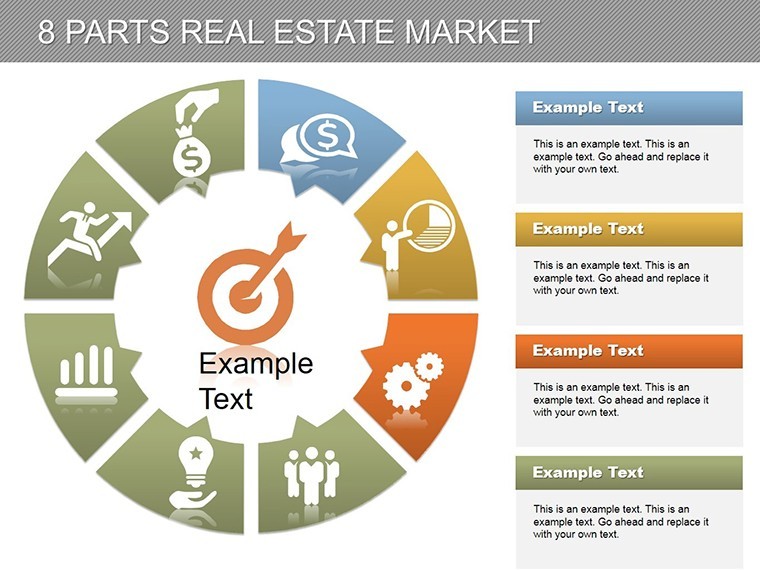
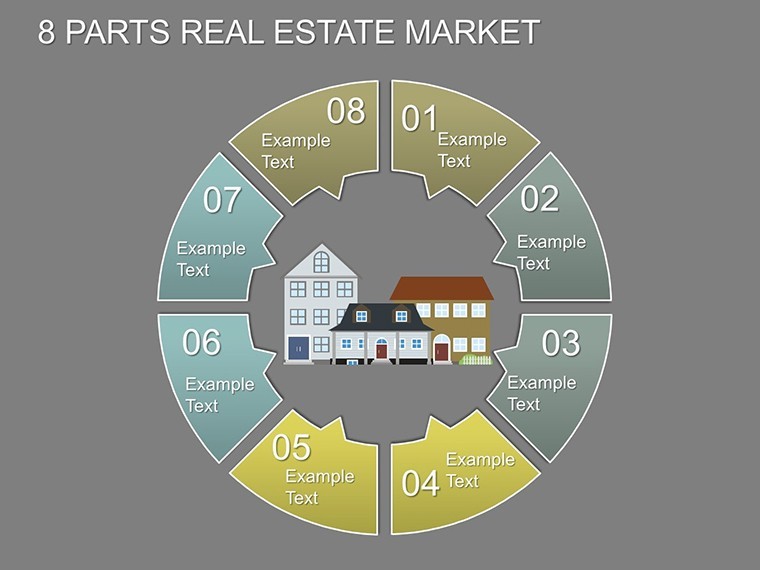
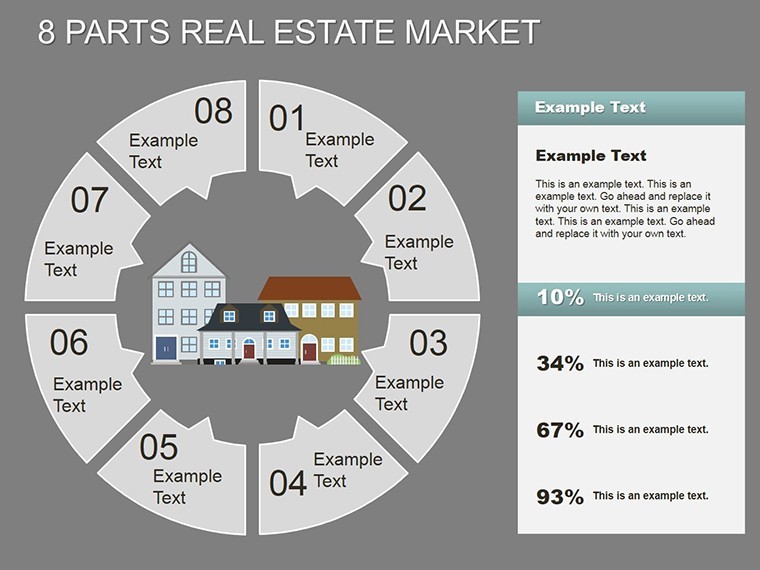
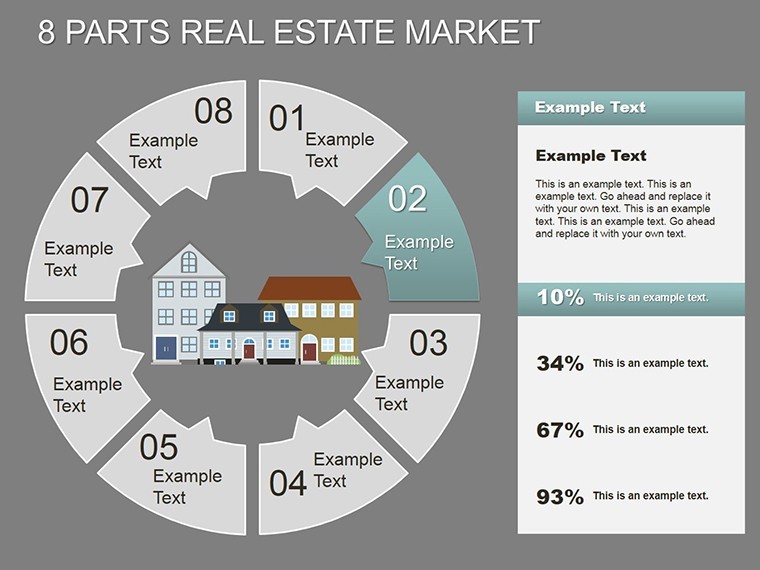
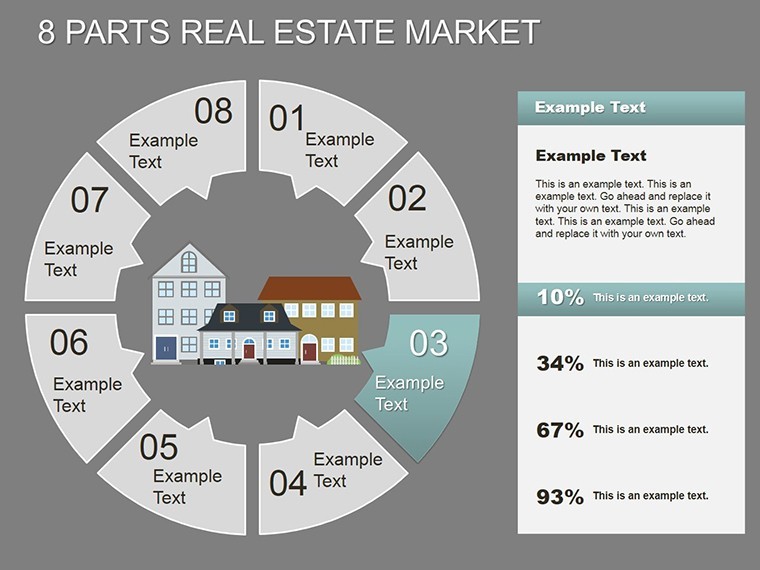
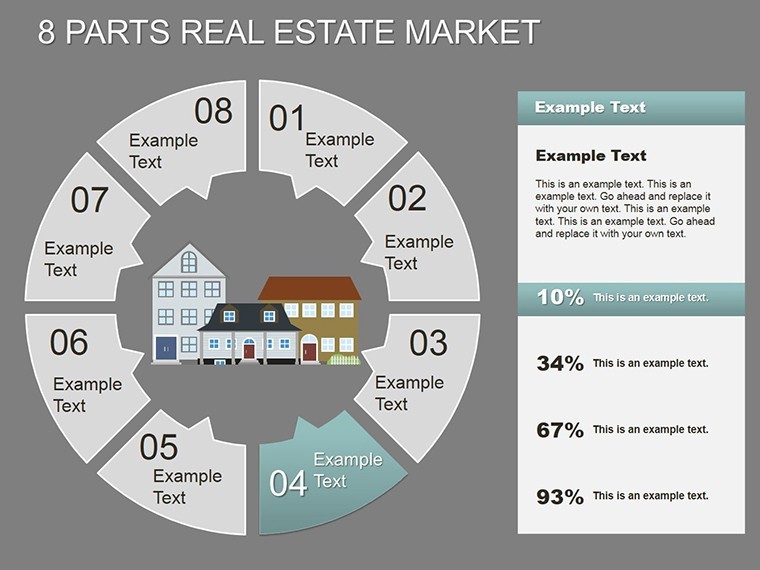
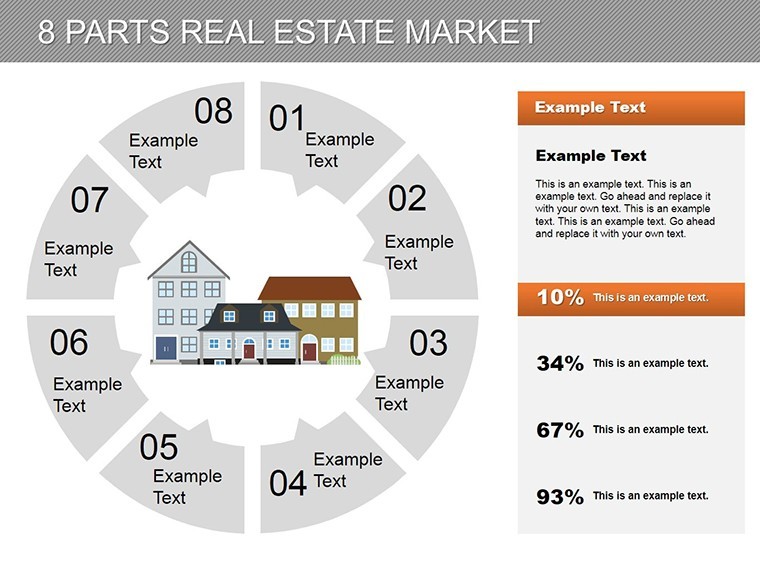
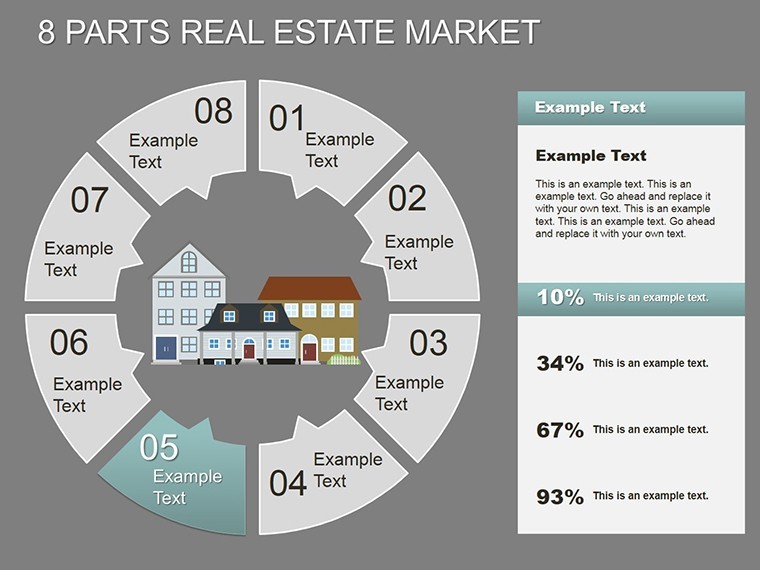
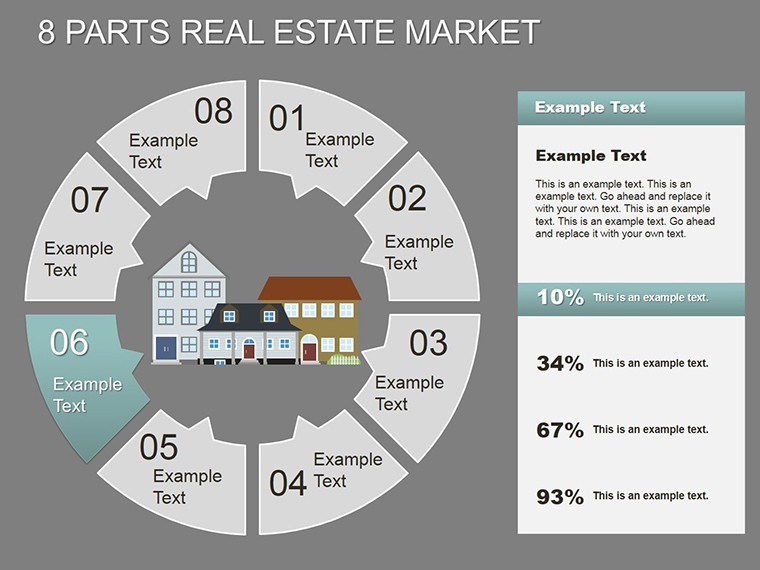
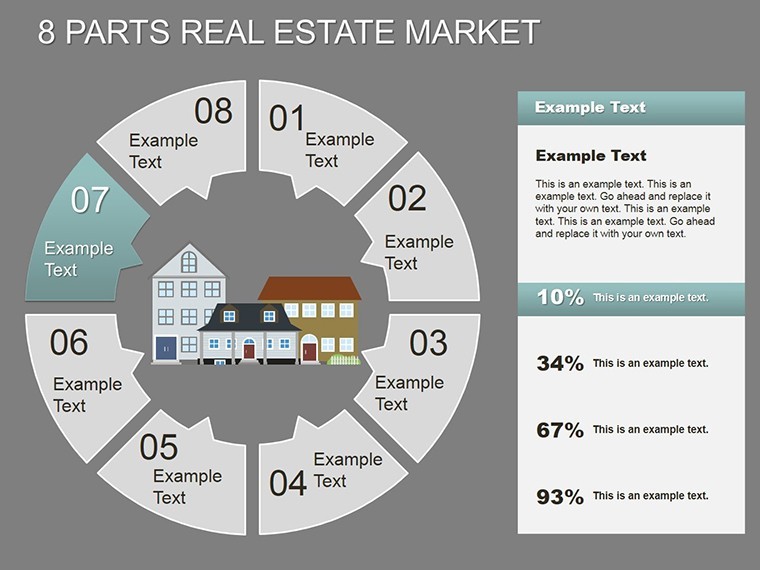
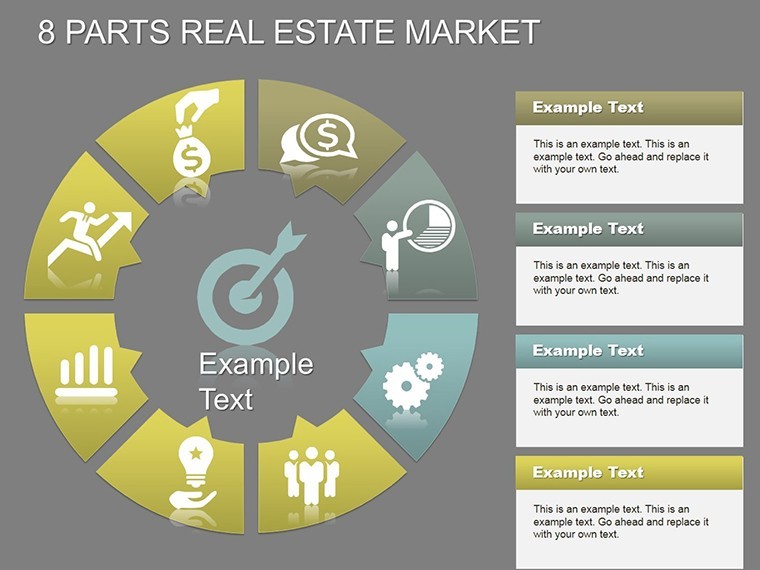
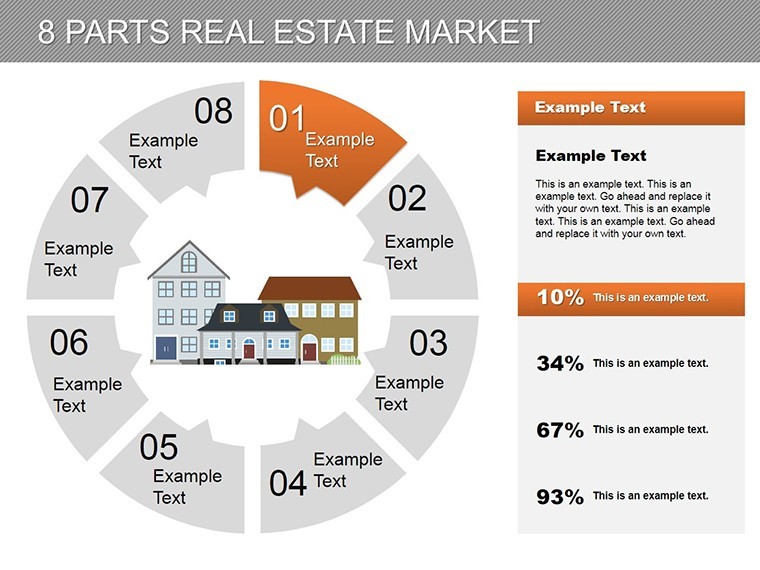
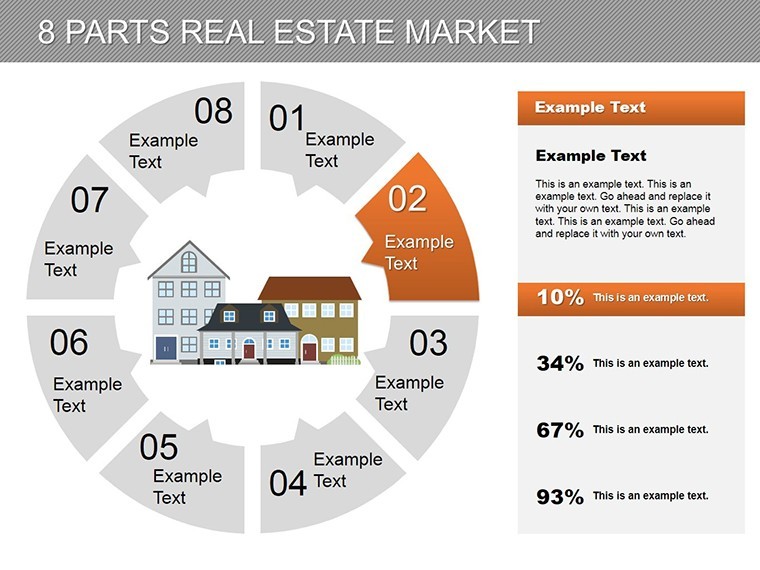
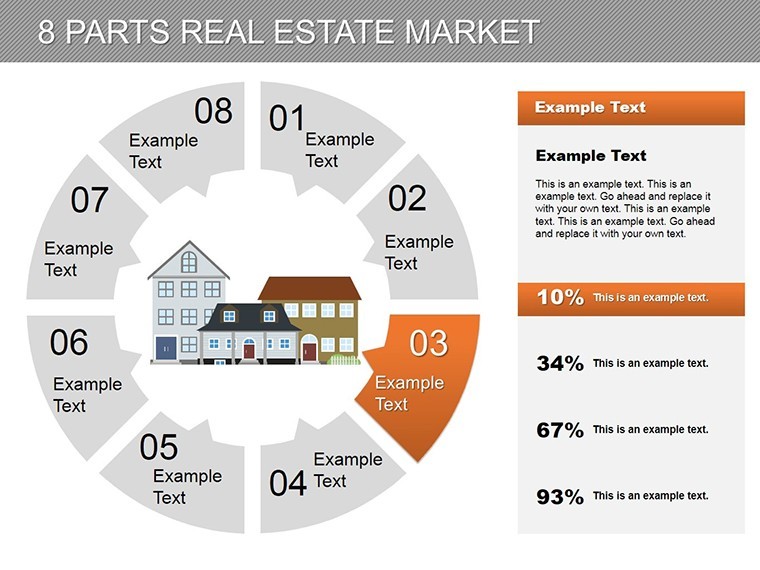
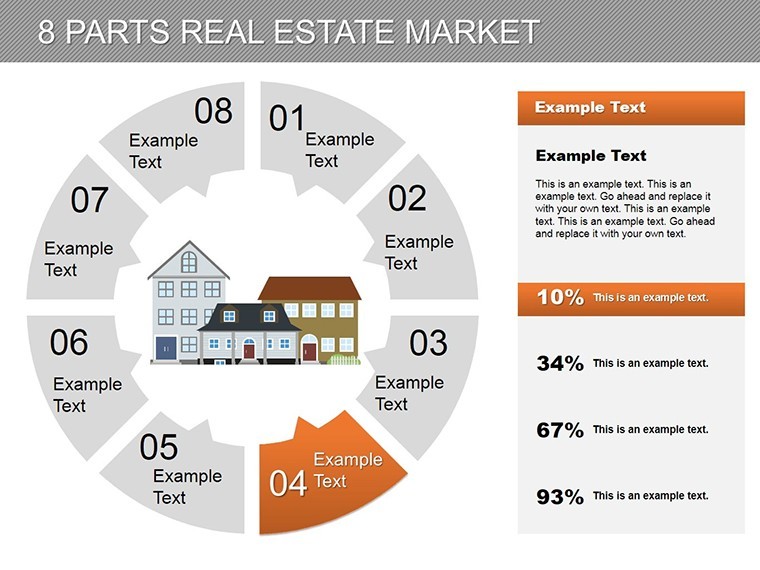
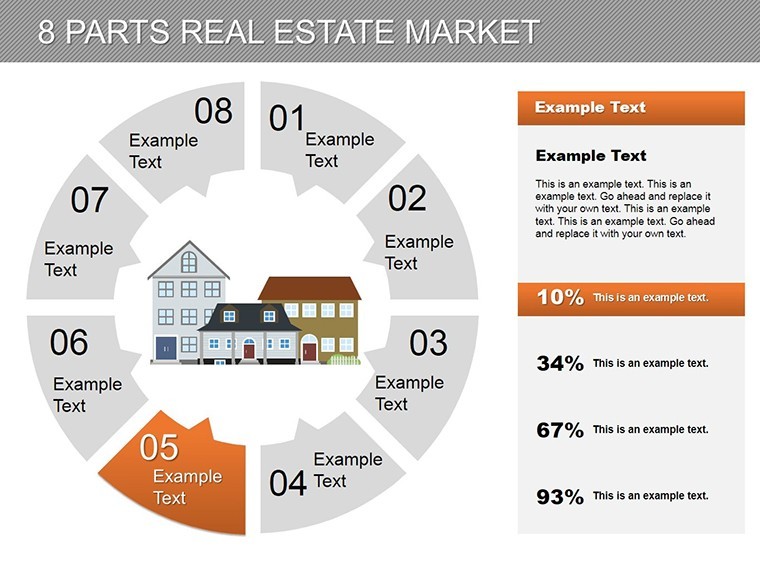
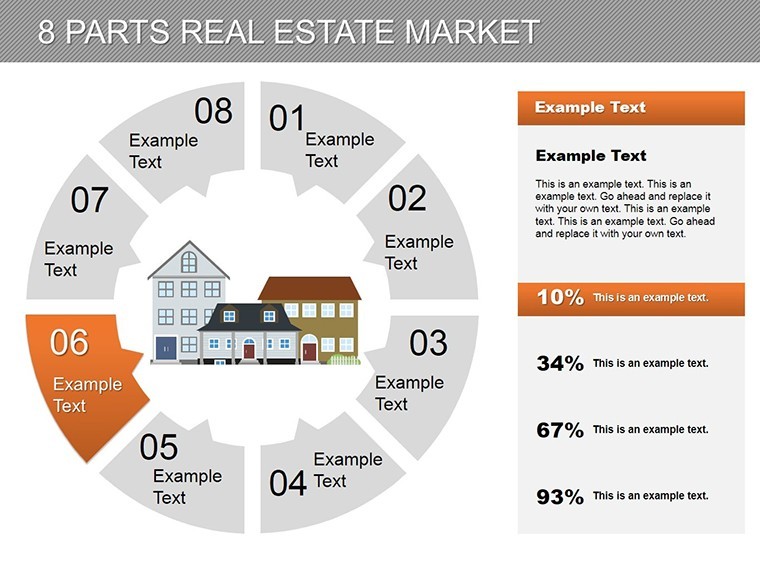
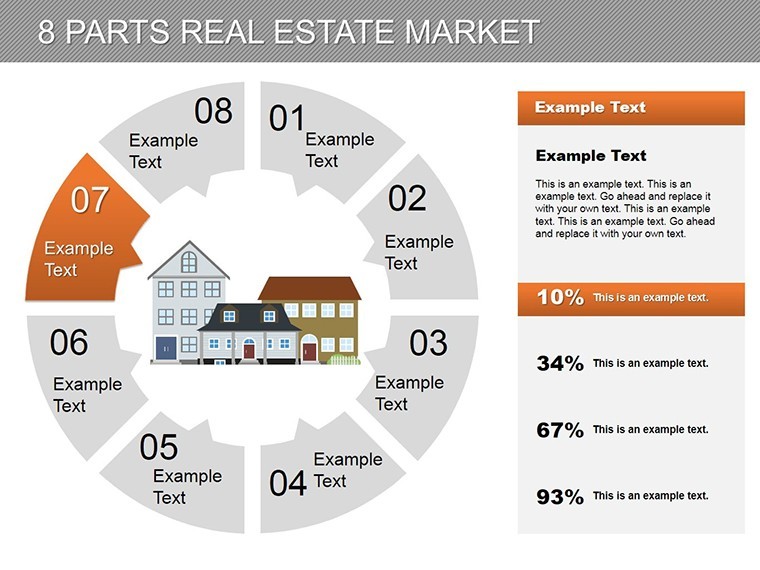
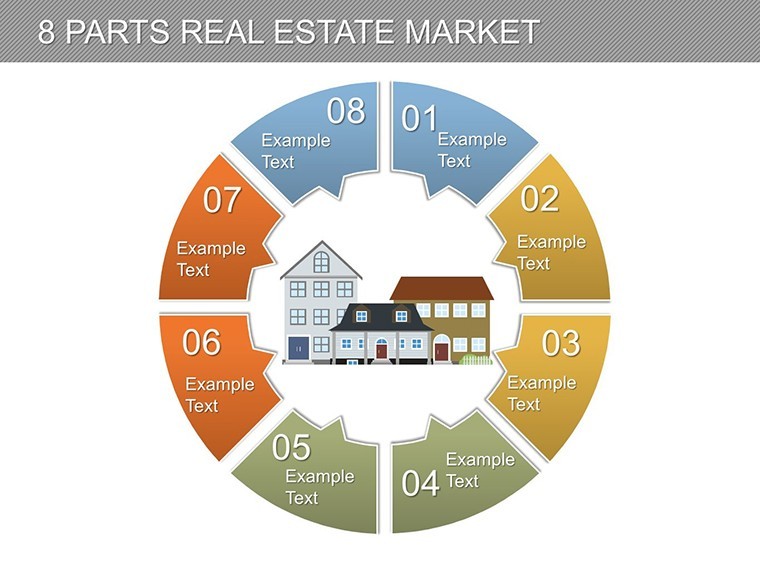
The template's core revolves around an 8-part pie structure, representing key influencers like supply-demand ratios, interest rates, and demographic shifts. Slide 4's exploded pie view allows highlighting high-growth areas, such as residential booms in suburban markets. Drawing from NAR (National Association of Realtors) reports, these designs help forecast trends accurately, aiding in property valuation discussions.
For investors, slide 19's multi-part comparison charts juxtapose commercial vs. residential segments, customizable with current data for ROI calculations. A brokerage firm used this to visualize portfolio diversification, enhancing client trust and accelerating sales cycles.
Essential Features for Real Estate Pros
- Segmented Pie Mastery: Eight core parts with sub-divisions; edit percentages and labels for instant updates.
- Trend Animation: Slides animate growth arcs, simulating market expansion over time.
- Varied Analytics: 27 slides including pies (1-10), bar forecasts (11-18), and radial maps (19-27).
- Professional Palettes: Neutral tones with accents for urgency - adapt to regional market vibes.
- Data Integration: Link to MLS databases or Excel for live metrics; placeholders for photos of properties.
Customization starts with selecting a slide, inputting Zillow-sourced data, and applying Keynote's magic move for smooth transitions. This has streamlined quarterly reports for agencies, cutting design time while amplifying insights.
Targeted Applications in Real Estate
Agents can leverage slide 12 for buyer seminars, breaking down affordability factors into digestible parts. Planners use interconnected pies on slide 24 to model urban development impacts, aligning with AIA sustainability guidelines.
Envision a market forecast presentation: The template's 8-part overview on slide 1 sets the stage, followed by detailed breakdowns that predict appreciation rates, impressing lenders with data-backed narratives. Superior to generic charts, these include real estate-specific icons like home symbols and graph overlays.
Step-by-Step Market Visualization
- Load Data: Import CSV files into pie charts; auto-adjust segments proportionally.
- Customize Segments: Rename parts (e.g., "Luxury Condos") and add tooltips for depth.
- Incorporate Visuals: Embed neighborhood maps or trend lines - slide 15 supports overlays.
- Animate Projections: Sequence reveals for future scenarios, building persuasive momentum.
- Distribute Insights: Export to interactive PDF for client sharing, retaining hyperlinks.
For advanced users, combine parts into dashboards, tracking metrics like vacancy rates over quarters.
Superiority in a Competitive Field
Unlike basic Excel exports, this template's Keynote-native features ensure fluid animations and high-res outputs, vital for virtual tours. Compatible across tools, it supports remote collaborations seamlessly.
As real estate evolves with tech like VR, visuals like these - rooted in industry standards - keep you relevant. Acquire the 8 Parts Real Estate Market Keynote Charts Template immediately to chart your path to market dominance.
Frequently Asked Questions
Is it suitable for commercial real estate?
Yes, adaptable for office, retail, or industrial segments with custom labeling.
How editable are the pie charts?
Fully - change values, colors, and explode effects via simple drag-and-drop.
Does it include forecast tools?
Built-in trend lines and projections; integrate with external data for accuracy.
Compatible with Windows PowerPoint?
Yes, export preserves structure; test animations for optimal performance.
Can I add property images?
Absolutely - slides have frames designed for high-res photos or listings.
Good for
- Project roadmaps and sprint plans
- Product launch timelines
- Quarterly or annual review decks
- Company history and milestone summaries
Licence
reviews
Needed charts for a startup pitch and this saved me from making everything from scratch.
The icons were simple but matched the slides pretty well.
I think a couple layouts had too much empty space but not a huge issue.
Good enough for quick data summaries during meetings.
I used this for a marketing report and the timeline slide was the most useful part.
FAQ
Will it work in Google Slides?
Are fonts embedded?
Can I use this for client work?
What's the refund policy?
Do you update the template after purchase?
Similar templates
See all Keynote Charts →
All 27 slides