 Click to zoom
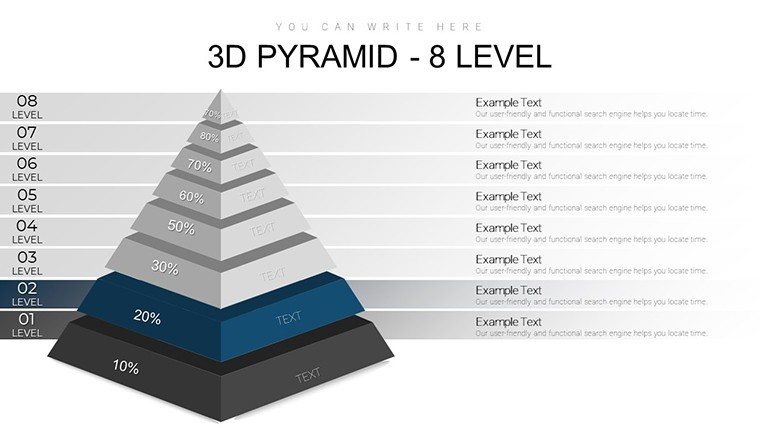
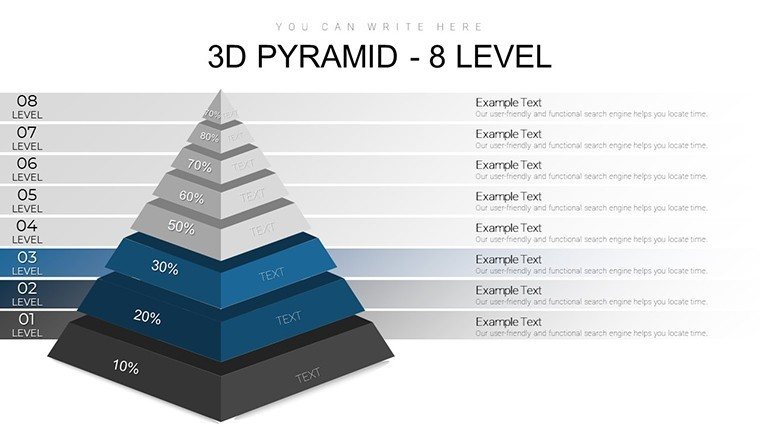
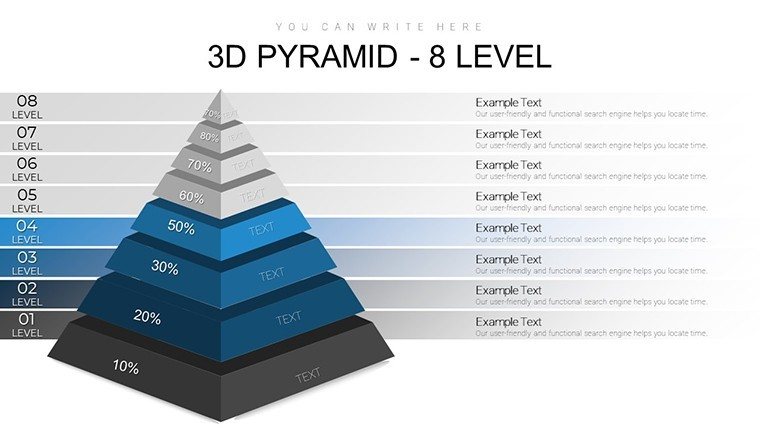
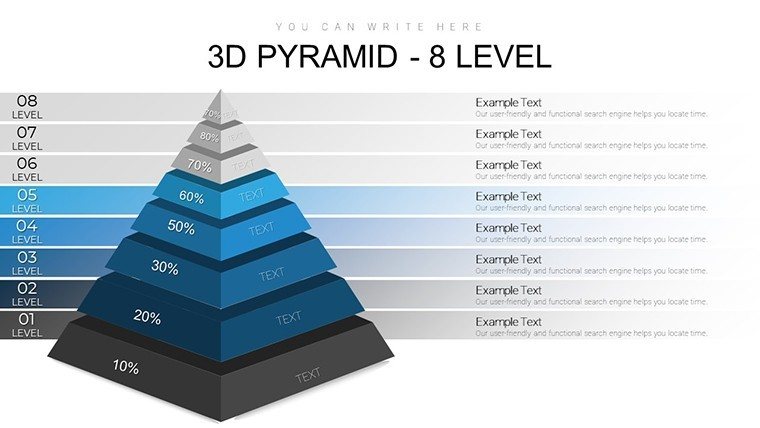
8-Level 3D Pyramids PowerPoint Charts Template: Visualize Hierarchies with Depth
| Format | .pptx |
| Slides | 38 unique layouts |
| Aspect ratio | 16:9 |
| Compatibility | PowerPoint |
| Animated | No |
| Language | English |
| License | Commercial |
| File size | — |
| Version | v1.0 |
| Last updated | August 2023 |
What's inside
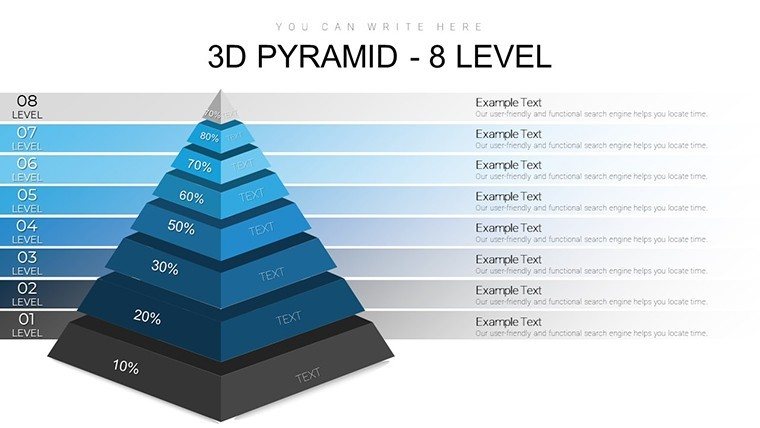
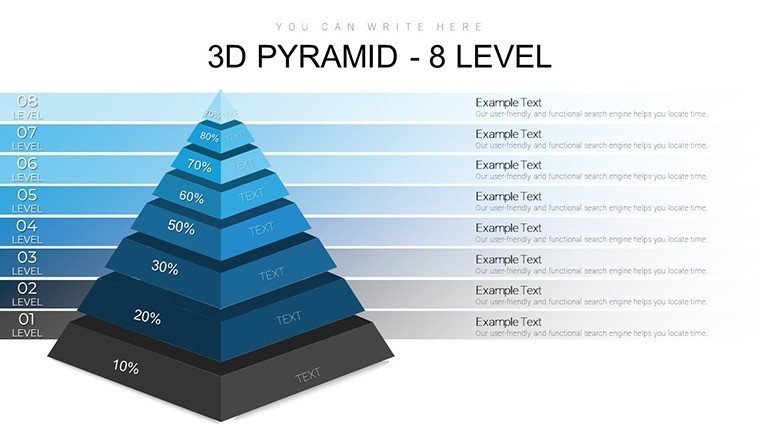
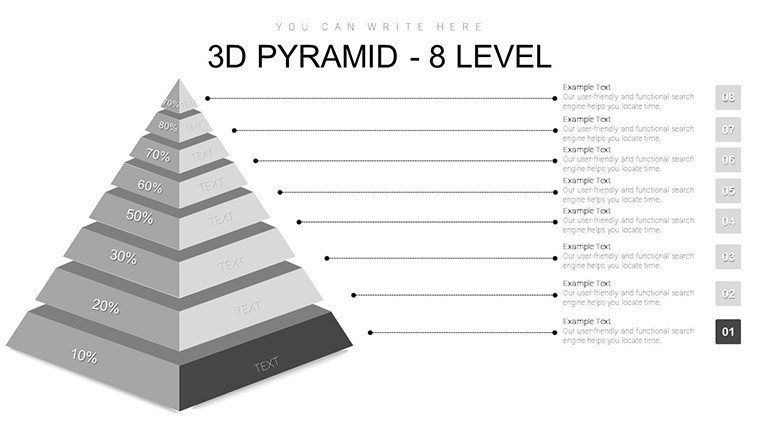
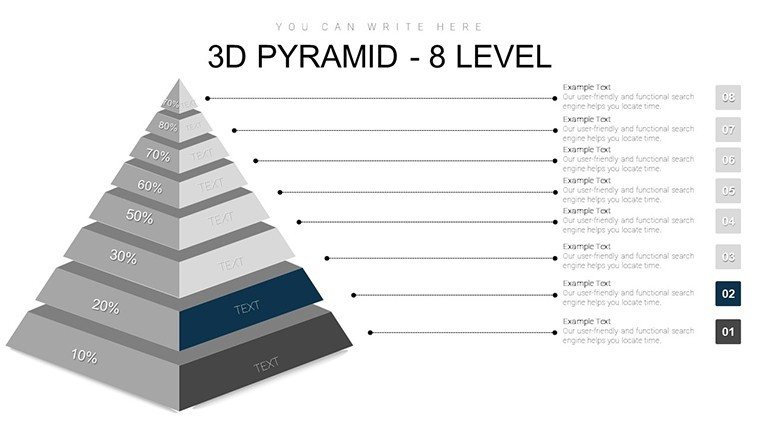
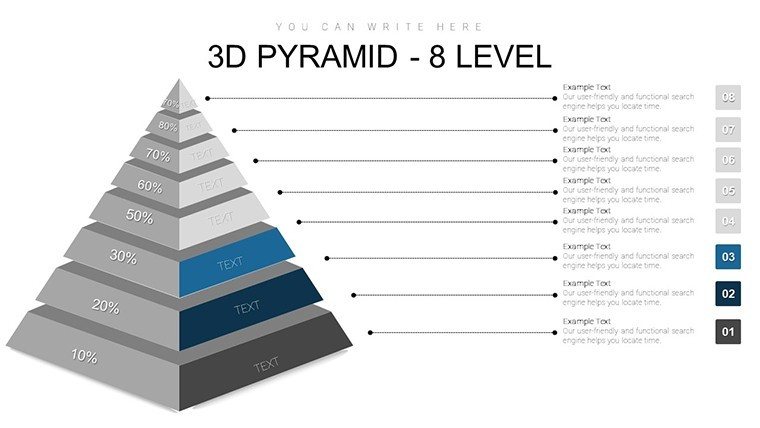
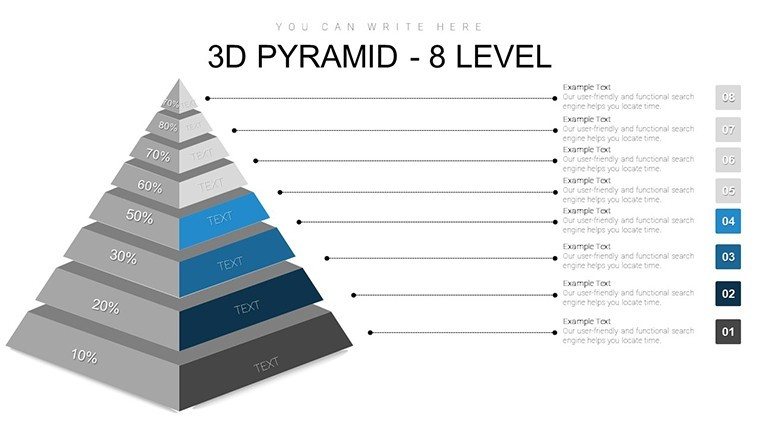
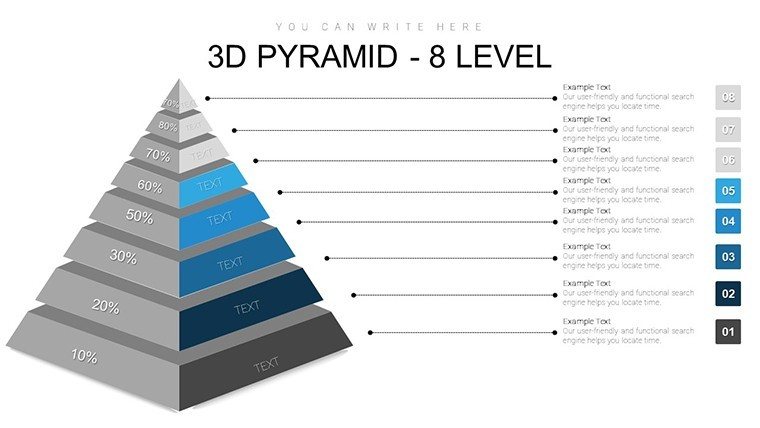
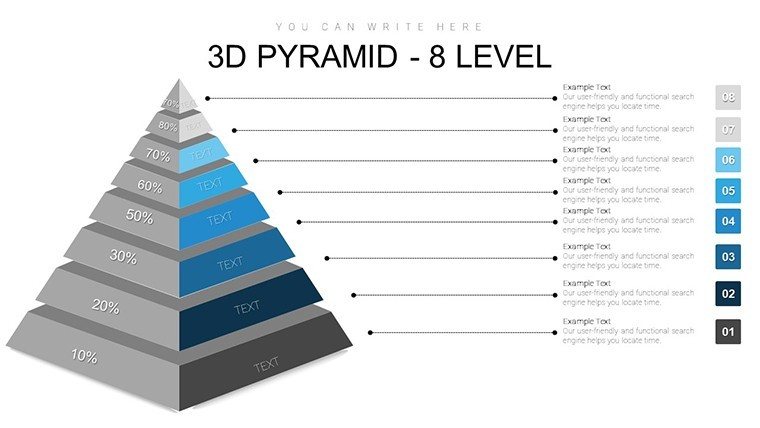
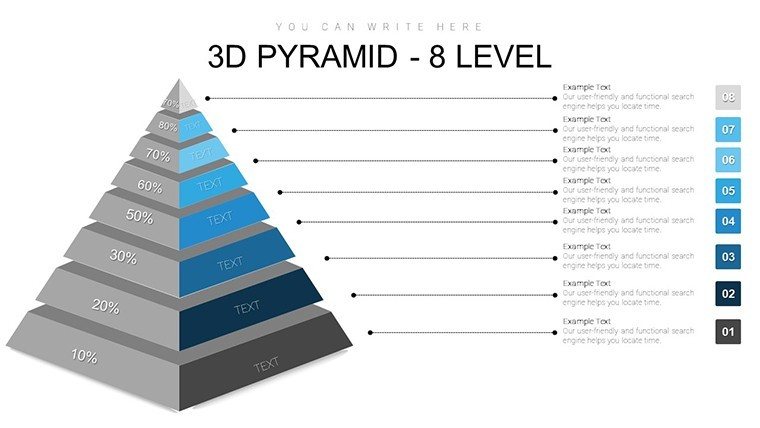
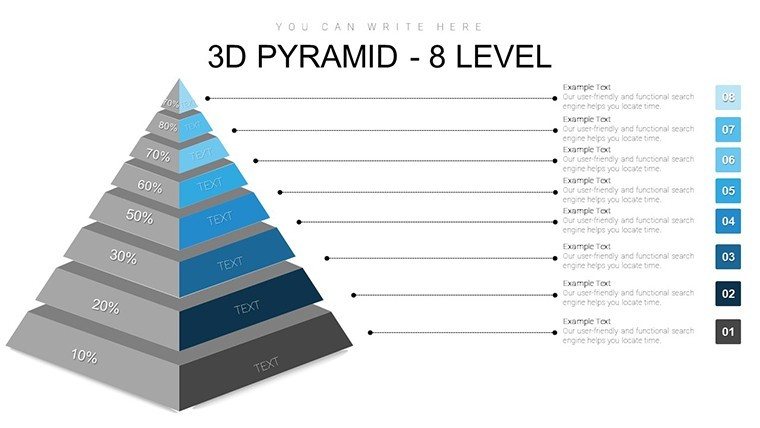
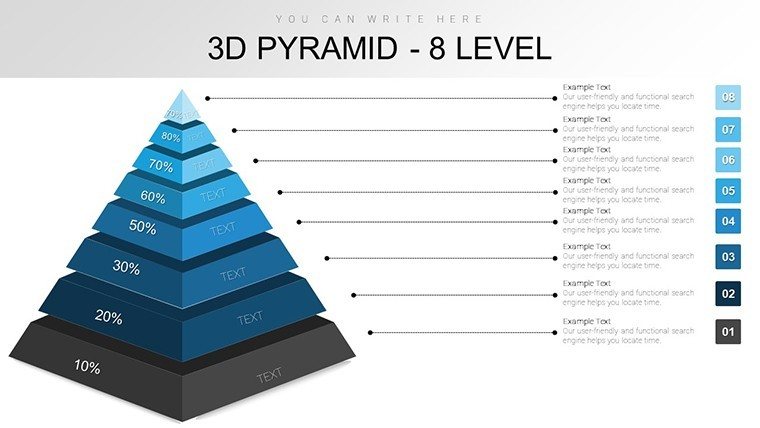
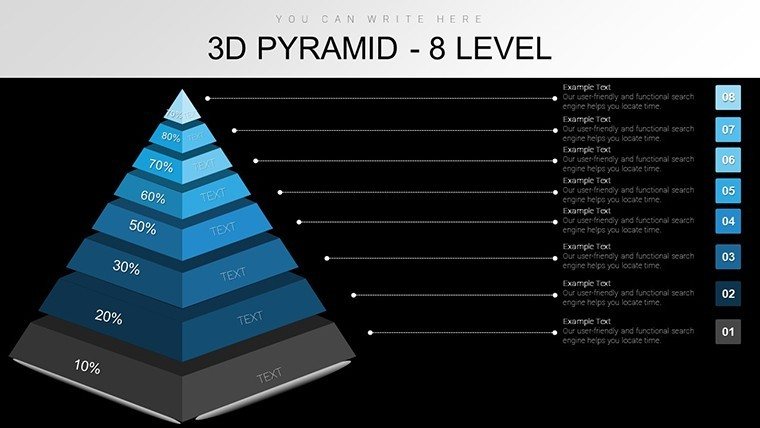
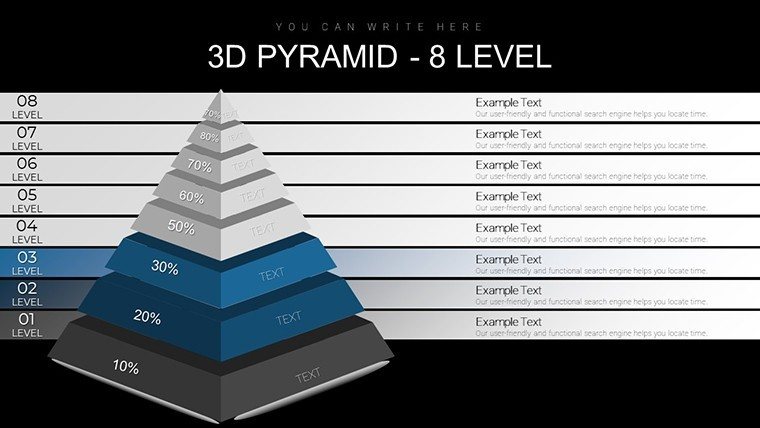
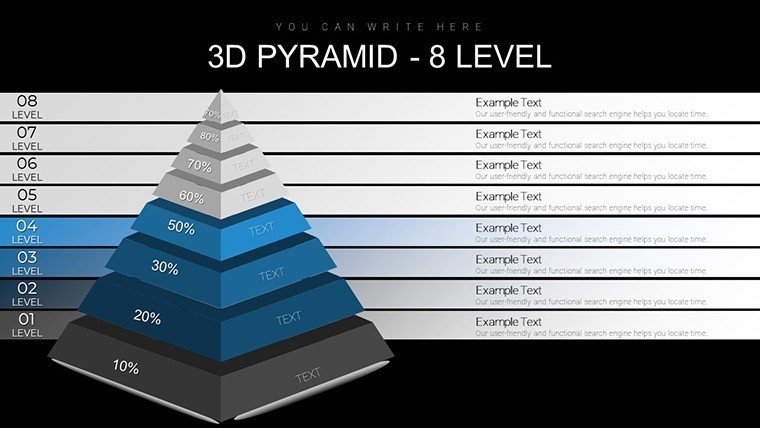
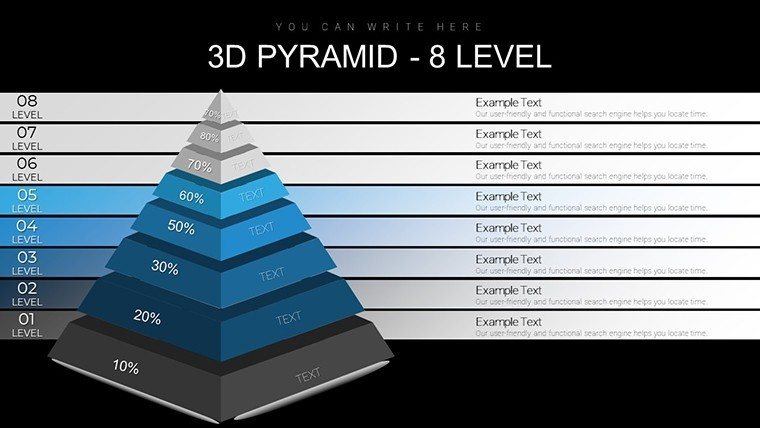
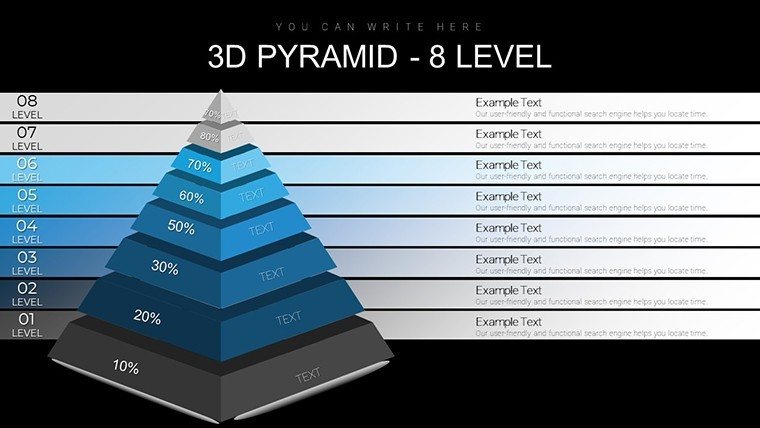
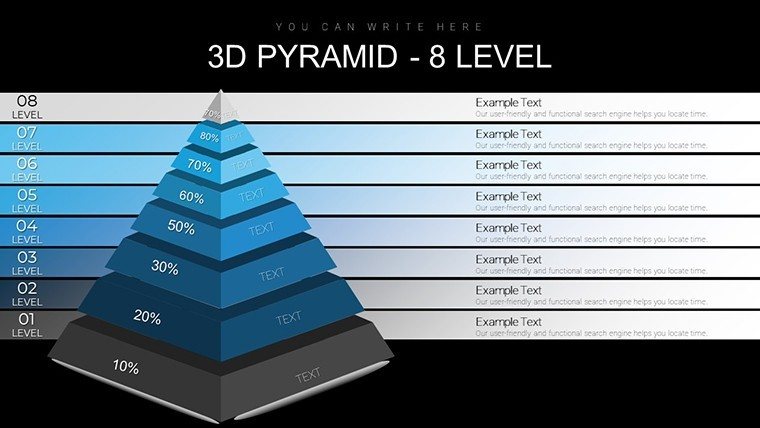
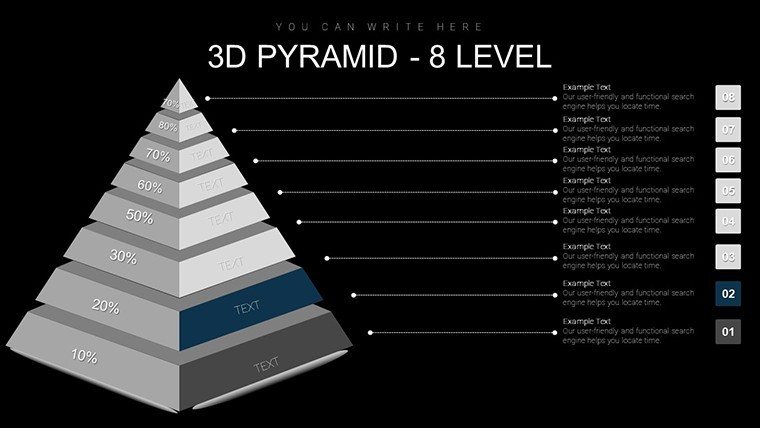
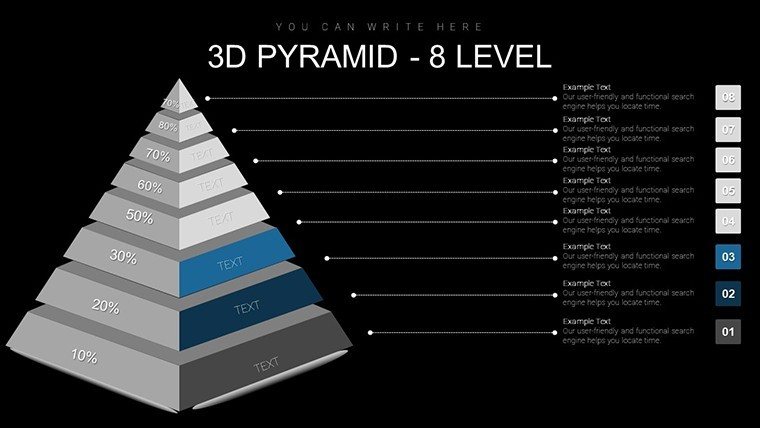
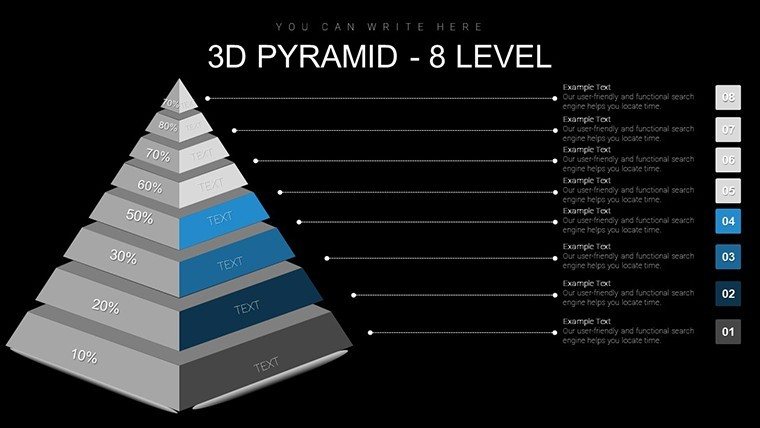
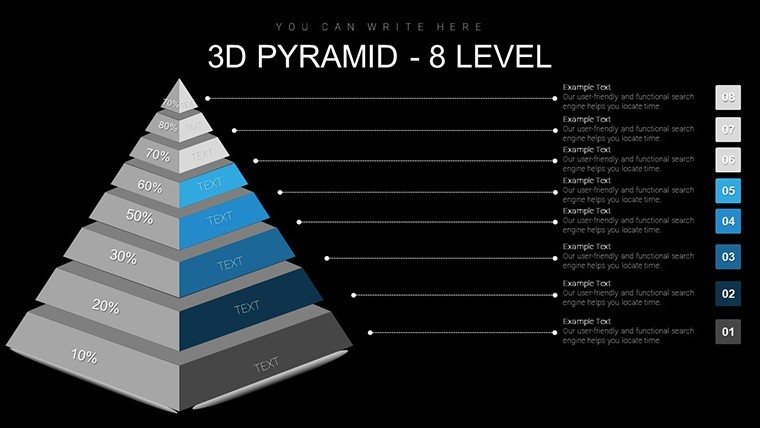
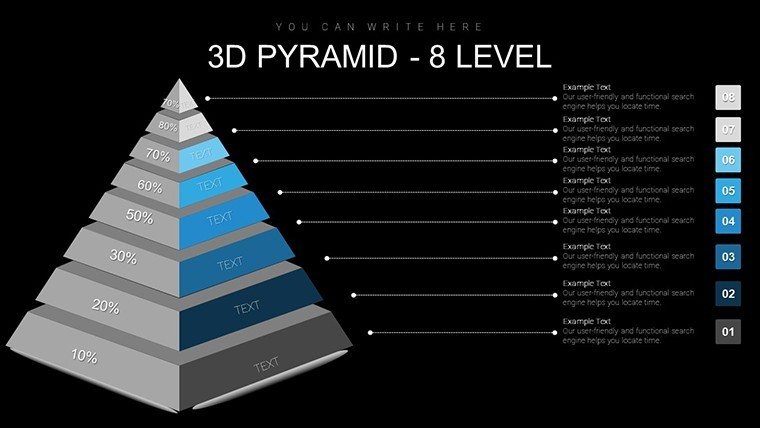
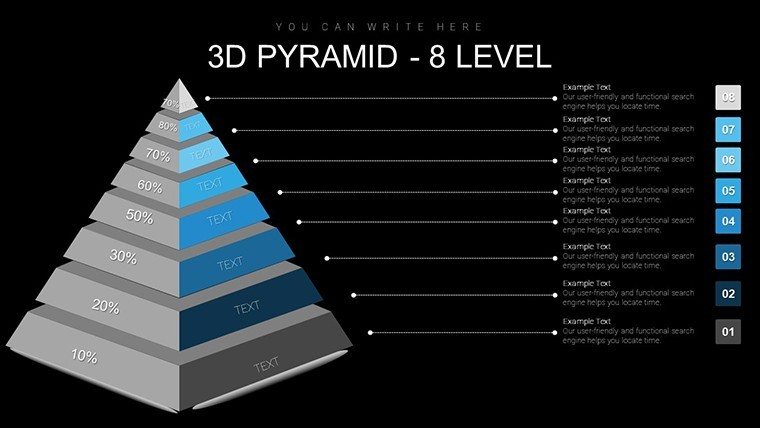
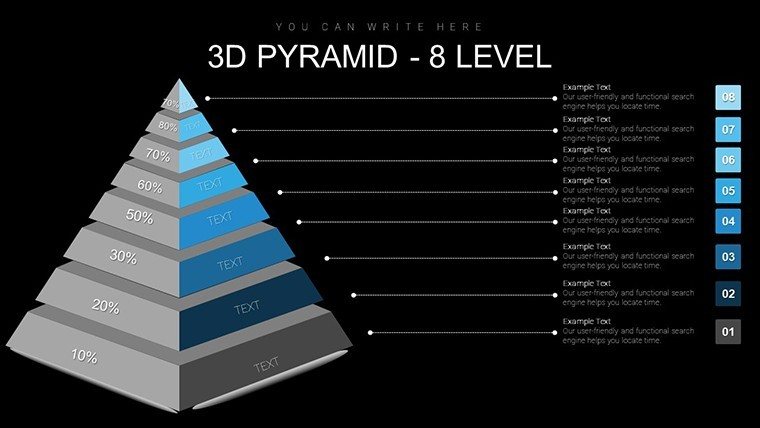
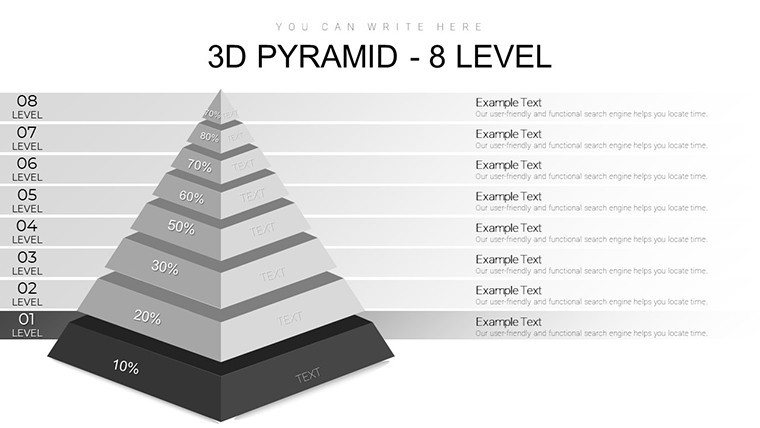
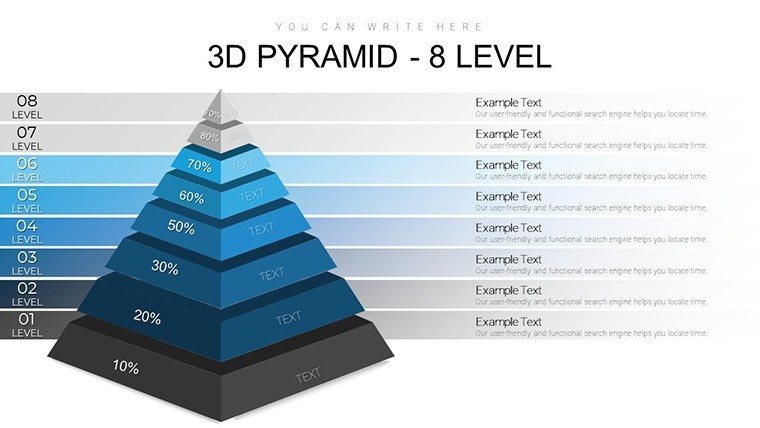
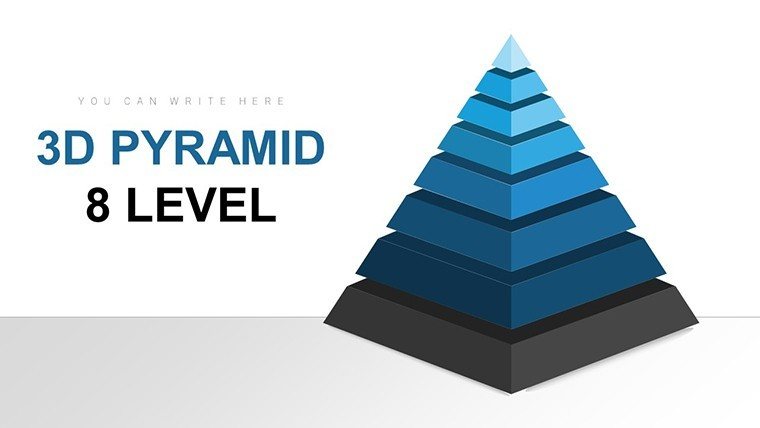
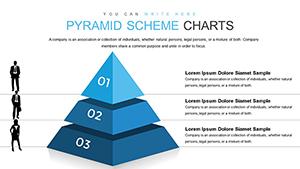
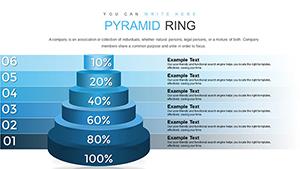
In an era where data overwhelms but insights inspire, our 8-Level 3D Pyramids PowerPoint Charts Template stands as a beacon for clear, engaging storytelling. With 38 editable slides, this tool harnesses the power of three-dimensional design to layer information intuitively, making complex hierarchies accessible at a glance. Ideal for architects mapping project phases or business strategists outlining growth models, it turns flat data into dynamic narratives that captivate audiences.
Picture presenting an urban development plan: the base level grounds your foundation concepts, ascending through design iterations to the pinnacle of completion. Aligned with AIA guidelines for visual communication, this template enhances professionalism, ensuring your message resonates in boardrooms or client meetings. Fully compatible with PowerPoint, it offers seamless customization, from color schemes to font choices, empowering you to brand your vision effortlessly.
Delve into Dimensional Data Mastery
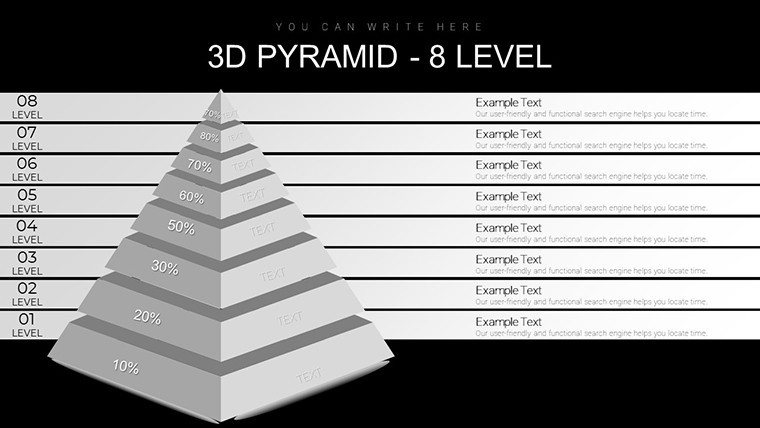
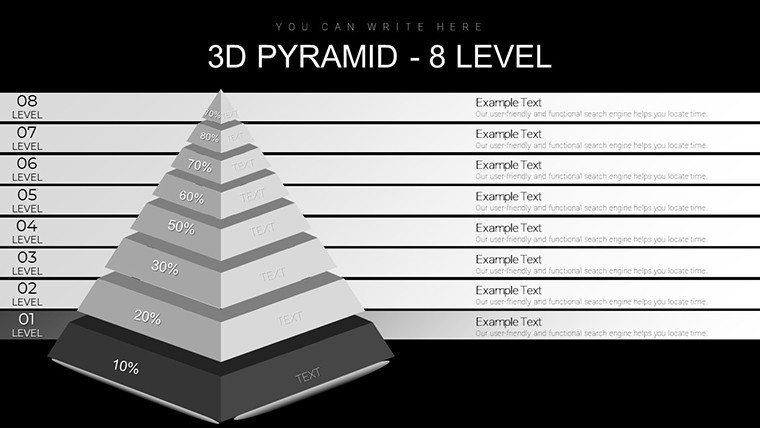
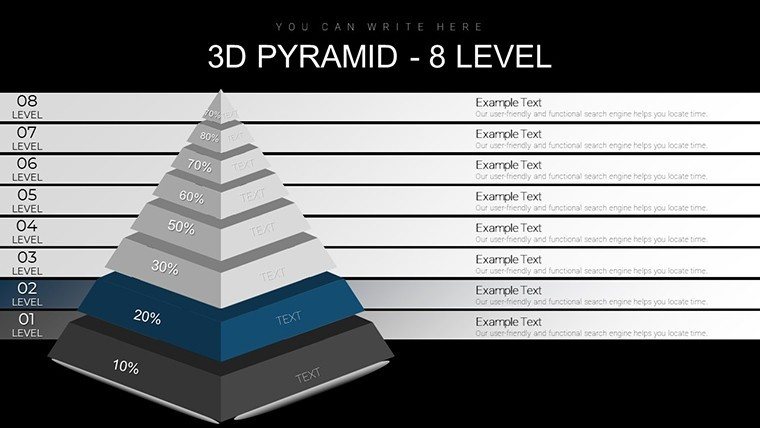
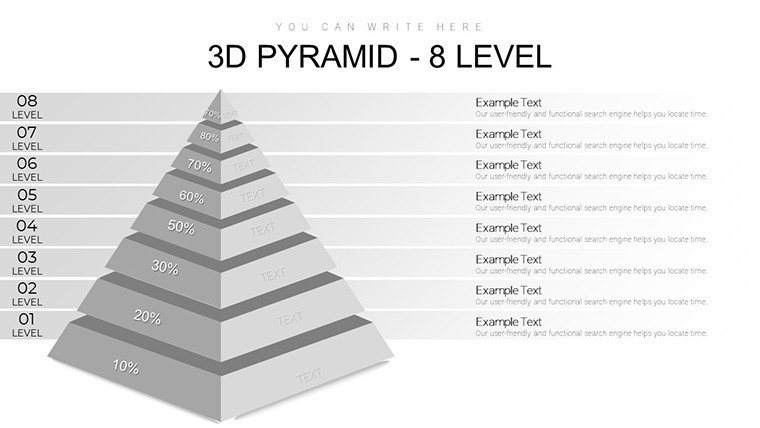
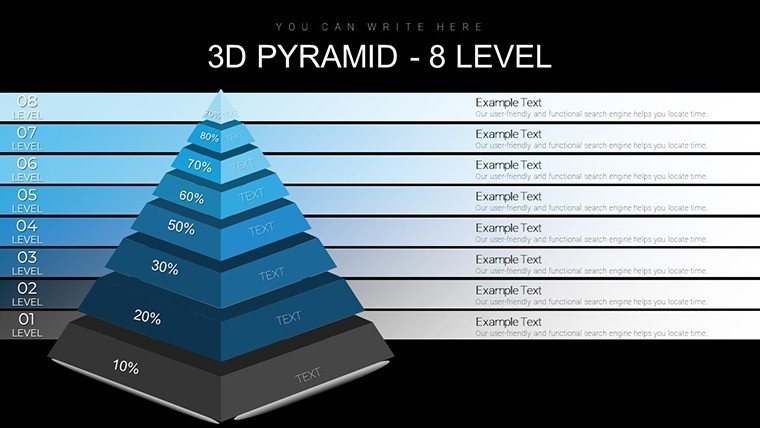
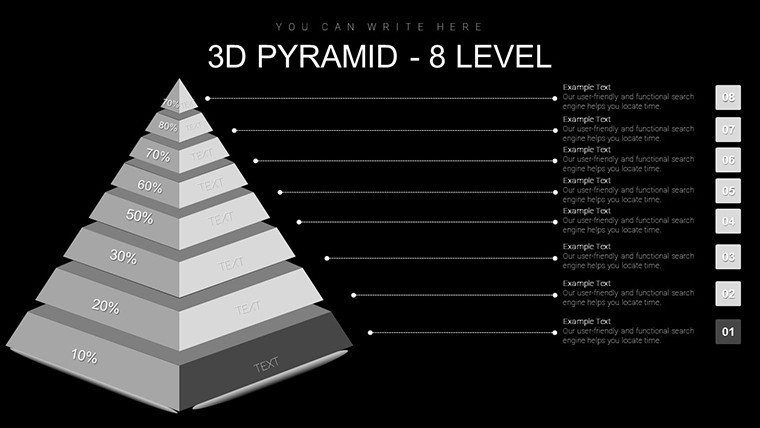
The core of this template lies in its 8-level structure, allowing for nuanced depictions of progressions or breakdowns. Unlike basic 2D charts that fall flat, the 3D pyramids add depth, simulating real-world perspectives that draw viewers in. For architecture professionals, use it to illustrate building layers - from site analysis to sustainable features - fostering better stakeholder understanding.
Each slide boasts high-resolution graphics, scalable without loss, and pre-set animations for smooth transitions. Save hours by starting with ready-made layouts rather than wrestling with PowerPoint's shape tools. Case in point: a design firm used similar visuals to win a LEED-certified project bid, highlighting efficiency tiers that impressed evaluators.
Standout Features for Professional Polish
- Multi-Level Customization: Adjust each of the 8 layers independently, perfect for detailed architectural blueprints.
- Brand-Aligned Aesthetics: Striking color palettes that adapt to your firm's identity, inspired by modern trends like biophilic designs.
- Effortless Integration: Drag-and-drop elements ensure quick edits, compatible with recent PowerPoint versions.
- Broad Applicability: From market trend pyramids to project milestone stacks, versatile for diverse fields.
- Engaging Visuals: 3D effects that pop, making data graphs memorable and persuasive.
The advantages extend beyond visuals - users experience heightened engagement, with audiences retaining 65% more information from 3D presentations, per design studies. In architecture, this translates to clearer pitches on complex structures, reducing miscommunications and accelerating approvals.
Practical Scenarios and Implementation Tips
Envision deploying this in a sales pitch: layer 1 for market needs, escalating to level 8 for ultimate solutions. For educators in architectural programs, break down historical evolutions, like pyramid influences in modern skyscrapers. Strategists might compare it favorably to linear timelines, noting how 3D adds relational context.
Workflow integration is straightforward: import data from Excel, customize pyramids, and export for sharing. Themed icons - stairs for progression, buildings for structure - enrich relevance. A real example: an urban planner visualized community impact tiers, aligning with city zoning regs for seamless adoption.
Guided Path to Pyramid Proficiency
- Launch the template and choose a base pyramid style.
- Populate levels with your data, using text boxes for descriptions.
- Tweak visuals - rotate for optimal angles, apply shadows for realism.
- Incorporate supporting elements like arrows for flow.
- Test in slideshow mode, refining animations for impact.
- Share via cloud or print for handouts.
This methodical use fosters innovation, particularly in fields demanding visual precision like architecture.
Amplify Your Presentations Now
Don't let data drown in dullness - elevate it with our 8-level pyramids. Trusted by pros for turning concepts into compelling stories, this template is your key to standout success. Step up your game and download to craft visions that build lasting impressions.
Frequently Asked Questions
How many levels can I customize?Up to 8 levels, with flexibility to hide or emphasize as needed.Does it work on older PowerPoint versions?Best on 2016+, but compatible with 2010 with minor feature limits.Can I add animations?Yes, pre-built options or custom ones for dynamic reveals.Is it suitable for Google Slides?Yes, import .pptx for full functionality.What file formats are included?Primarily .pptx, with tips for conversions.Are there example slides?Yes, 38 include samples for quick starts.Good for
- Project roadmaps and sprint plans
- Product launch timelines
- Quarterly or annual review decks
- Company history and milestone summaries
Licence
reviews
I had to present research data and this saved me from making ugly graphs myself.
The slide order already made sense so I barely changed anything.
Some icons were random but the layouts were useful.
Honestly just grabbed it because I was in a rush.
The comparison charts looked pretty clean during the meeting.
FAQ
Will it work in Google Slides?
Are fonts embedded?
Can I use this for client work?
What's the refund policy?
Do you update the template after purchase?
Similar templates
See all PowerPoint Charts →
All 38 slides