 Click to zoom
6 Stage Cyclic Volume Keynote Charts Template: Cycle Through Success
| Format | .pptx |
| Slides | 19 unique layouts |
| Aspect ratio | 16:9 |
| Compatibility | PowerPoint |
| Animated | No |
| Language | English |
| License | Commercial |
| File size | — |
| Version | v1.0 |
| Last updated | September 2023 |
What's inside
Processes aren't linear - they loop, evolve, and repeat. The 6 Stage Cyclic Volume Keynote Charts Template captures this dynamism with 19 editable slides featuring circular arrow graphs, ideal for project managers, strategists, and educators illustrating step-by-step principles. This Keynote-native tool turns abstract cycles into vivid, color-customizable visuals that drive understanding and action.
Built for scenarios like workflow optimizations or strategic planning, it emphasizes volume and flow through six distinct stages. Inspired by cyclic models in operations research (e.g., PDCA cycles), it provides a structured yet flexible canvas. Say goodbye to disjointed diagrams; here, arrows connect seamlessly, with volume indicators to show scale - making your presentations more persuasive and professional.
Embrace the Rhythm of Cyclic Design
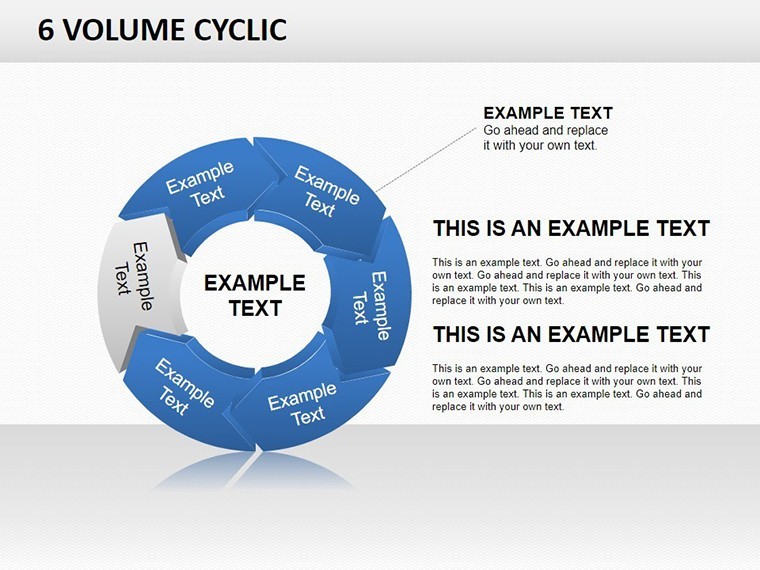
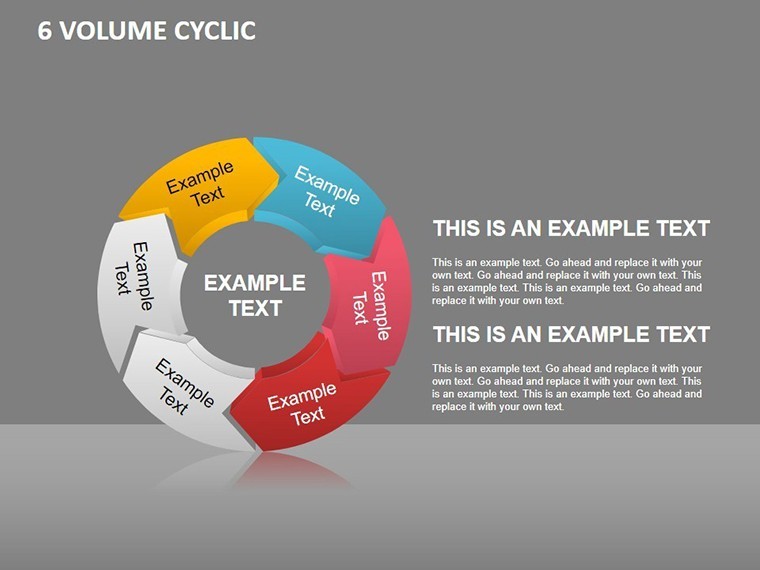
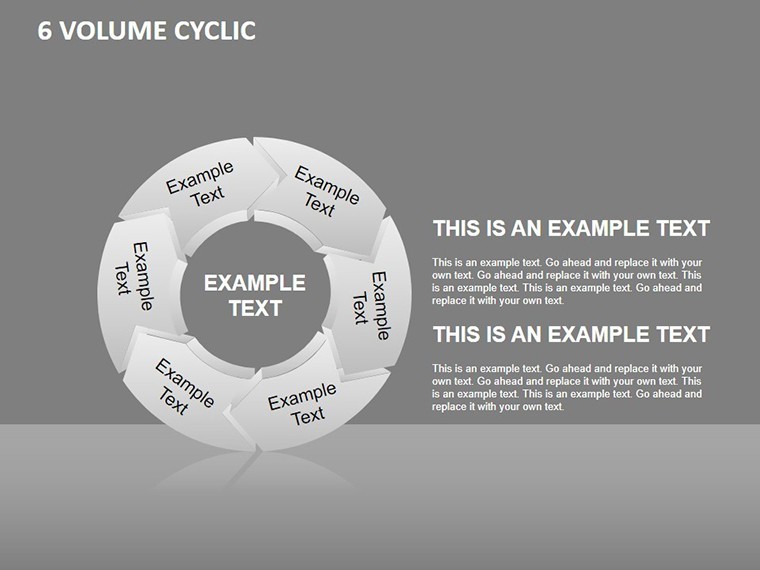
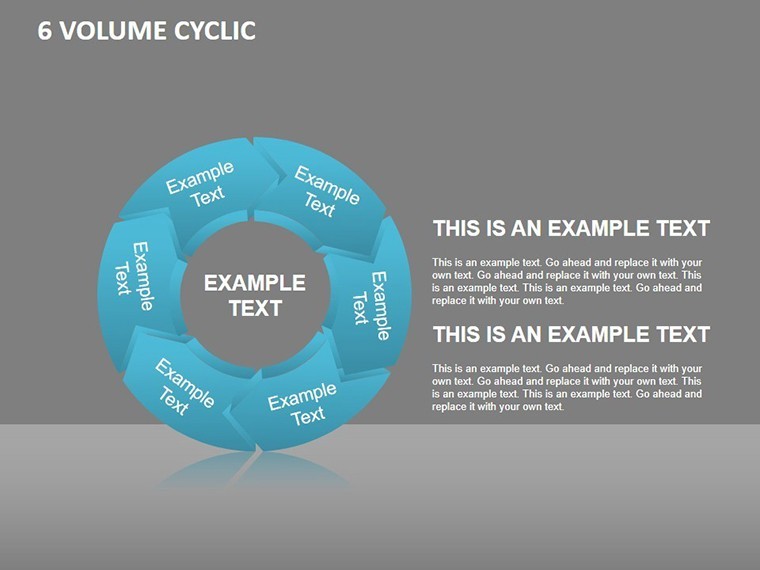
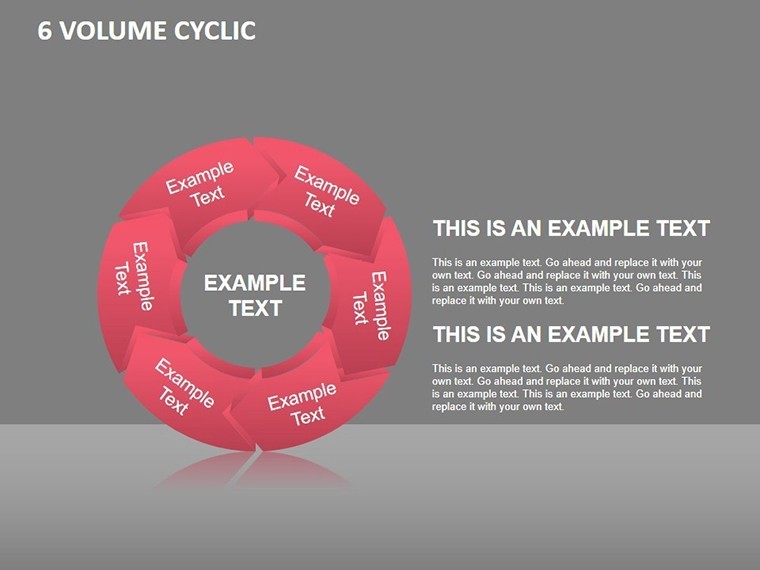
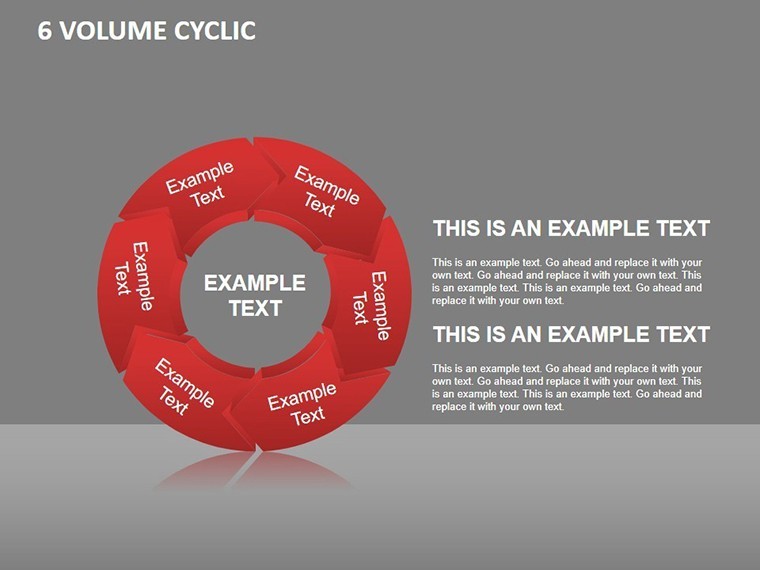
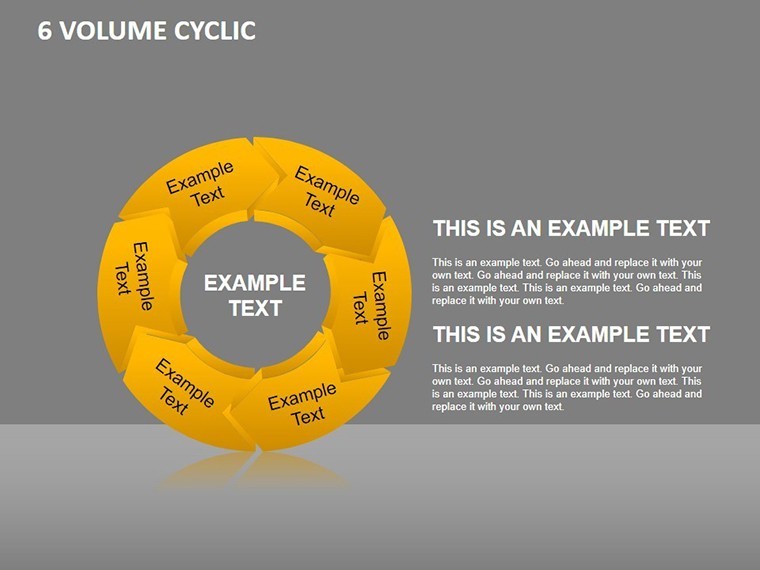
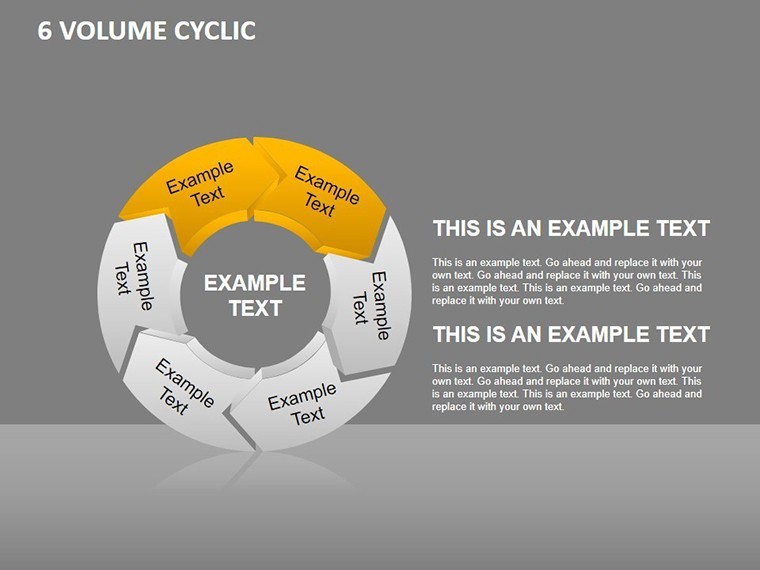
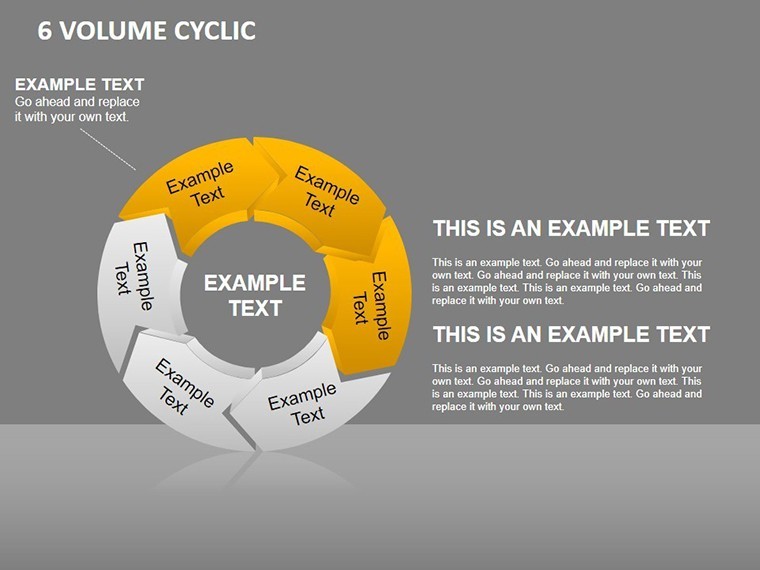
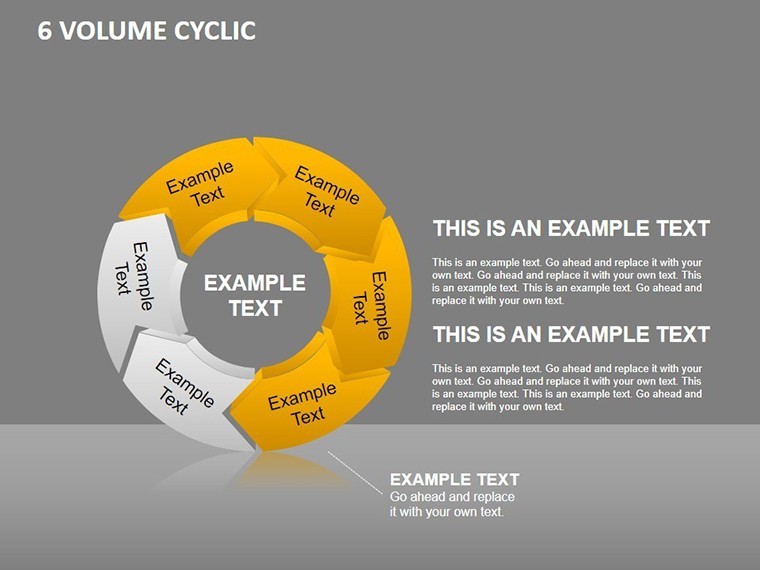
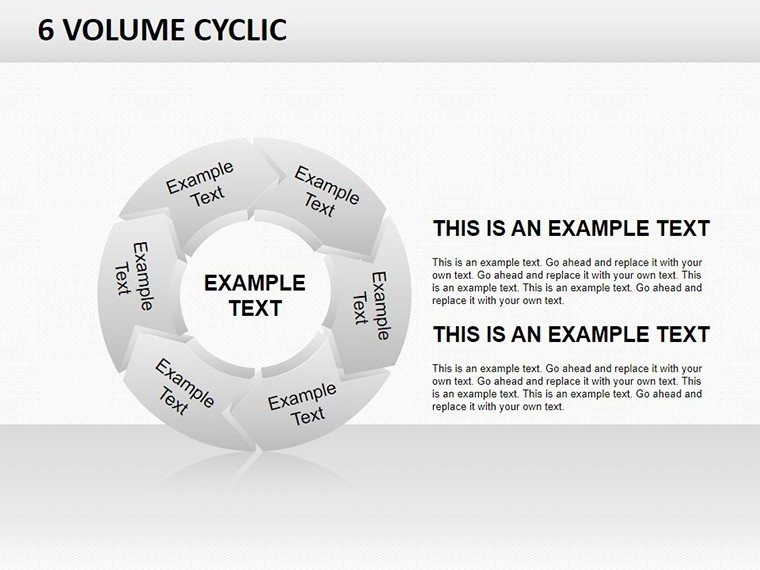
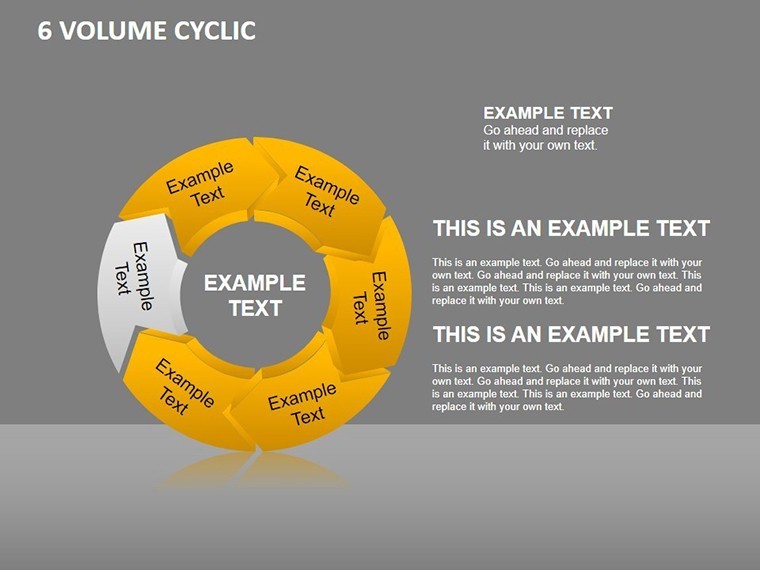
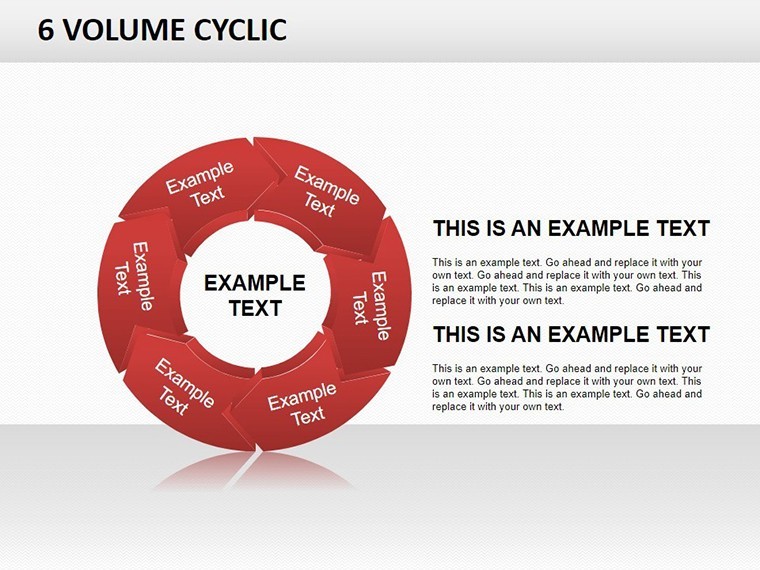
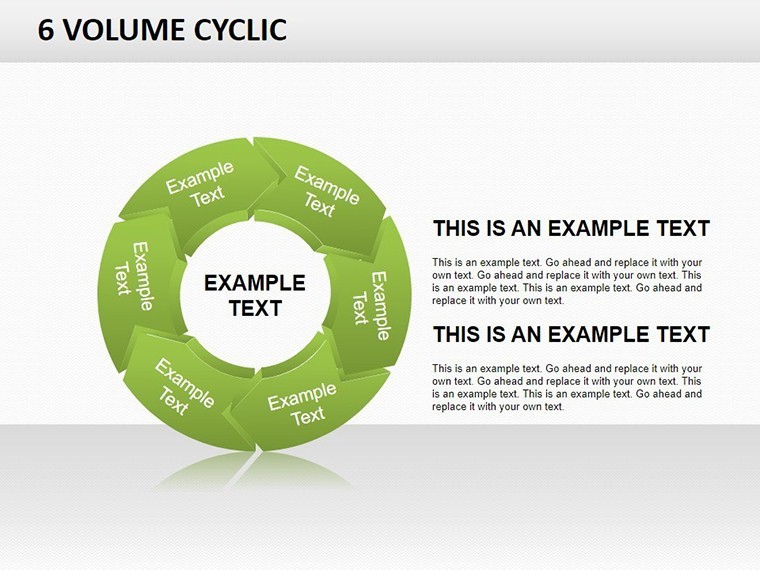
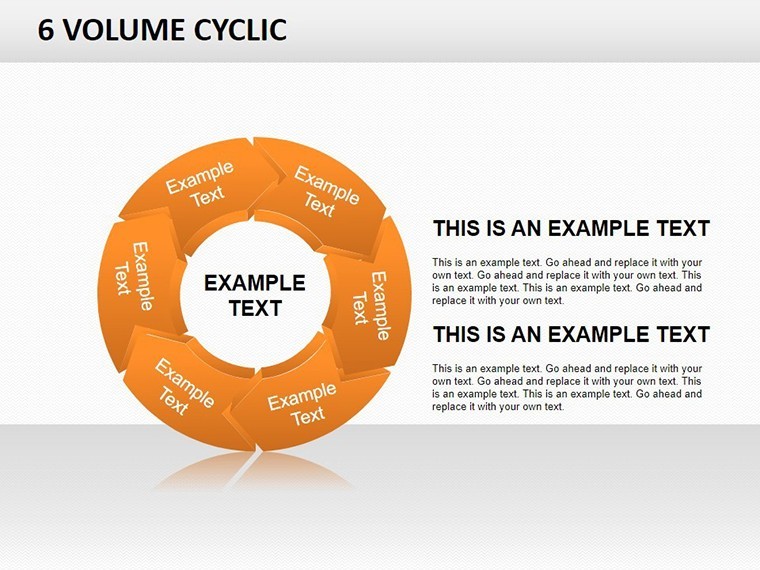
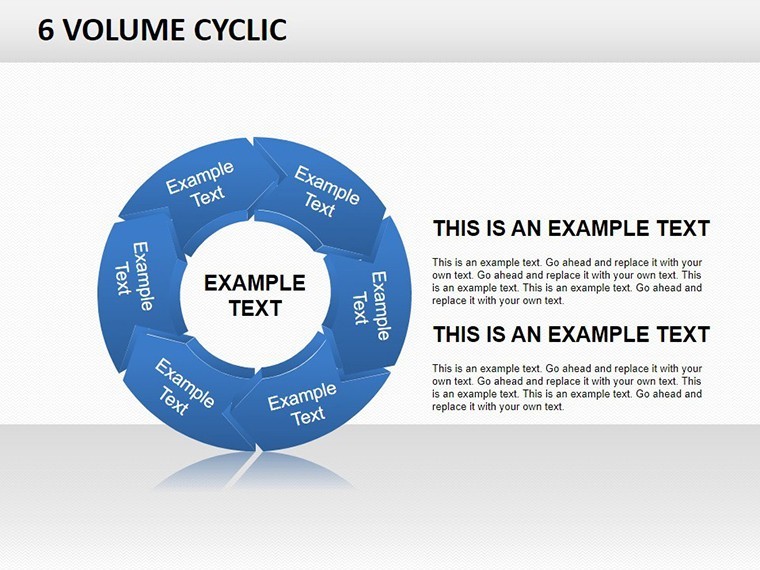
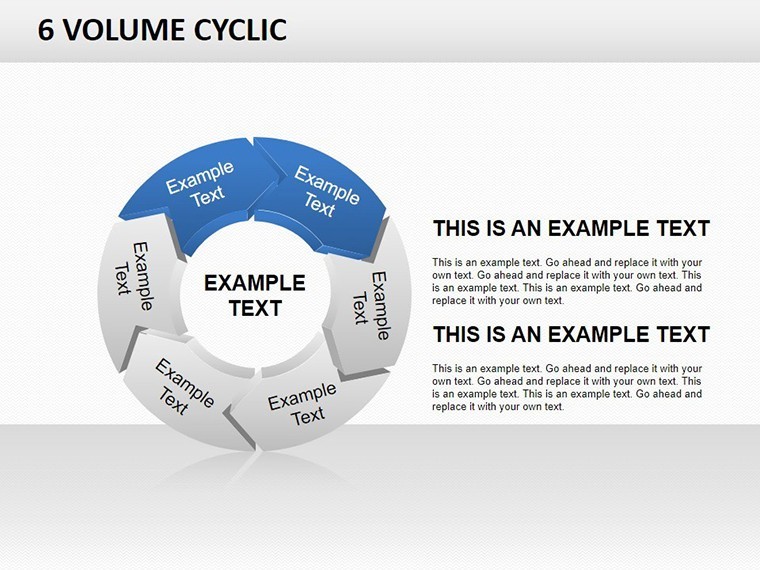
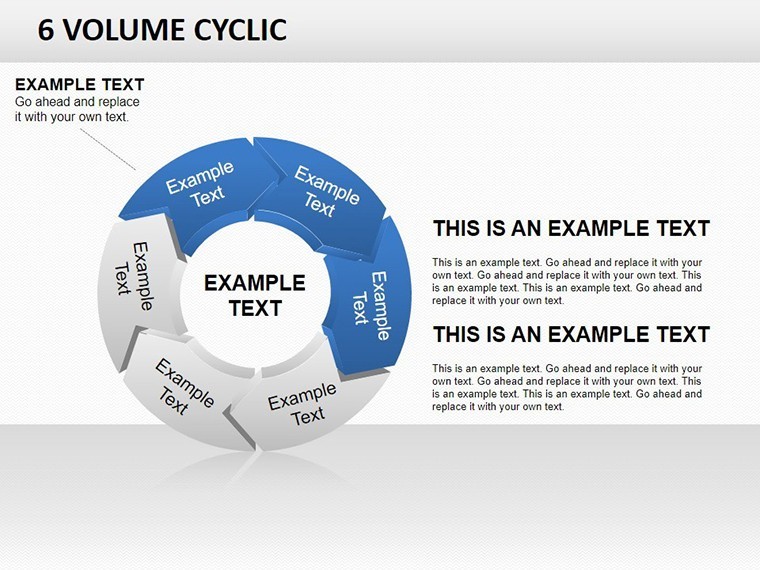
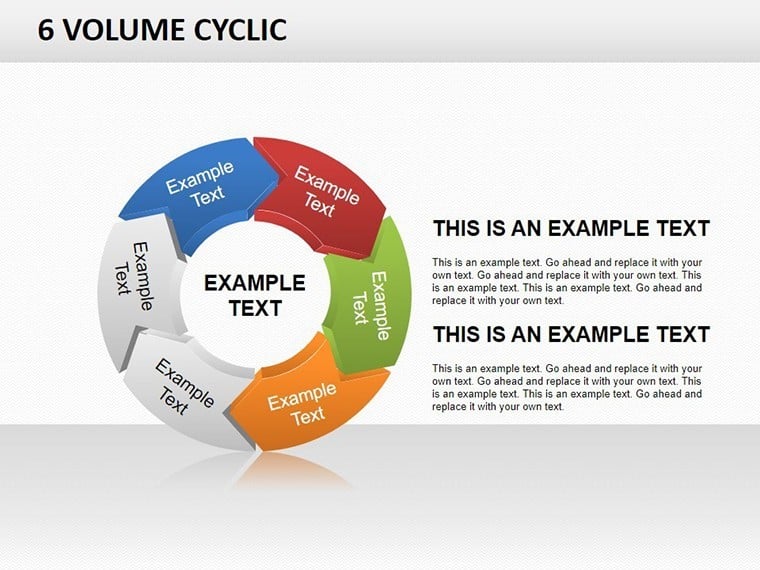
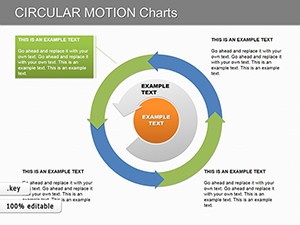
The heart of this template is its circular arrow layout, dividing the cycle into six actionable stages. Slide 3 showcases a full-volume cycle for process overviews, with arrows thickening to denote emphasis on high-impact phases. Progress to Slides 7-12, where color variations allow spotlighting specific steps, like ideation to evaluation in a product development loop.
Drawing expertise from design pros at Canva and beyond, this template ensures accessibility. A project team in logistics used it to map supply cycles, enhancing efficiency visuals and earning nods from C-suite viewers. Tweak arrows' curvature or fill volumes with Keynote's shape tools for personalized depth.
Core Features for Effortless Cycling
- 19 Editable Slides: Comprehensive set covering full cycles and breakdowns.
- Circular Arrow Graphs: Six-stage designs for principles like feedback loops.
- Keynote Compatibility: .key files with Google Slides/PowerPoint exports.
- Color Customization: Instant swaps for arrows and volumes, supporting diverse themes.
- Volume Scaling: Adjustable thicknesses to represent data intensity or priority.
These aren't superficial; they tackle cycle visualization challenges head-on. For instance, in education, volume arrows clarified lesson planning stages, boosting retention as per pedagogical studies.
Versatile Use Cases in Professional Settings
Consider a strategy session: Slide 9's six-stage cycle maps business growth phases, with volumes indicating resource needs - add metrics to arrows for quantifiable insights. In sustainability projects, use Slides 13-16 to depict environmental cycles, coloring stages for eco-impacts like reduce-reuse-recycle.
Real-world wins abound: A consulting report from McKinsey analogs showed cyclic charts improving decision-making by 35%. Embed into workflows by importing CSV data, then animate arrows to simulate flow in Keynote.
Step-by-Step Customization Essentials
- Access the File: Open in Keynote and lock onto cycle masters for uniformity.
- Define Stages: Label the six arrows (e.g., Slide 1 for planning), insert text or icons.
- Adjust Volumes: Scale arrow widths to reflect data volumes using drag handles.
- Color Code: Select elements and apply palettes - quick changes for multi-version decks.
- Animate Cycles: Sequence builds to rotate the arrow, mimicking real progression.
This method democratizes advanced design, ideal for quick iterations. Insider tip: Layer subtle gradients on volumes for a 3D effect, elevating perceived sophistication.
Superior to Conventional Cycle Tools
Default Keynote cycles often lack volume nuance, resulting in flat representations. This template adds depth with scalable elements and color agility, outpacing basic templates. Backed by strong ratings (474+), it's reliable for high-stakes uses.
Loop your ideas into lasting impact. Get the 6 Stage Cyclic Volume Keynote Charts Template today and propel your processes forward.
Frequently Asked Questions
How many stages are in the cyclic charts?
Six per main graph, fully editable for fewer or more if needed.
Can colors be changed quickly?
Yes, via Keynote's color wheel - applies to arrows and volumes instantly.
Is it for Keynote only?
Native to Keynote, but exports cleanly to PowerPoint for versatility.
What if I need more than 19 slides?
Duplicate cycles and modify; the masters ensure consistency.
Does it include icons for stages?
Basic shapes provided; add from Keynote's library for customization.
Best for what types of presentations?
Processes, workflows, and strategic cycles in business or education.
Good for
- Project roadmaps and sprint plans
- Product launch timelines
- Quarterly or annual review decks
- Company history and milestone summaries
Licence
reviews
I needed charts for a university project and this one was easy to edit.
The color balance between the graphs and icons looked pretty natural.
Slides loaded fast and I didn’t have to fix much.
A couple layouts felt repetitive after a while.
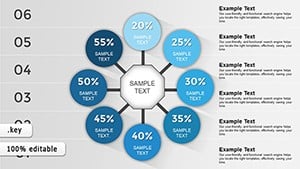
The circle diagrams were actually useful for my report.
FAQ
Will it work in Google Slides?
Are fonts embedded?
Can I use this for client work?
What's the refund policy?
Do you update the template after purchase?
Similar templates
See all Keynote Charts →
All 19 slides