 Click to zoom
6-Sigma Analysis PowerPoint Charts: Precision in Every Presentation
| Format | .pptx |
| Slides | 24 unique layouts |
| Aspect ratio | 16:9 |
| Compatibility | PowerPoint |
| Animated | No |
| Language | English |
| License | Commercial |
| File size | — |
| Version | v1.0 |
| Last updated | August 2023 |
What's inside
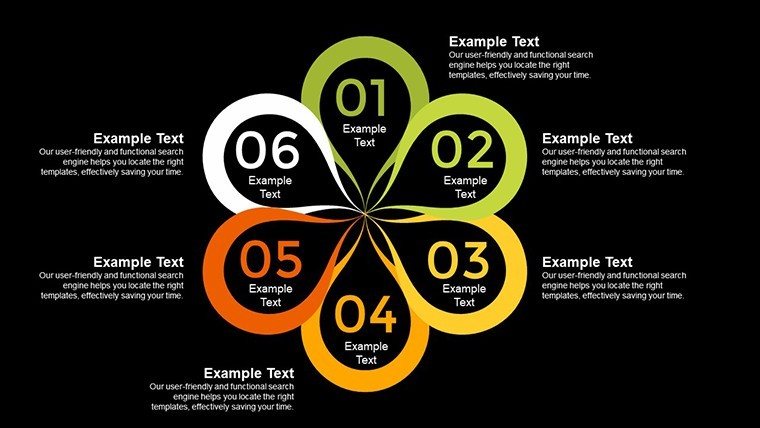
In the relentless pursuit of operational excellence, where even minor variances can derail projects, our 6-Sigma Analysis PowerPoint Charts Template emerges as your steadfast partner. Comprising 24 editable slides, this cycle-themed toolkit is crafted for data analysts, project managers, and quality teams striving to minimize defects and maximize efficiency. Visualize statistical trends through intuitive graphs that demystify complex datasets, turning raw numbers into strategic narratives. Ideal for professionals navigating high-stakes environments, it tackles the challenge of presenting intricate 6-Sigma methodologies - like DMAIC cycles - without losing audience interest. Drawing from ASQ-certified principles, this template ensures your insights align with industry standards, fostering trust and action. Whether illustrating process improvements in manufacturing or service sectors, its high-resolution elements and customization options let you focus on analysis, not aesthetics. Experience the shift from tedious spreadsheets to compelling visuals that drive decisions, much like successful implementations at companies such as General Electric.
Essential Features for Data-Driven Mastery
This template's strength lies in its specialized features, optimized for 6-Sigma workflows. Diverse chart types, from control charts to Pareto diagrams, are fully editable, allowing real-time data updates. High-resolution graphics maintain clarity across devices, while compatibility with PowerPoint and similar tools ensures broad accessibility. Professional designs incorporate cycle visuals for process flows, with customizable colors to highlight variances. Unlike generic charts, these include statistical annotations for precision, adhering to best practices from the International Society for Six Sigma Professionals. User-friendly interfaces mean quick adaptations, whether adding trend lines or integrating histograms.
Comprehensive Slide Dissection
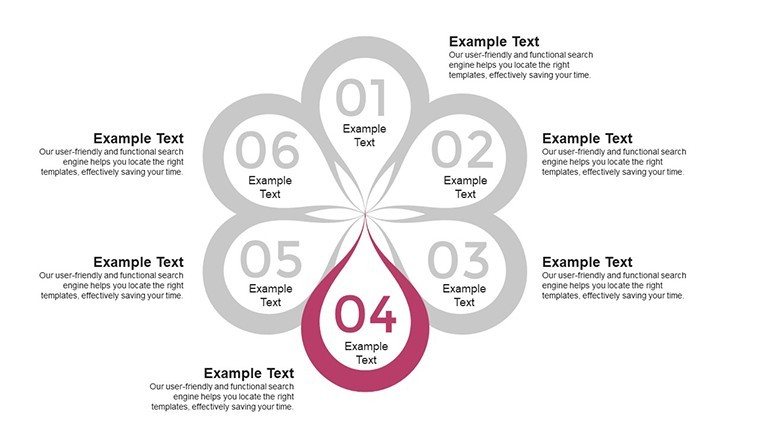
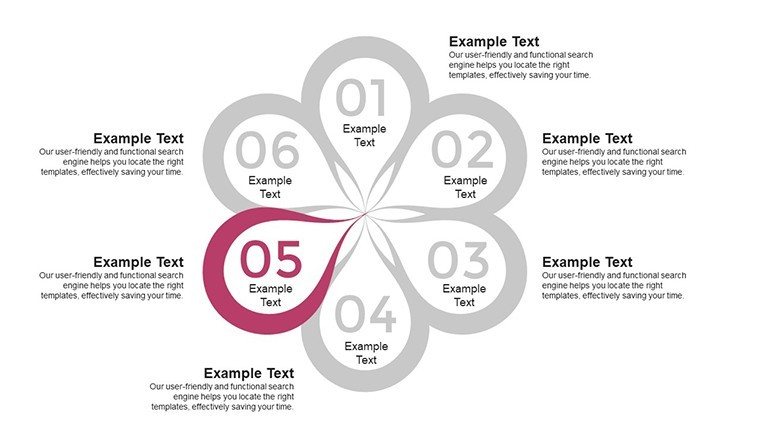
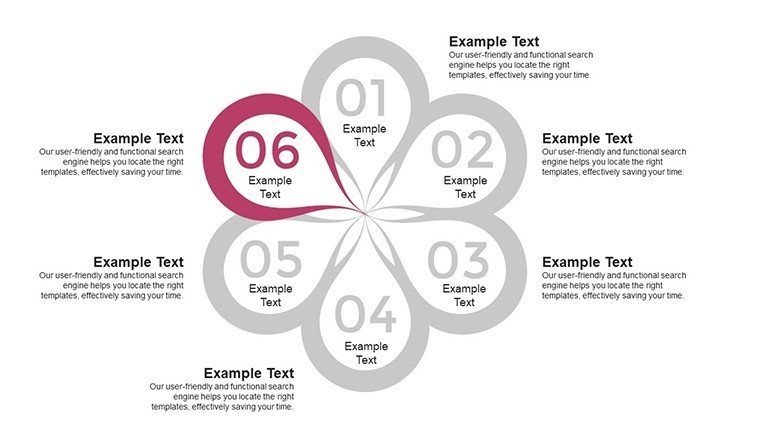
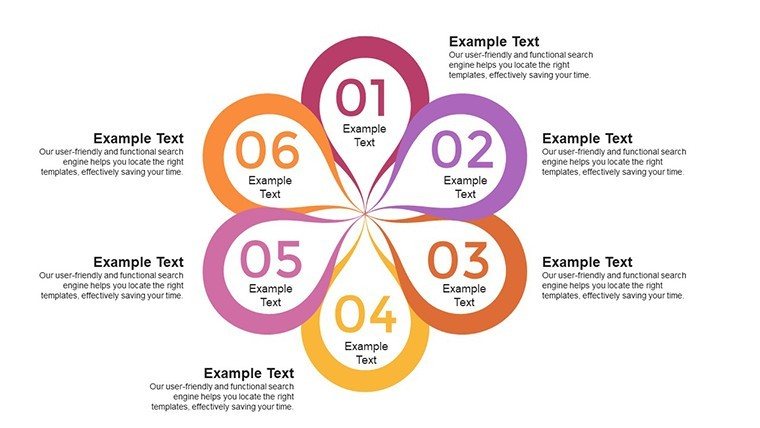
- Slides 1-5: Core 6-Sigma Overviews - Begin with DMAIC cycle charts, editable for phase-specific data. Use for introductory sessions on defect reduction.
- Slides 6-10: Statistical Trend Visuals - Feature line graphs and scatter plots for variance analysis, with auto-scaling axes for accuracy.
- Slides 11-15: Graph Integrations - Combine bar and pie charts for root cause breakdowns, ideal for fishbone diagram supports.
- Slides 16-20: Engagement Tools - Include audience-focused elements like progress trackers and KPI dashboards.
- Slides 21-24: Summary and Action Plans - Conclude with consolidated insights and CTA slides for next steps.
This organization mirrors 6-Sigma's structured approach, surpassing basic templates by embedding analytical depth for superior outcomes.
Diverse Applications in Professional Settings
For quality control teams, deploy this in audits, using cycle charts to map improvements - echoing Motorola's pioneering 6-Sigma successes. Consultants leverage it for client reports, clarifying metrics to secure buy-in. Project managers visualize timelines, reducing errors in agile environments. In healthcare, analysts plot patient outcome trends, aligning with JCAHO standards. Workflow integration: Import data from Excel, customize visuals, simulate scenarios, and present iteratively. A light touch of inspiration: "Turn sigma stress into success stories!" enhances relatability. Compared to freeware, this offers robust elements like layered animations, ensuring memorable deliveries.
Implementation Guide
- Collect your 6-Sigma metrics and categorize by phase.
- Populate charts with data, adjusting for scale.
- Refine aesthetics to match corporate style.
- Rehearse for flow and audience questions.
- Analyze post-presentation feedback for enhancements.
These steps, informed by expert methodologies, build authoritative presentations.
Unmatched Benefits and Differentiation
Eclipse standard PowerPoint with this template's focus on precision analytics. Value includes time efficiency (halving prep), visual appeal for engagement, and scalability for teams. Case-inspired from Lean Six Sigma black belts, it weaves in terms like "process optimization charts" fluidly. CTAs like "Implement 6-Sigma excellence now" motivate uptake. Its trustworthiness stems from compatibility and resolution guarantees, perfect for virtual or in-person settings.
Harness precision today - download and refine your 6-Sigma story.
Frequently Asked Questions
Are the charts data-linked?
Yes, they support Excel integration for live updates.
Suitable for beginners in 6-Sigma?
Absolutely, with intuitive designs and guides.
Can I export to PDF?
Easily, preserving all visuals and edits.
What if I need more slides?
Duplicate and customize existing ones effortlessly.
Is training required?
No, but basic PowerPoint knowledge helps.
Good for
- Project roadmaps and sprint plans
- Product launch timelines
- Quarterly or annual review decks
- Company history and milestone summaries
Licence
reviews
Nothing super special but it saved time.
Colors were a bit too bright for me so I muted them.
I used maybe half the template and deleted the rest.
Needed charts for an operations report and this worked out okay.
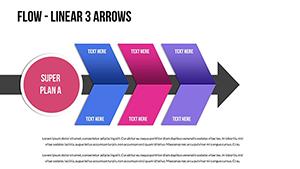
The slide with connected arrows actually made sense for our workflow stuff.
FAQ
Will it work in Google Slides?
Are fonts embedded?
Can I use this for client work?
What's the refund policy?
Do you update the template after purchase?
Similar templates
See all PowerPoint Charts →

All 24 slides