 Click to zoom
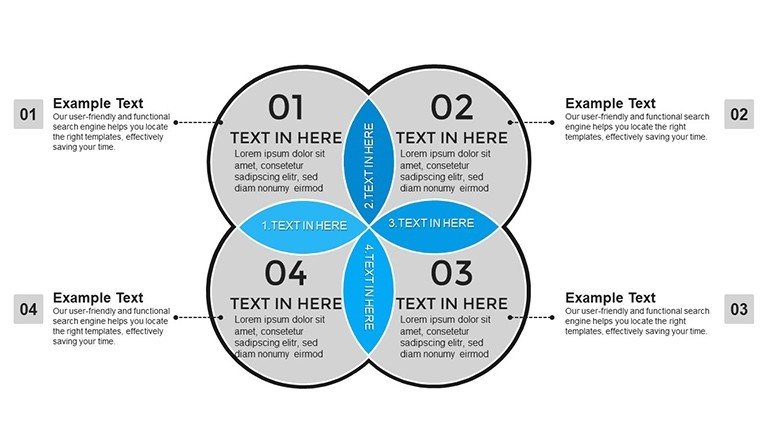
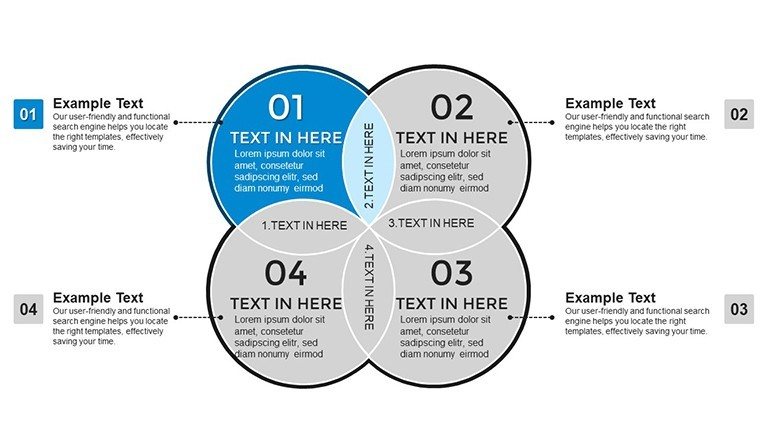
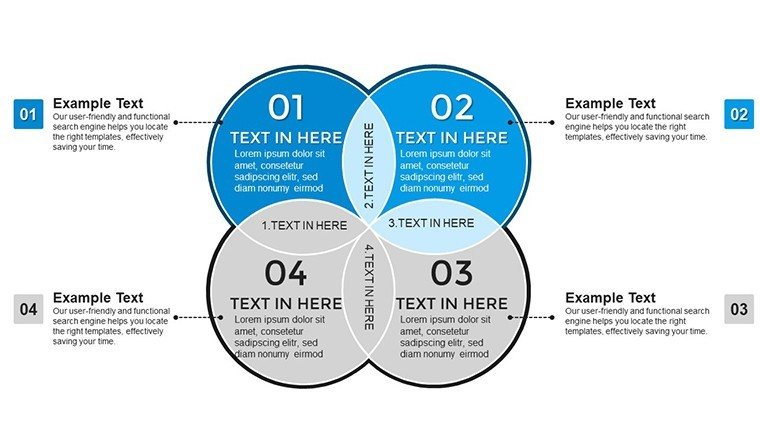
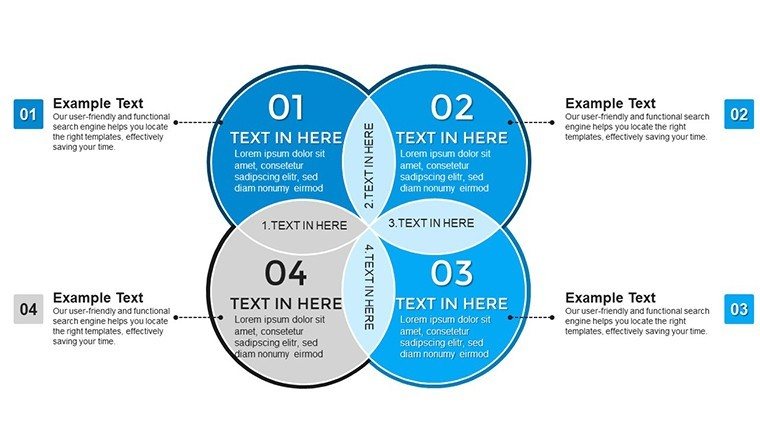
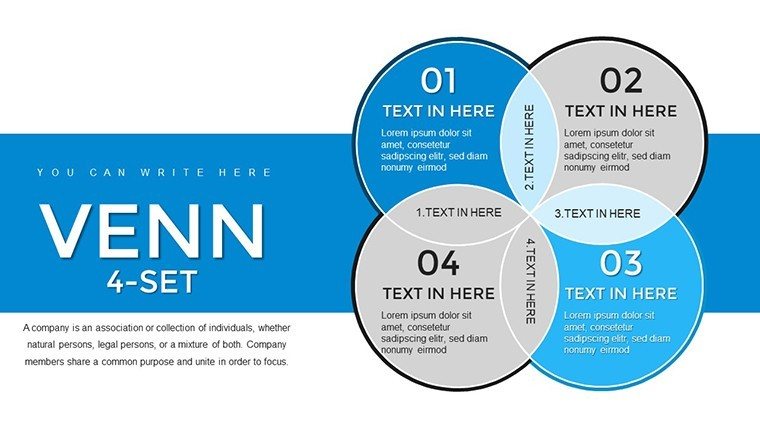
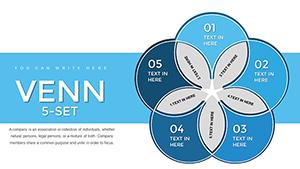
4-Set Venn Diagram PowerPoint Template: Visualize Complex Intersections
| Format | .pptx |
| Slides | 45 unique layouts |
| Aspect ratio | 16:9 |
| Compatibility | PowerPoint |
| Animated | No |
| Language | English |
| License | Commercial |
| File size | — |
| Version | v1.0 |
| Last updated | August 2023 |
What's inside
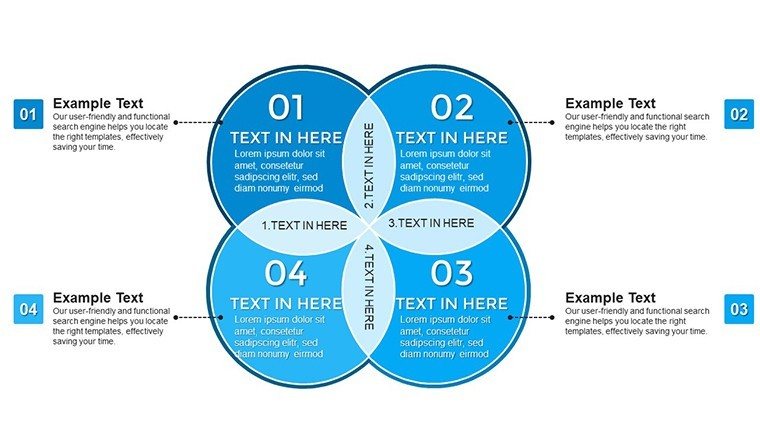
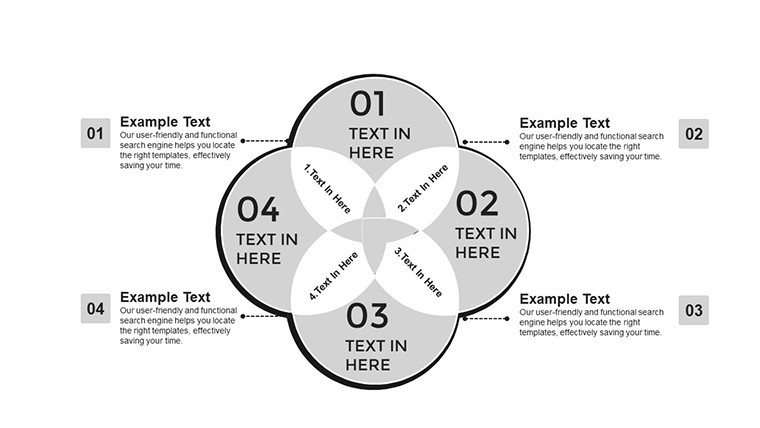
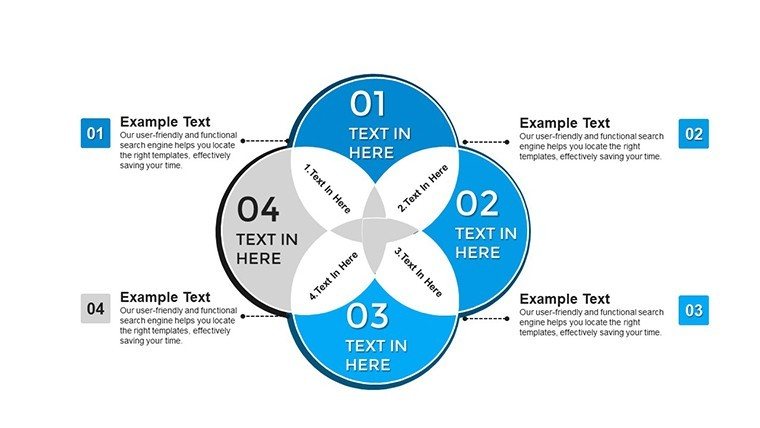
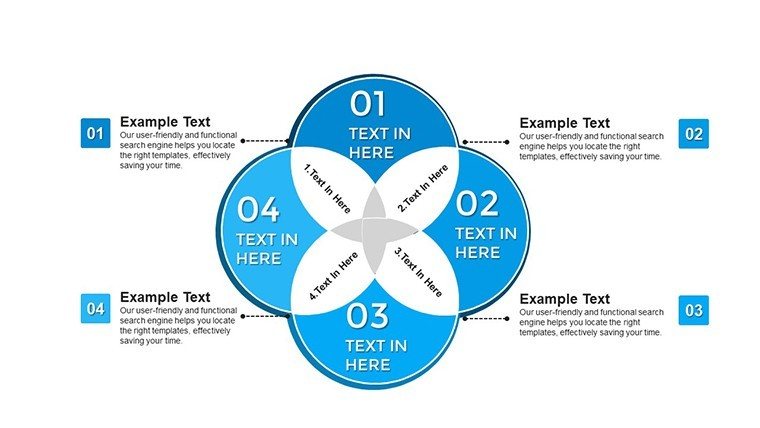
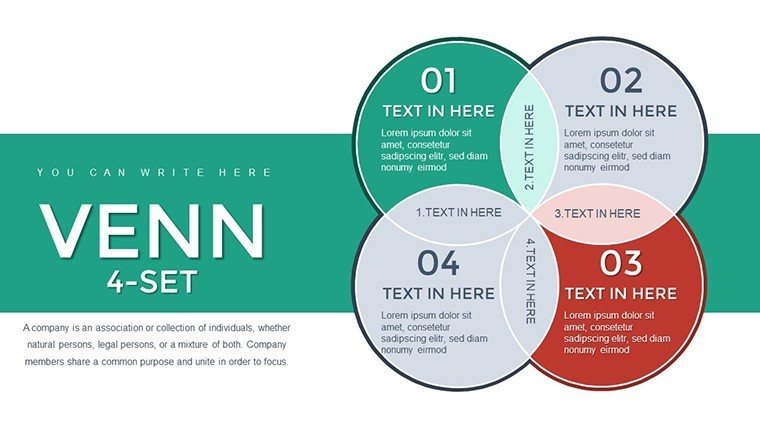
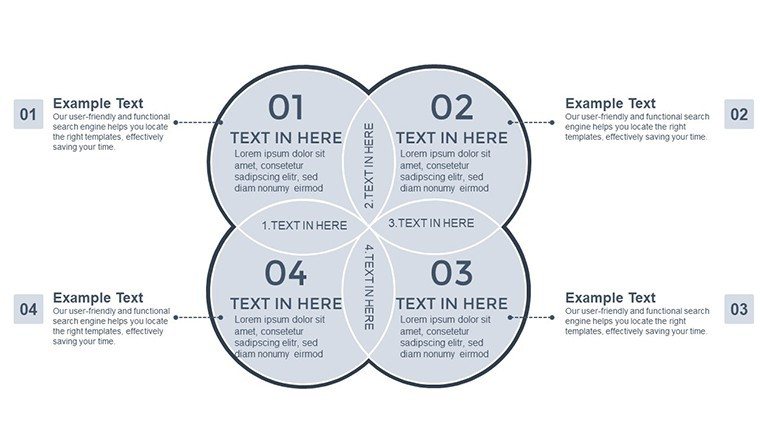
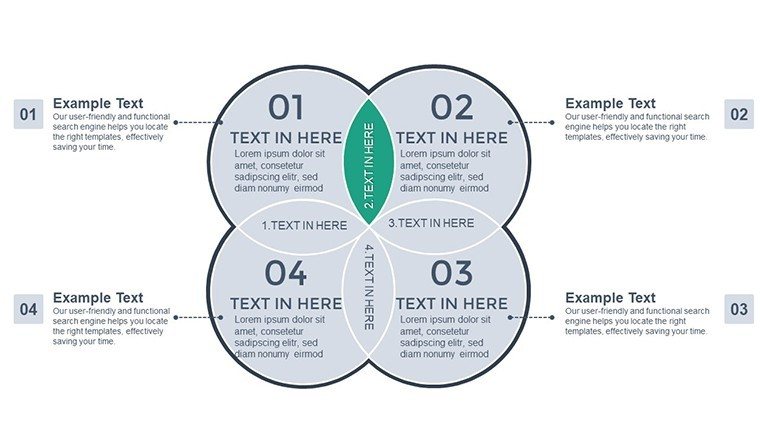
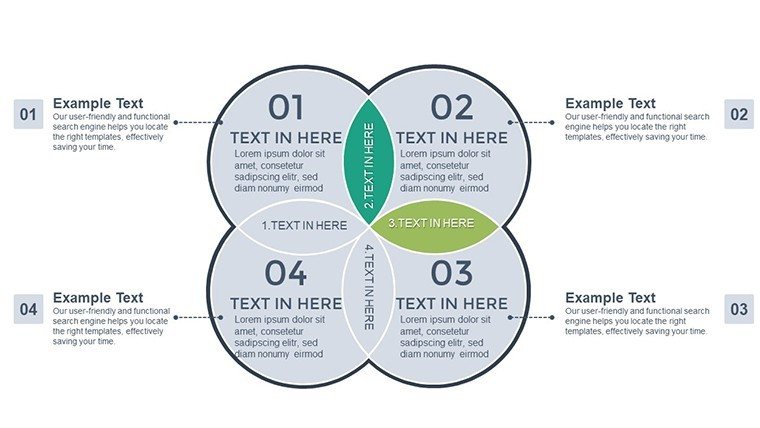
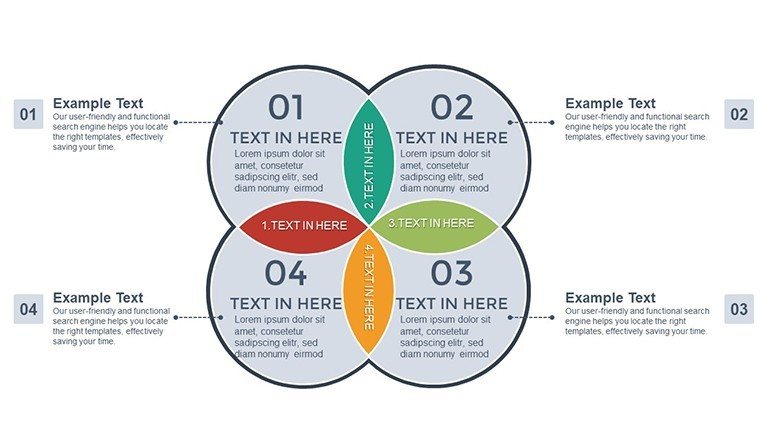
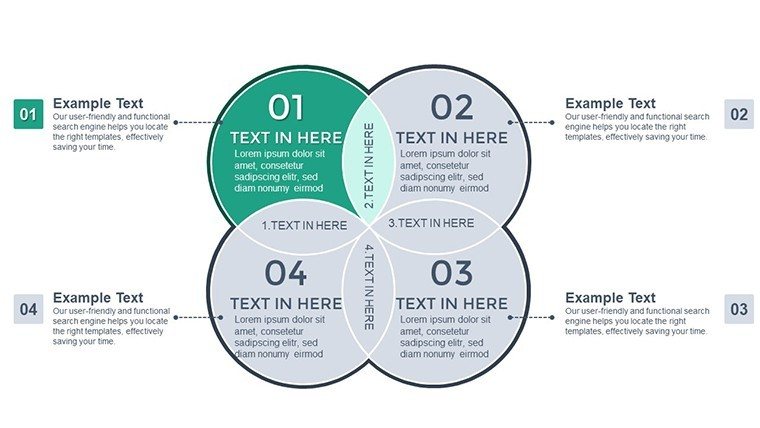
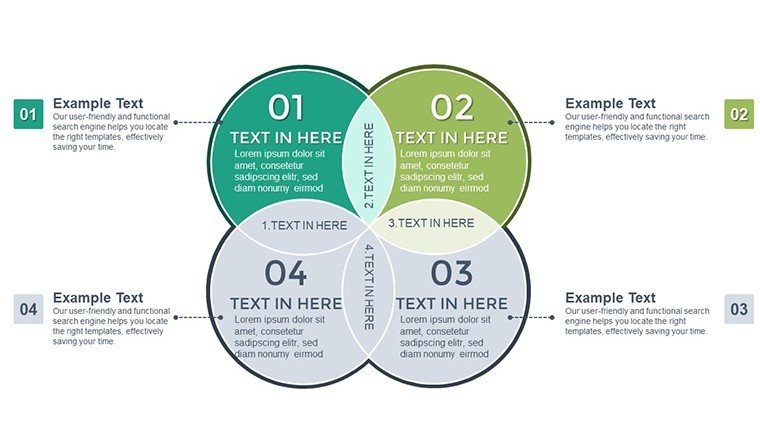
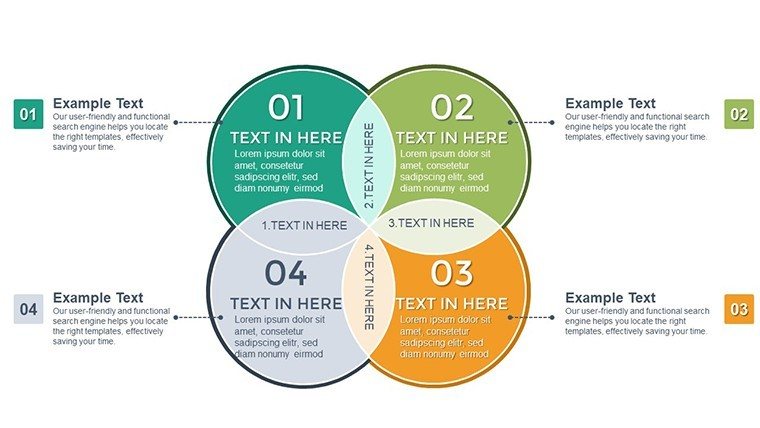
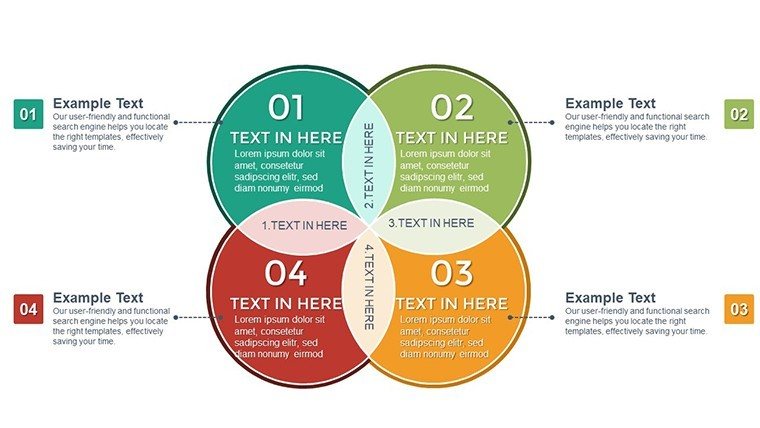
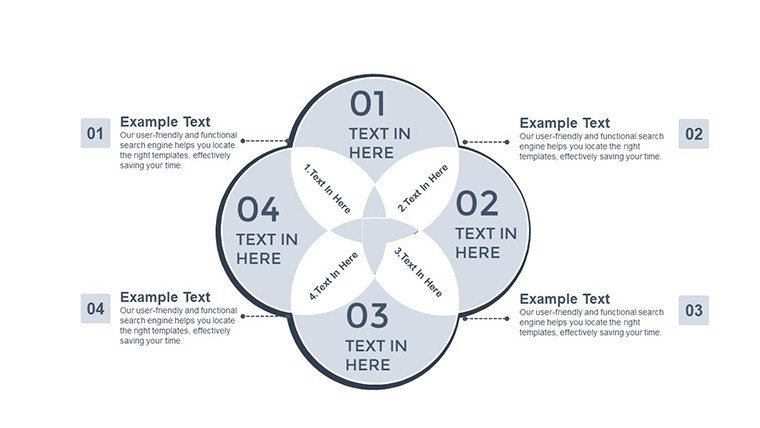
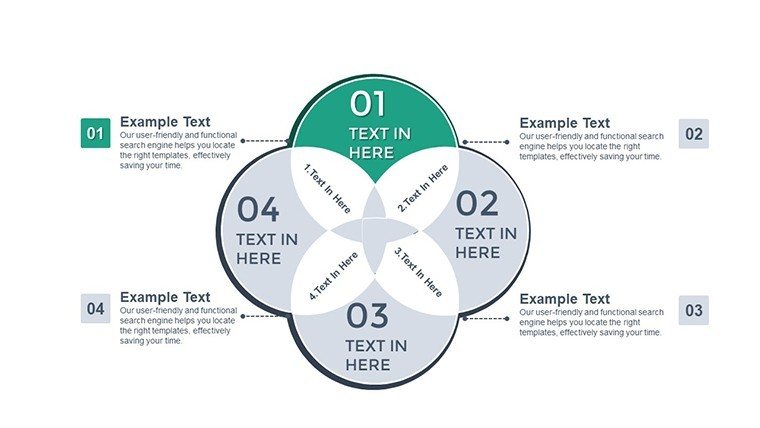
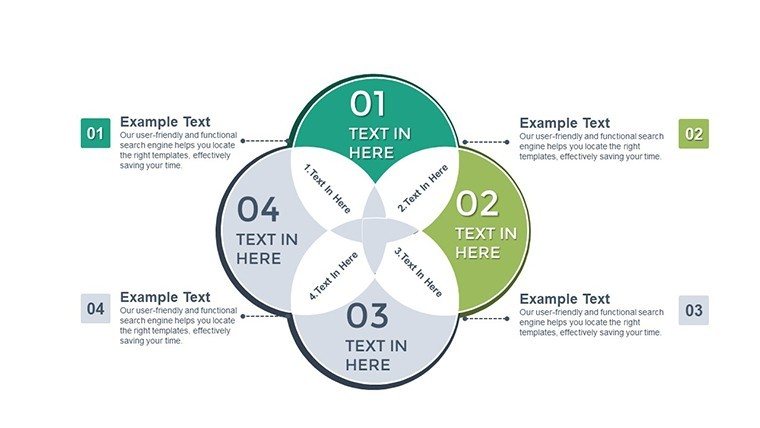
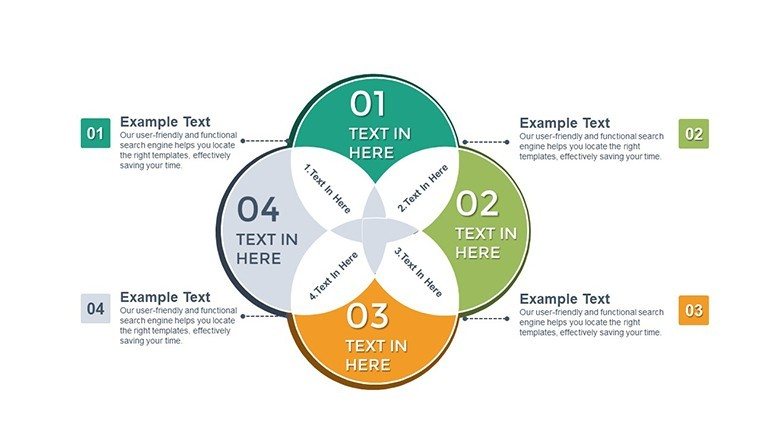
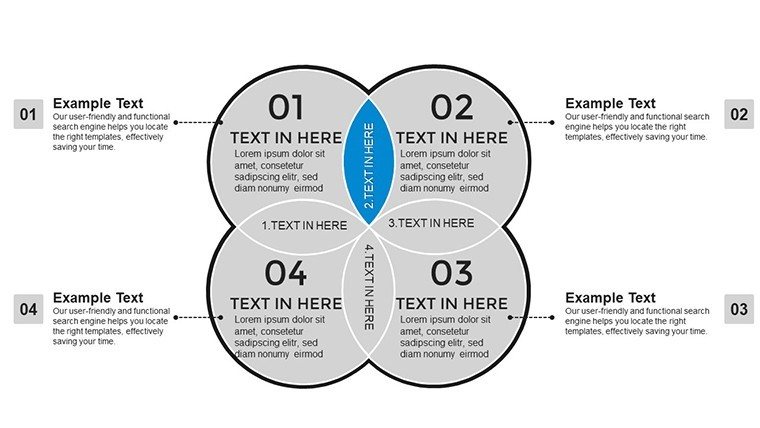
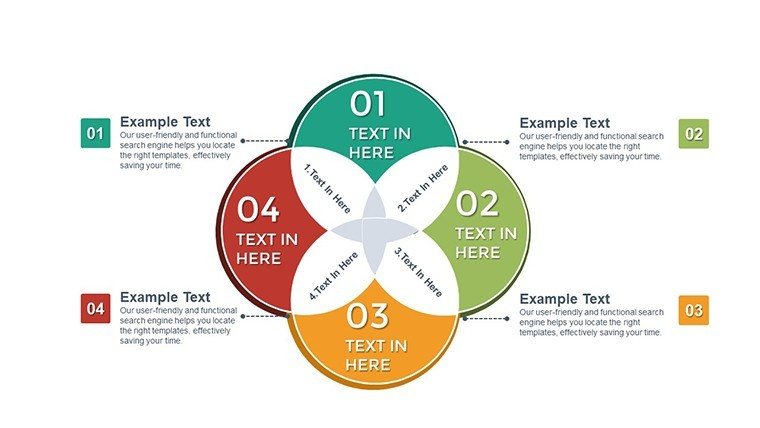
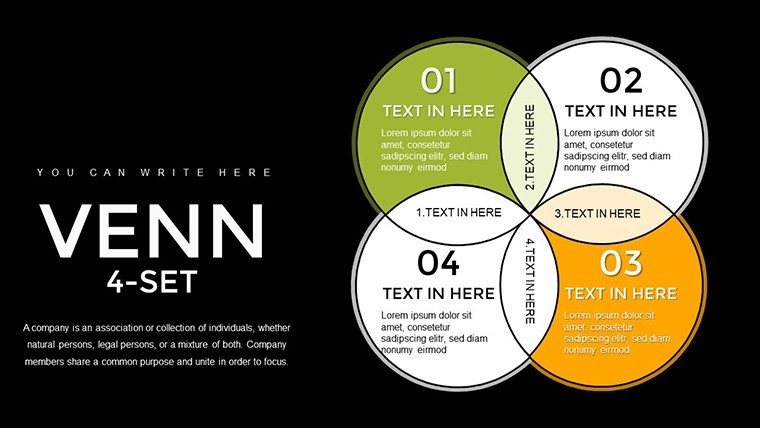
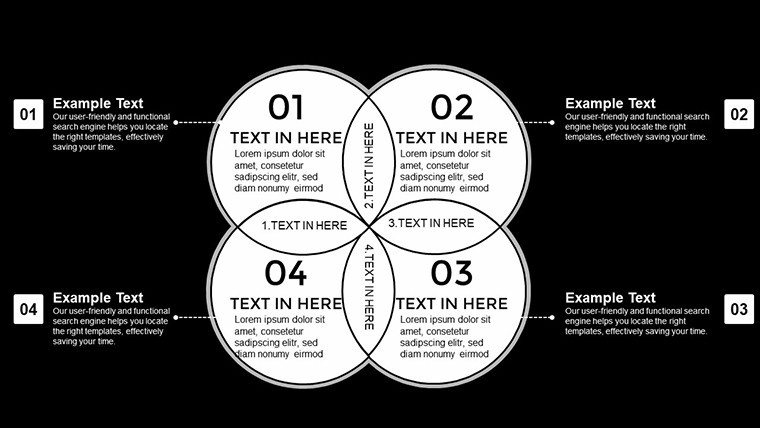
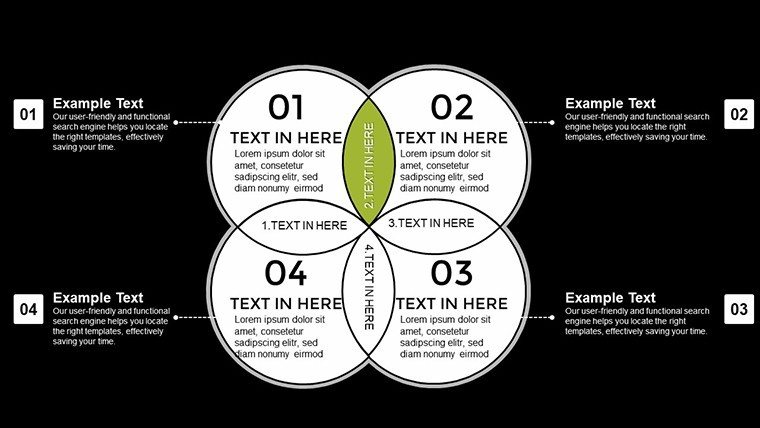
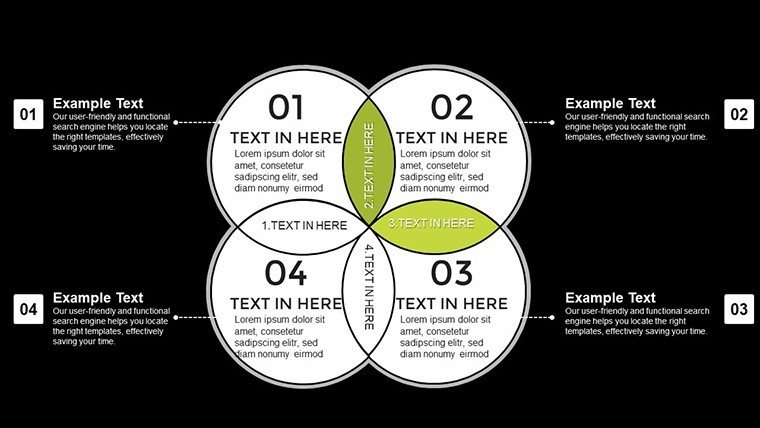
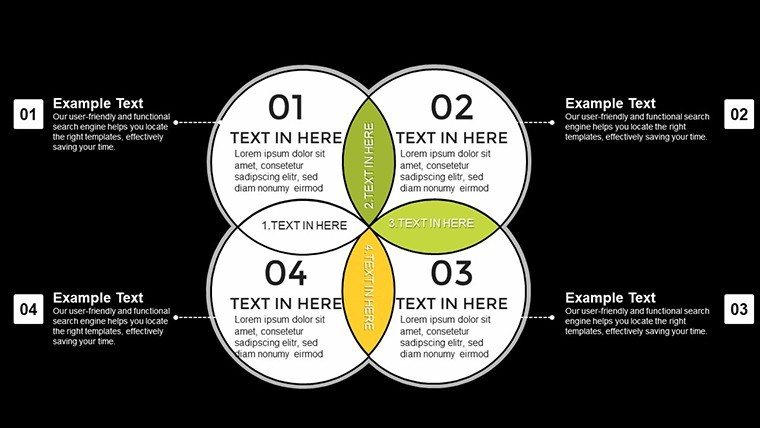
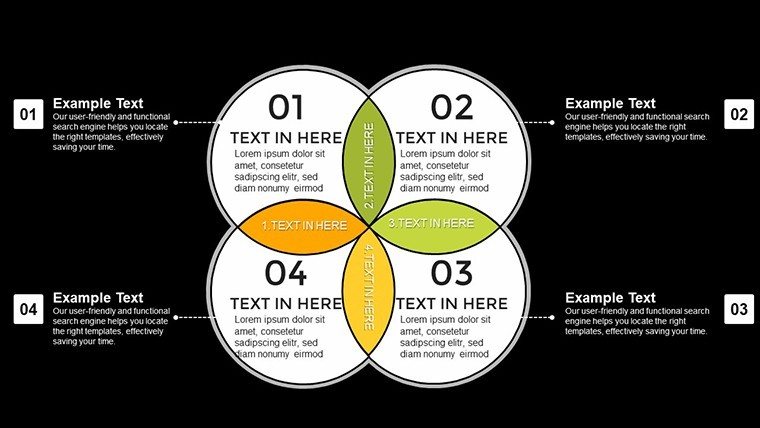
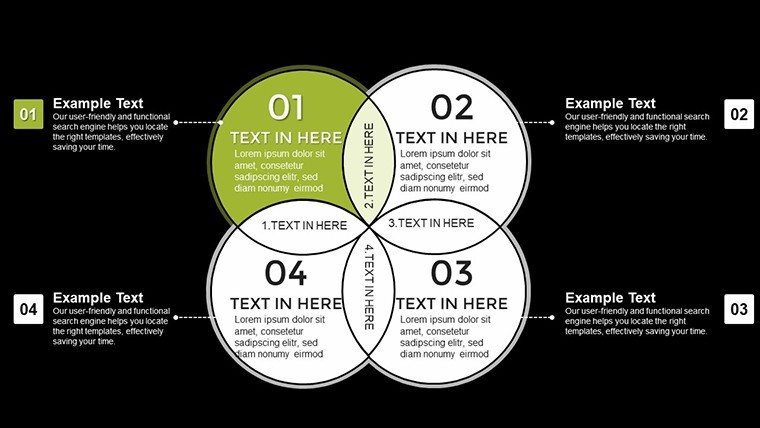
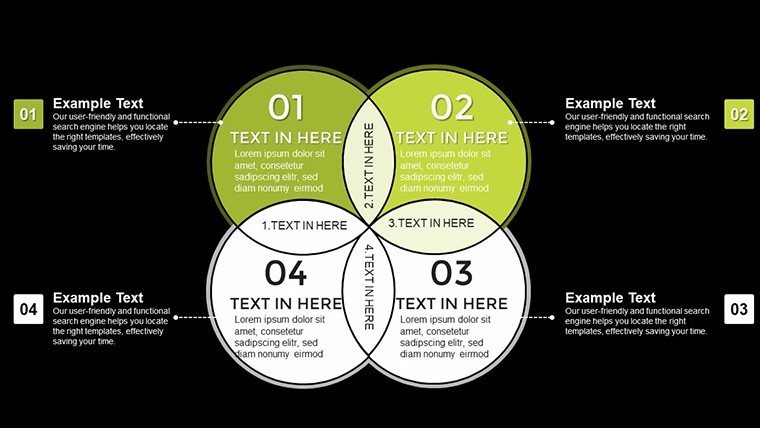
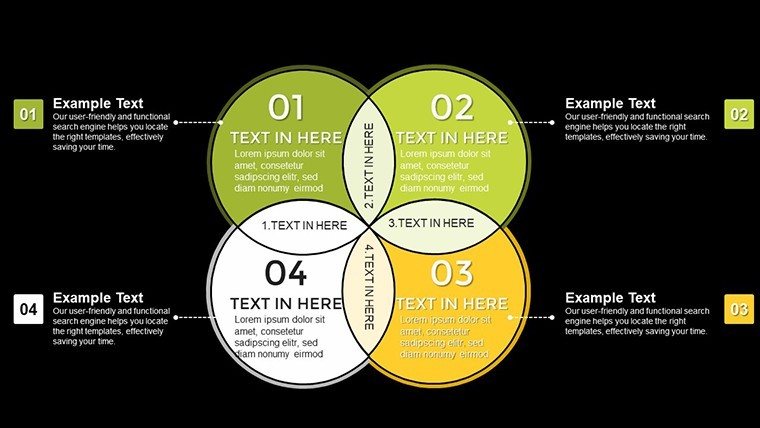
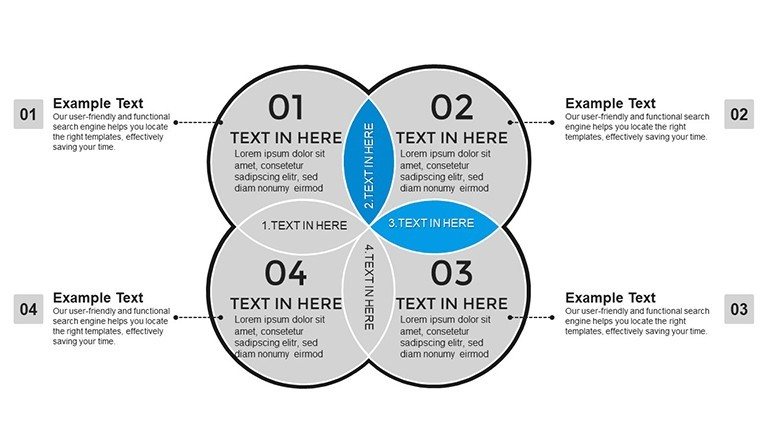
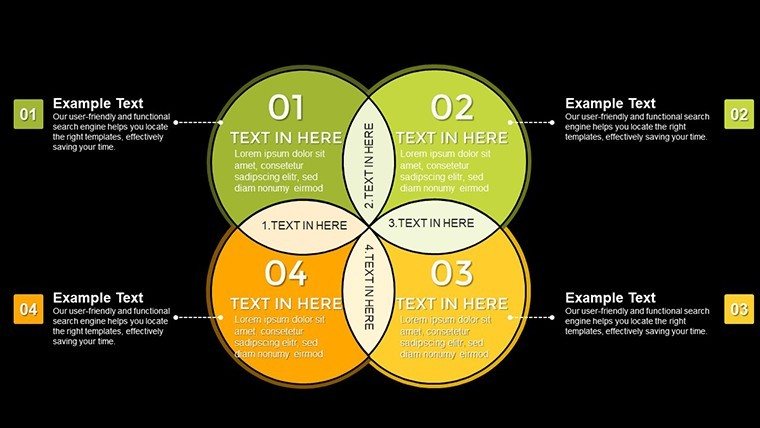
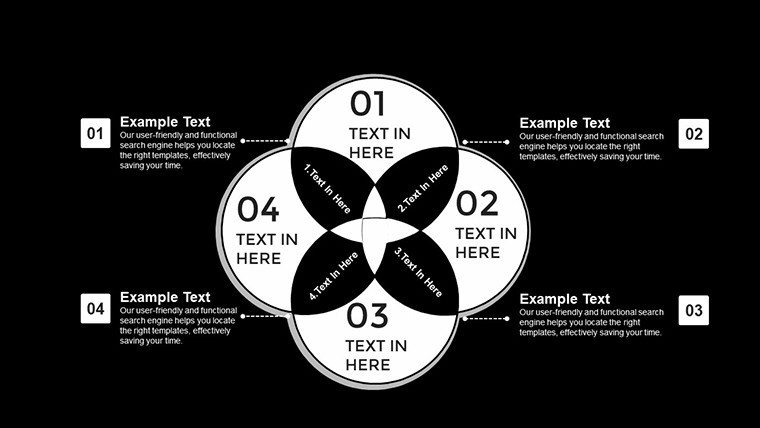
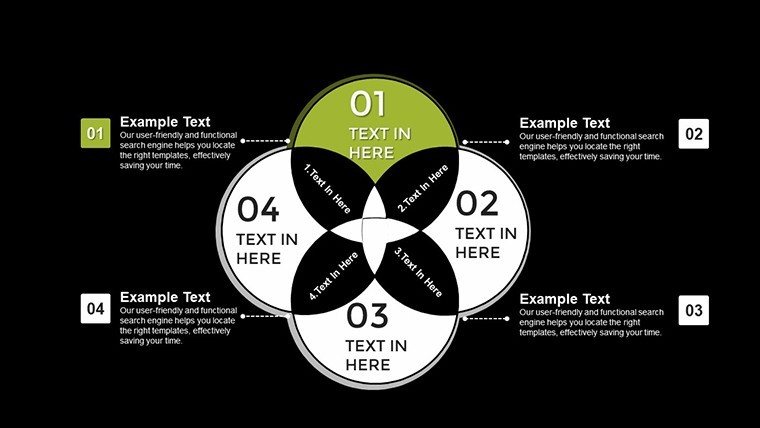
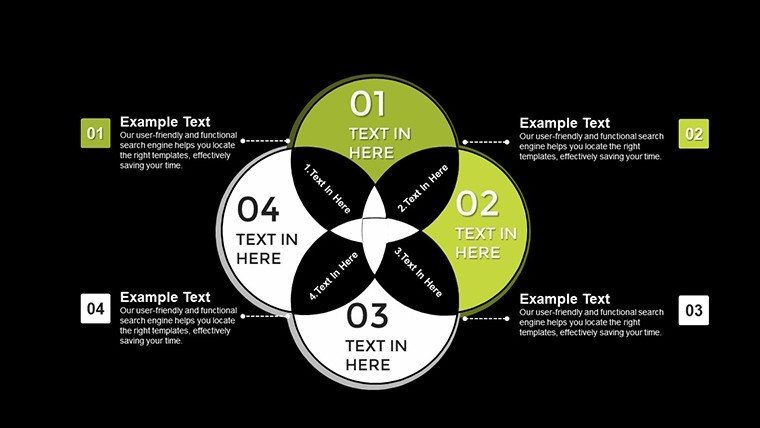
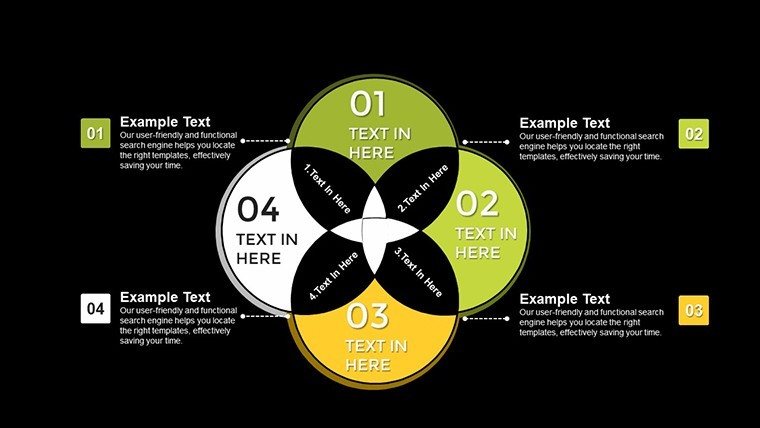
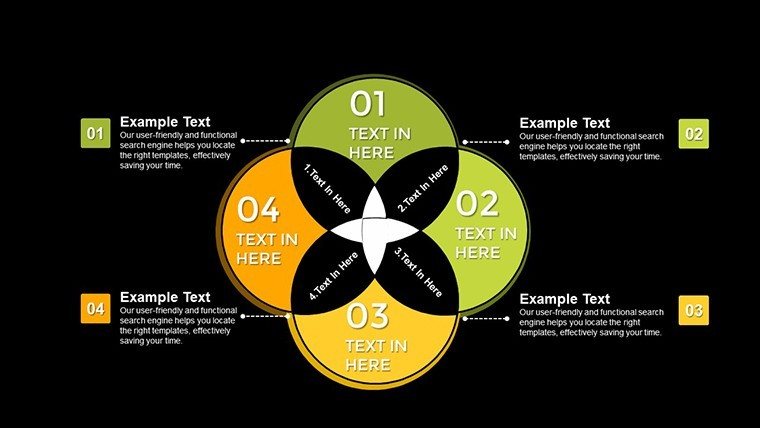
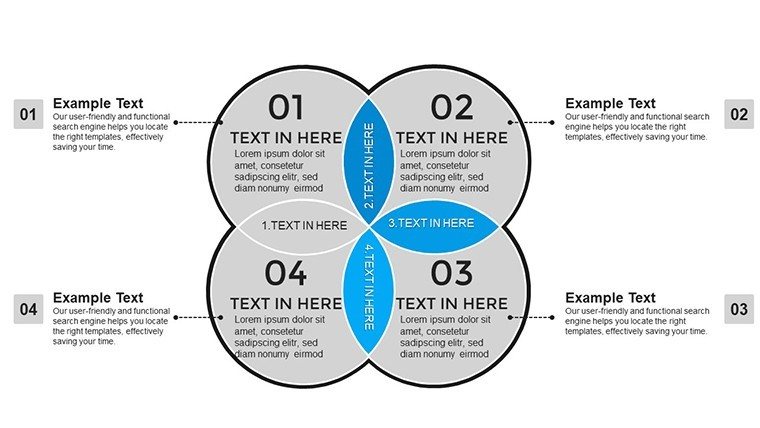
Relationships in data aren't always binary; they overlap in intricate ways that demand sophisticated visuals. Enter our 4-Set Venn Diagram PowerPoint Template, boasting 45 editable slides to illustrate multifaceted connections. Ideal for business analysts, researchers, marketers, and educators, it simplifies depicting overlaps among four datasets. Customize to show market segments or team synergies, with intuitive designs that make complexity accessible. This template excels in clarity, offering print-ready and projection-optimized layouts far superior to rudimentary shapes, helping you convey nuanced insights with confidence.
Key Features Enhancing Data Representation
Customization is paramount: Tweak colors, styles, and data integrations to brand-match. Clear designs ensure intuitive comprehension, while seamless Excel links keep visuals current. Optimized for digital and print, it's versatile across mediums.
Comprehensive Slide Details
Slides #0-10 focus on basic 4-set overlaps with labels. #15-30 add data charts, like pie integrations for quantitative analysis. #35-45 offer advanced variants, including 3D views and branching explanations.
Applications: Venn in Business and Beyond
Boardmix details 4-circle Venns for intricate comparisons, like market audience overlaps. SlideUplift's uses include quantifying audiences or sweet spots in strategies. Lucid's template aids teaching and business logic. Venngage applies to statistics, as in competitor analysis. MyMap.ai visualizes categories, e.g., in HR for skill intersections. For architecture, diagram stakeholder overlaps in projects, aligning with AIA for collaborative designs - a case from design pros shows improved team efficiency. In marketing, map customer personas; in education, teach set theory with real examples.
Integrate by importing datasets, then use styling for emphasis. Animate overlaps to reveal insights progressively in sessions.
Tips for Effective Use
- Balance Overlaps: Ensure legibility in crowded intersections.
- Color Code: Assign hues to sets for quick identification.
- Data Drive: Link to sources for dynamic updates.
- Narrate: Use slides to build comparative stories.
- Scale: Adapt for simpler 2-3 sets if needed.
Merge with matrices for deeper analysis, inspired by business cases.
Advantages Over Basics
Pre-built complexities save time; authoritative designs from sources like Venngage ensure trust. CTAs like "Discover Intersections" engage.
Unlock data relationships - customize your Venn today.
Frequently Asked Questions
How complex can overlaps get?Handles all 4-set intersections clearly.Print-friendly?Yes, high-res for handouts.Data integration possible?Seamless with Excel.Suitable for large audiences?Optimized for projections.Custom styling options?Extensive for branding.Examples provided?Yes, with sample data.Good for
- Project roadmaps and sprint plans
- Product launch timelines
- Quarterly or annual review decks
- Company history and milestone summaries
Licence
reviews
Used these slides for a financial summary and they worked fine.
The charts were already formatted nicely.
A few pages felt repetitive but still usable.
I liked the clean process diagrams.
Made my boring report look more organized.
FAQ
Will it work in Google Slides?
Are fonts embedded?
Can I use this for client work?
What's the refund policy?
Do you update the template after purchase?
Similar templates
See all PowerPoint Charts →
All 45 slides