 Click to zoom
4 Sector Gears PowerPoint Charts: Gear Up for Success
| Format | .pptx |
| Slides | 20 unique layouts |
| Aspect ratio | 16:9 |
| Compatibility | PowerPoint |
| Animated | No |
| Language | English |
| License | Commercial |
| File size | — |
| Version | v1.0 |
| Last updated | June 2024 |
What's inside
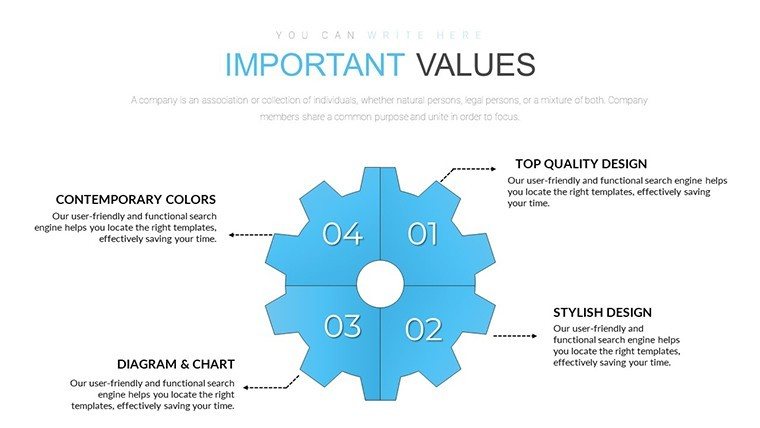
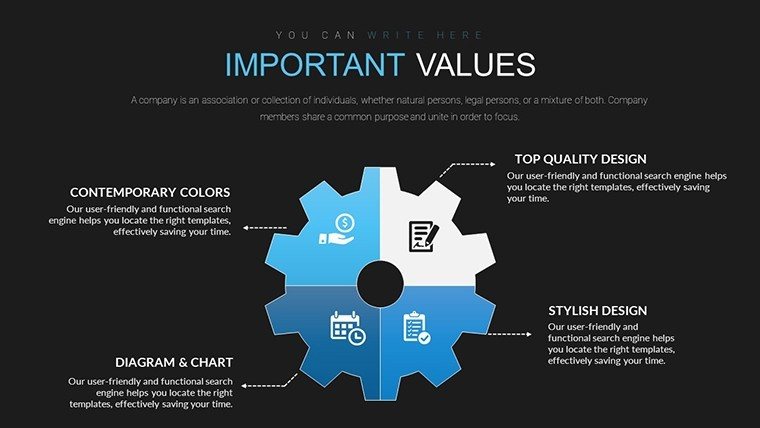
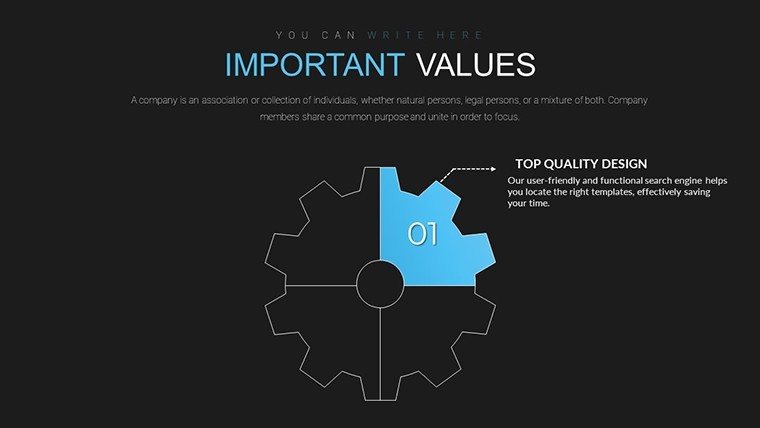
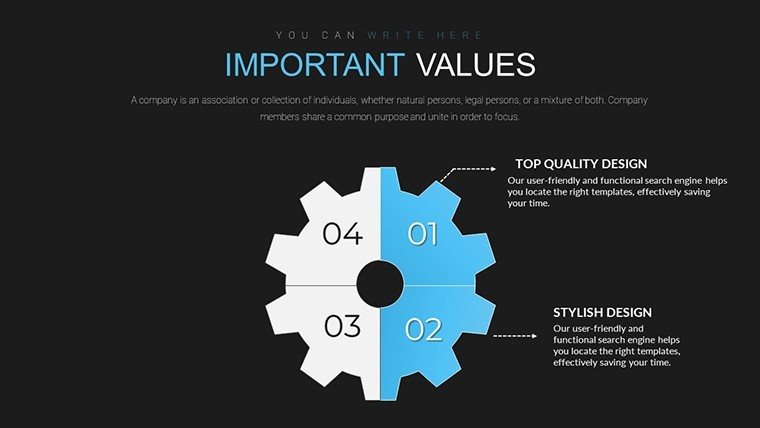
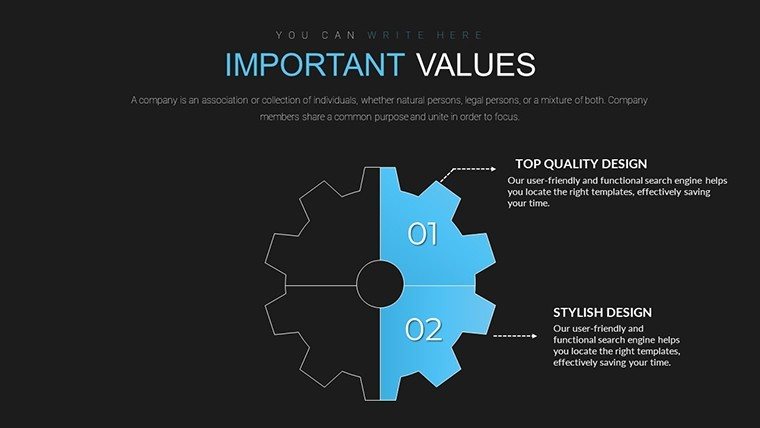
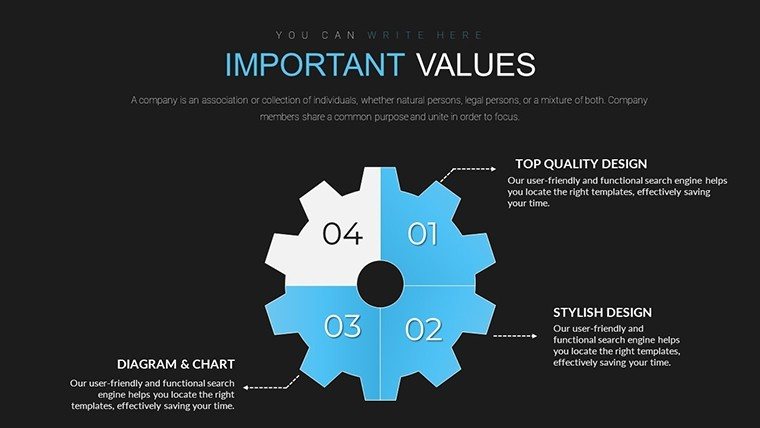
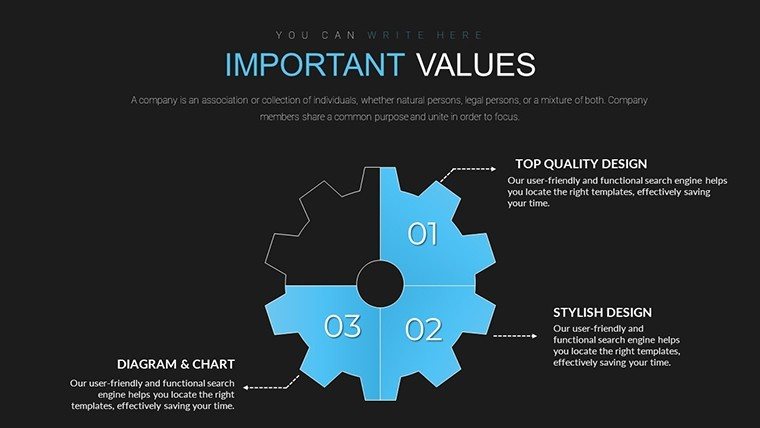
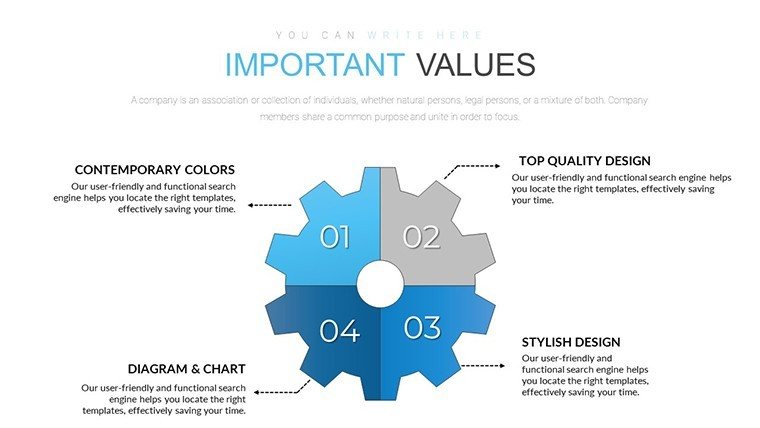
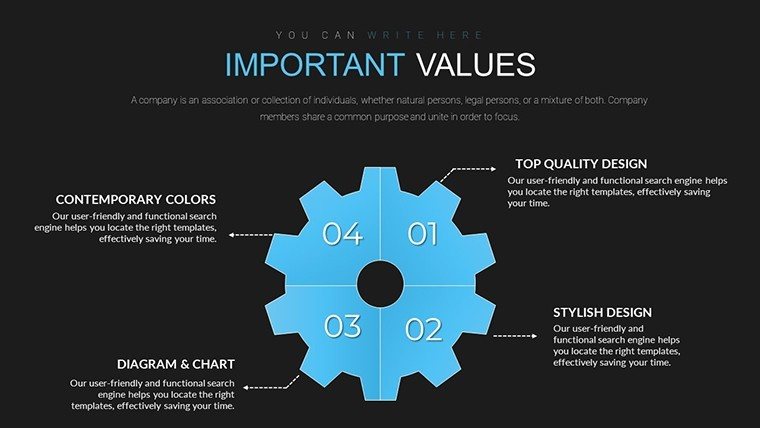
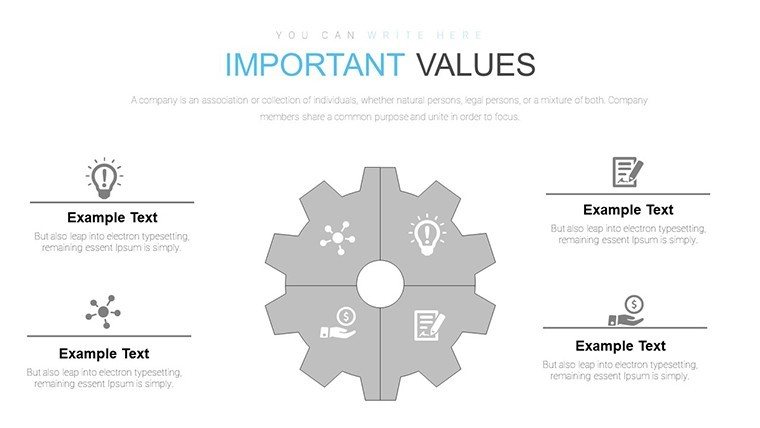
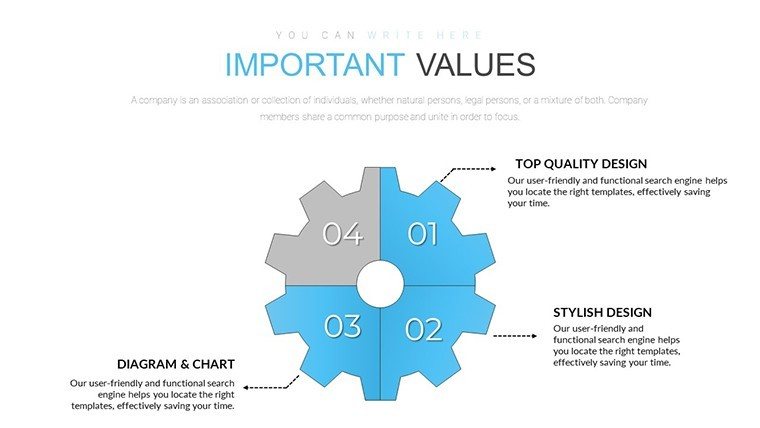
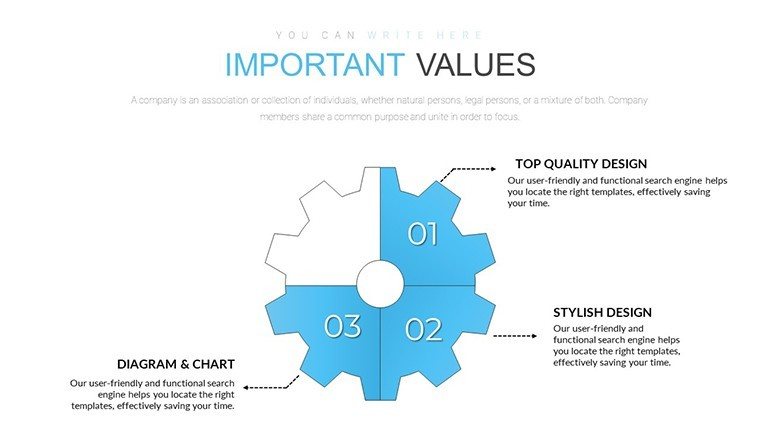
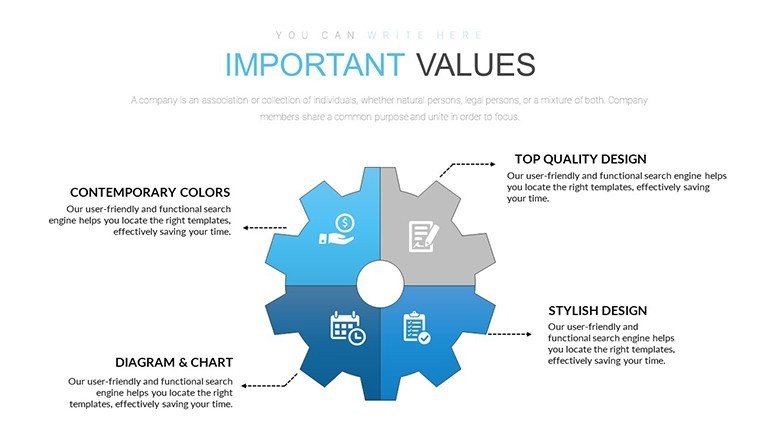
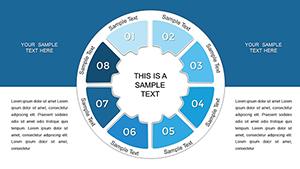
Envision your architecture presentation as a well-oiled machine, where each cog represents a pivotal process phase. Our 4 Sector Gears PowerPoint Charts Template, with 20 editable slides, is engineered for architects mapping out intricate workflows - from concept to completion. These gear-shaped diagrams symbolize interconnectedness, ideal for showing how design, engineering, construction, and maintenance mesh in a project lifecycle. Fully compatible with PowerPoint and Google Slides, they adhere to AIA's call for innovative visualization, turning abstract processes into engaging stories. Say goodbye to linear timelines; embrace gears that rotate with animations, illustrating synergies like how sustainable tech integrates with structural integrity. This template tackles the challenge of presenting multifaceted operations, empowering you to demonstrate efficiency and collaboration that wins contracts and inspires teams.
The Mechanics of Gear Charts in Architecture
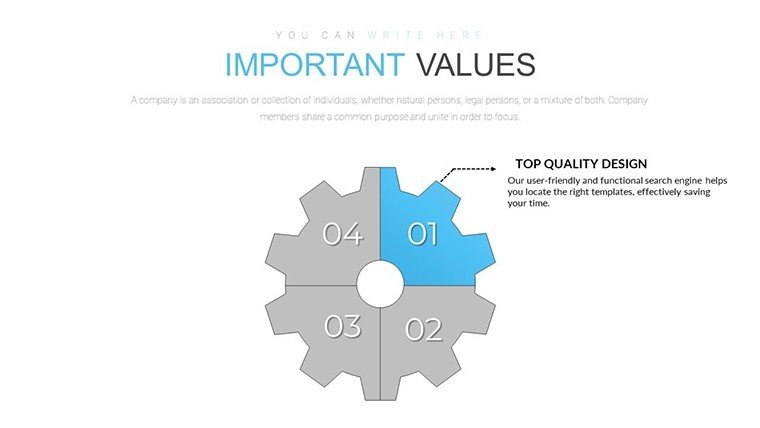
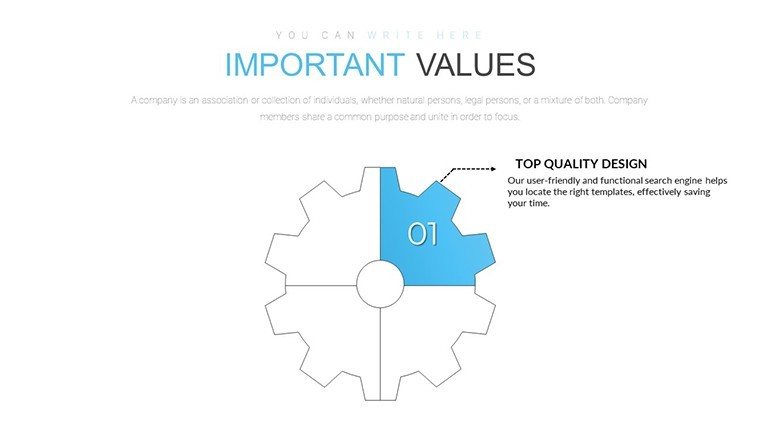
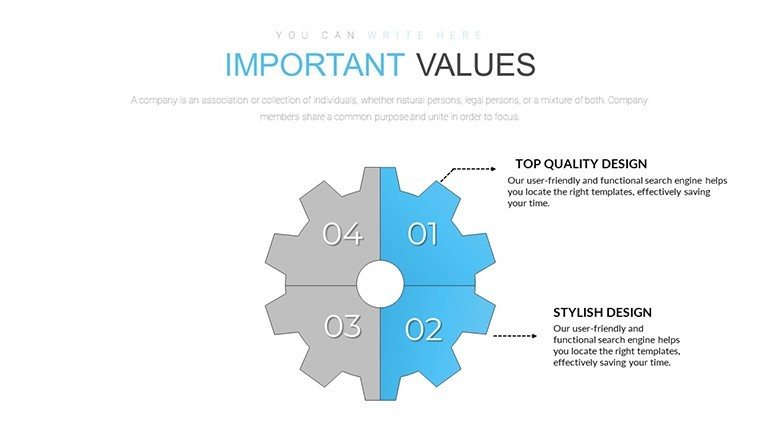
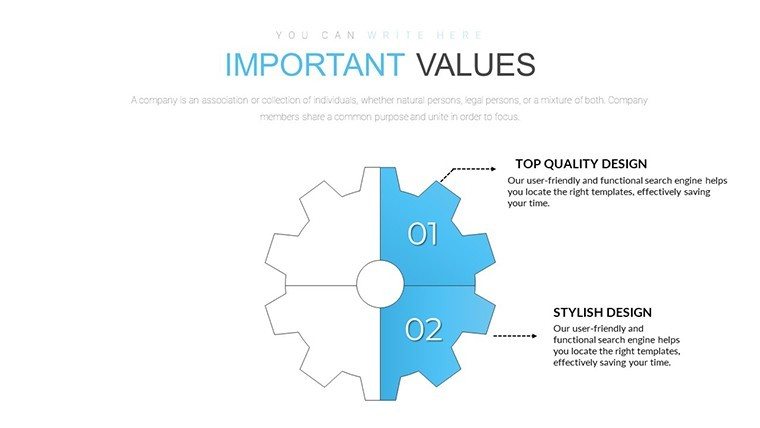
Gear charts divide data into four interlocking sectors, perfect for segmented processes. In architecture, use them to depict the four pillars of a build: planning, design, execution, and evaluation, with each gear tooth highlighting milestones like permit approvals or material sourcing.
Fluid animations make gears "turn," simulating real-world dynamics and keeping viewers hooked. Customize tooth counts for detail levels, and color-code sectors to reflect project statuses - green for go, red for risks.
Core Features That Propel Your Visuals
- Interlocking Designs: Gears that visually connect, emphasizing dependencies in architectural flows.
- Animation Suites: Pre-set rotations and fades for dramatic reveals.
- Scalable Vectors: Resize without loss, from boardroom screens to printed reports.
- Thematic Icons: Gear-integrated symbols like tools and blueprints for contextual flair.
- Data-Driven: Link to spreadsheets for auto-updates on metrics like timelines.
These attributes make your charts not just informative, but interactive engines of persuasion.
Driving Applications in Design and Beyond
For a master plan review, gear charts can illustrate how urban design gears with infrastructure, environment, and economy. In team briefings, show role interlocks to boost efficiency. Outperform basic bar charts by adding motion, which static visuals lack.
Echoing approaches at firms like SOM, who visualize complex systems, weave this into your routine: Export from CAD, input into gears, animate for emphasis. Advice: Sync gear speeds to narrative pace, label teeth with action items, and use shadows for 3D depth.
Blueprint for Implementation: Step-by-Step
- Launch the template and pick a gear layout for your process.
- Populate sectors with data, watching gears adjust proportionally.
- Tailor colors to project themes, like metallic for industrial designs.
- Apply animations to simulate movement, previewing flow.
- Incorporate text for explanations, ensuring brevity.
- Integrate into your deck and rehearse for smooth delivery.
This blueprint accelerates creation, letting you engineer ideas with ease.
Rev Up Your Presentations with Interconnected Insights
With 20 slides, tackle diverse scenarios from RFP responses to post-mortem analyses. Perks include heightened interactivity, process clarity, and professional polish. Infuse terms like workflow diagrams, process cogs, and synergy visuals naturally.
For AIA events, gear up compliance processes. Finale with a holistic gear slide, inviting "Mesh your vision with ours - download and drive forward."
Frequently Asked Questions
How do gear animations work?
They rotate sectors to show progression, customizable for speed and direction.
Can I add more than four sectors?
While optimized for four, duplicate gears for expanded views.
Is it compatible with older PowerPoint versions?
Yes, from 2010 onward, with full features in newer ones.
What data types suit gear charts?
Best for phased processes or segmented metrics in architecture.
Can I export animated gears?
Yes, to video or GIF for non-PowerPoint sharing.
Good for
- Project roadmaps and sprint plans
- Product launch timelines
- Quarterly or annual review decks
- Company history and milestone summaries
Licence
reviews
I finished my assignment faster because of these ready charts
Used it at work and it helped present numbers clearly
The arrows and sections guide the viewer well
I just needed something simple and this was okay
It is usable but not very exciting visually
FAQ
Will it work in Google Slides?
Are fonts embedded?
Can I use this for client work?
What's the refund policy?
Do you update the template after purchase?
Similar templates
See all PowerPoint Charts →

All 20 slides