 Click to zoom
3D Volume Cyclic Keynote Charts - Editable | ImagineLayout
| Format | .pptx |
| Slides | 40 unique layouts |
| Aspect ratio | 130/73 |
| Compatibility | PowerPoint |
| Animated | No |
| Language | English |
| License | Commercial |
| File size | — |
| Version | v1.0 |
| Last updated | April 2026 |
What's inside
40 Slides Across Cycle Layouts: Full Contents
40 editable slides arrive inside the Keynote chart template.
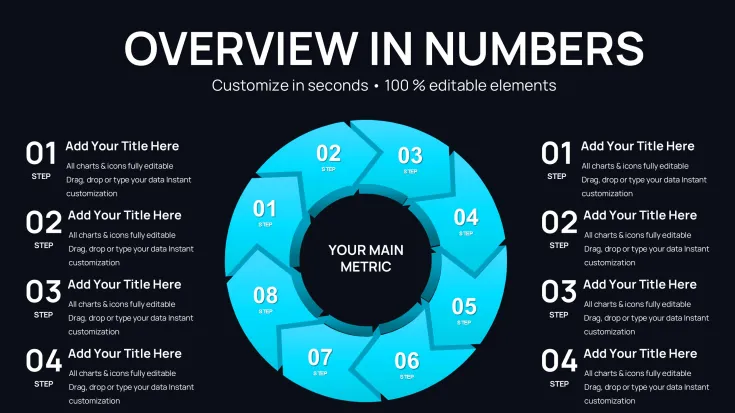
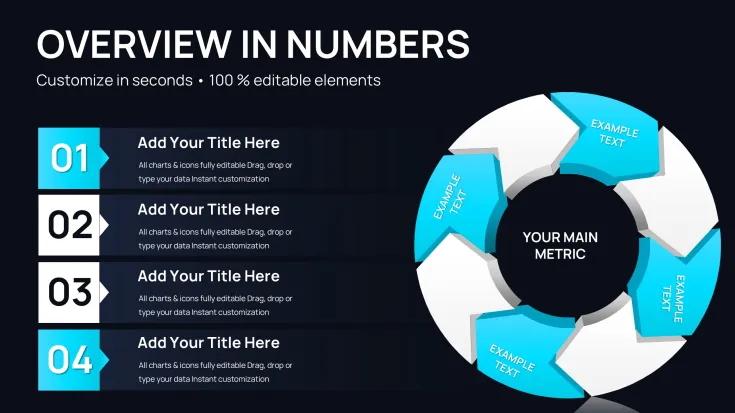
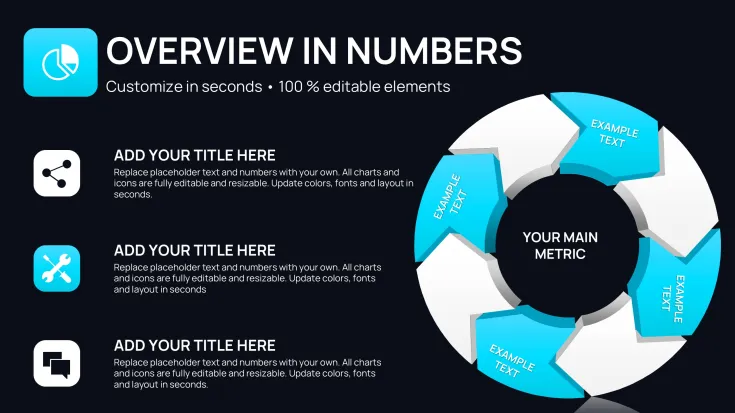
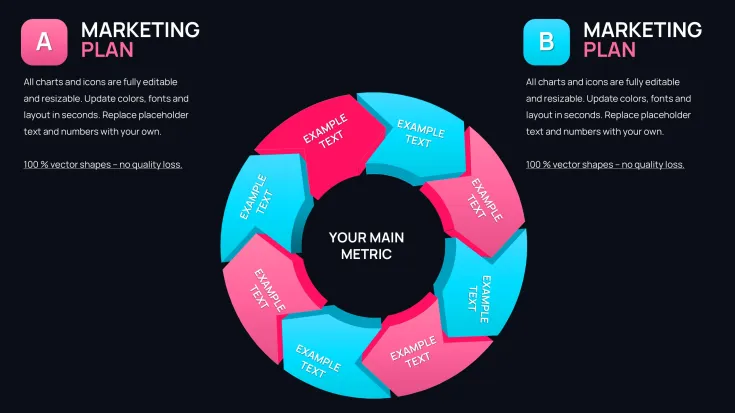
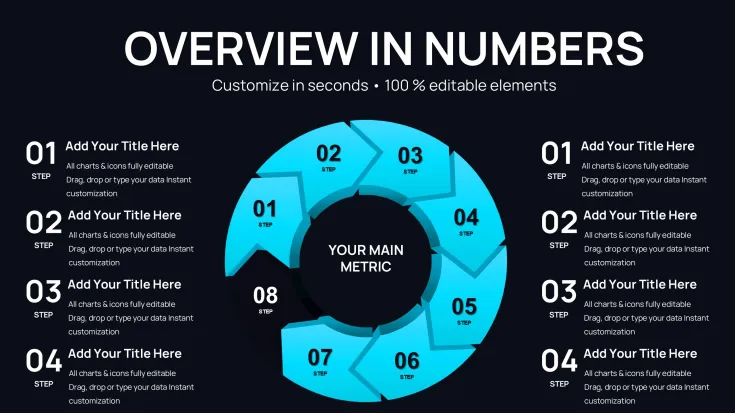
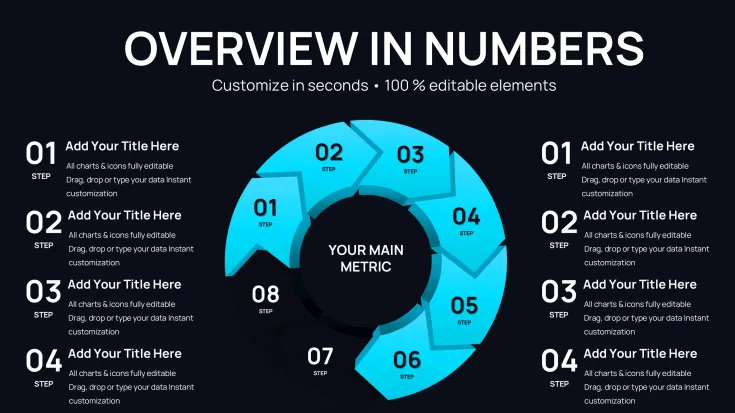
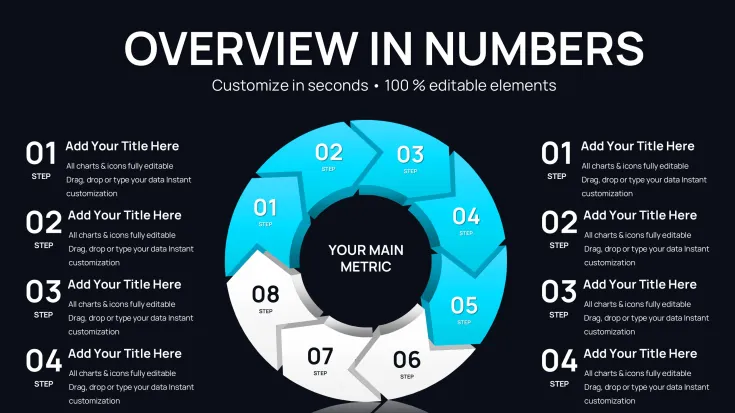
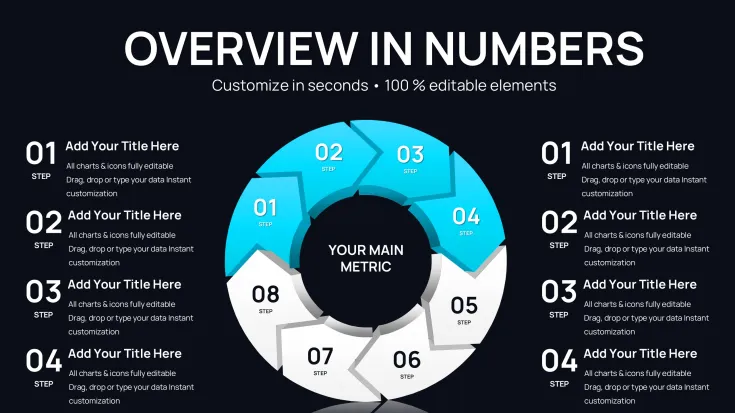
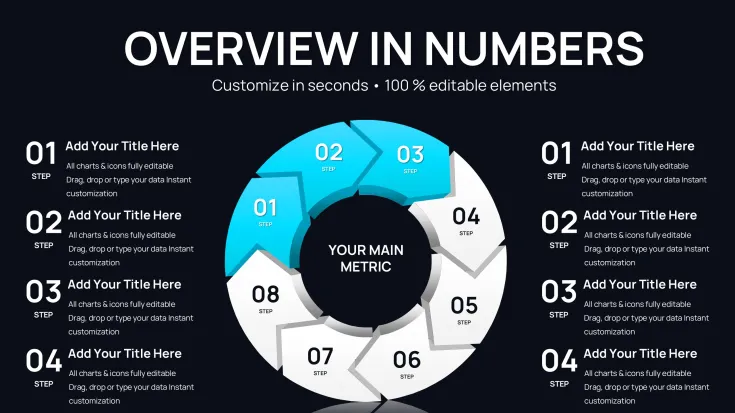
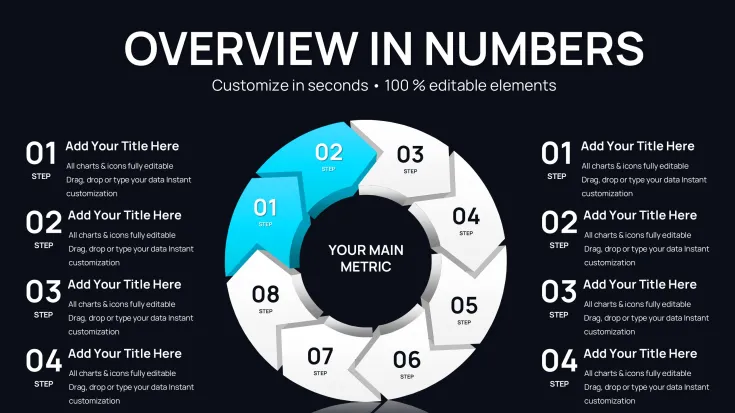
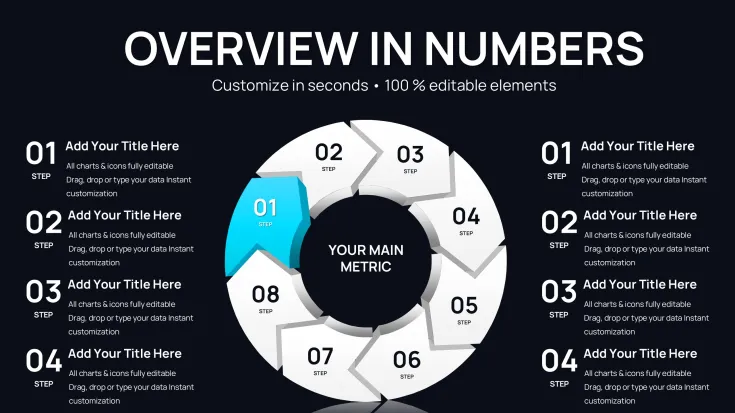
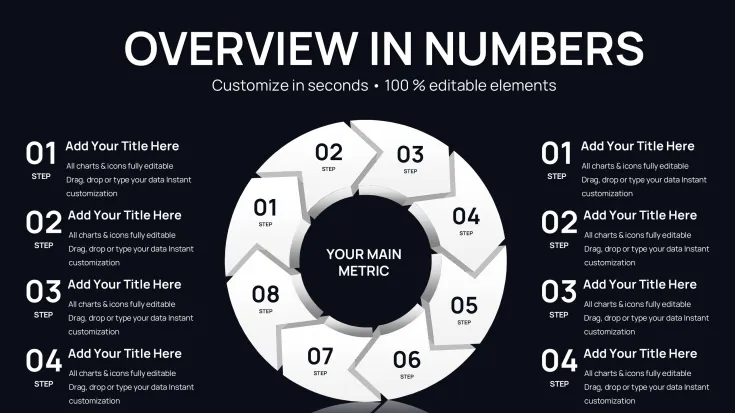
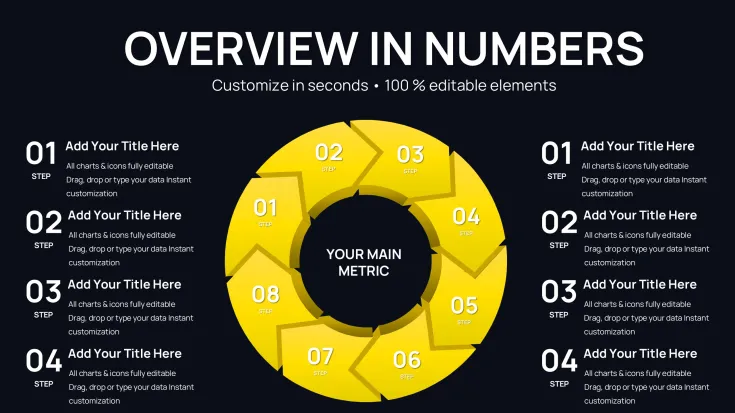
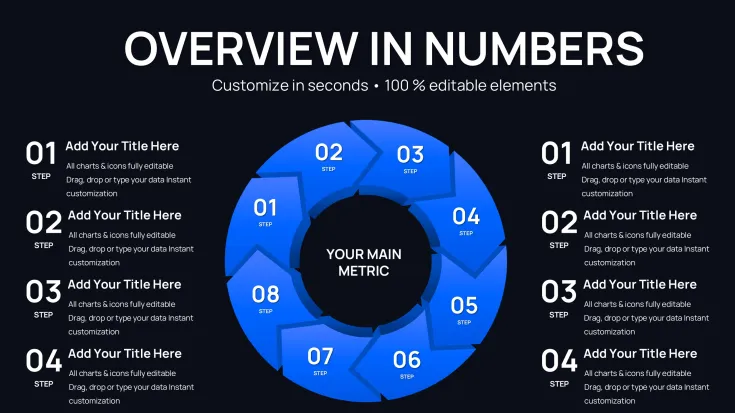
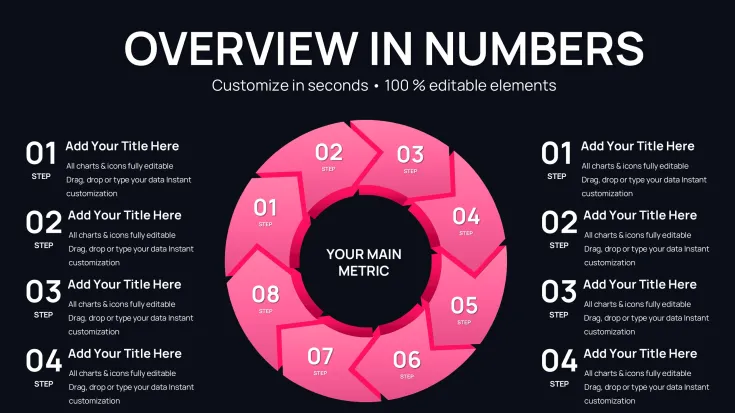
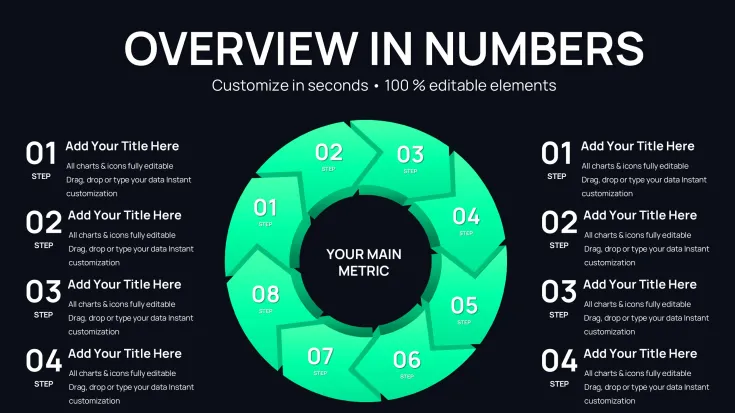
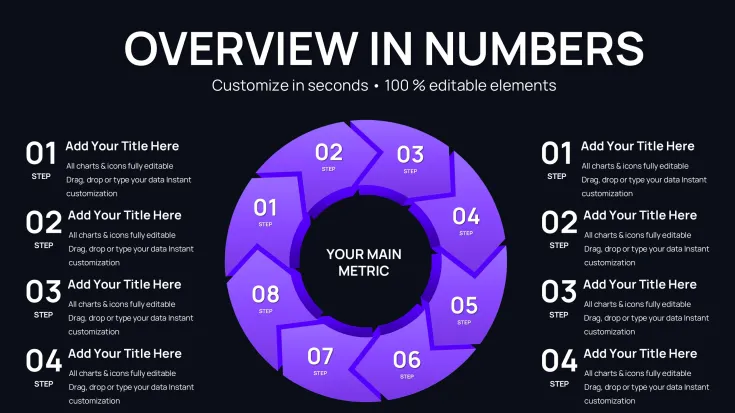
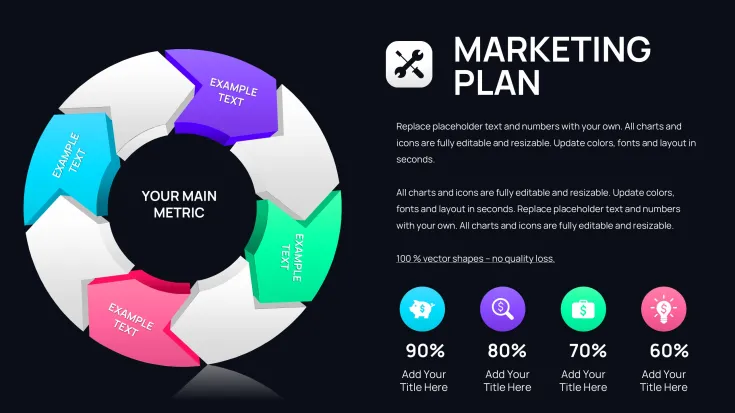
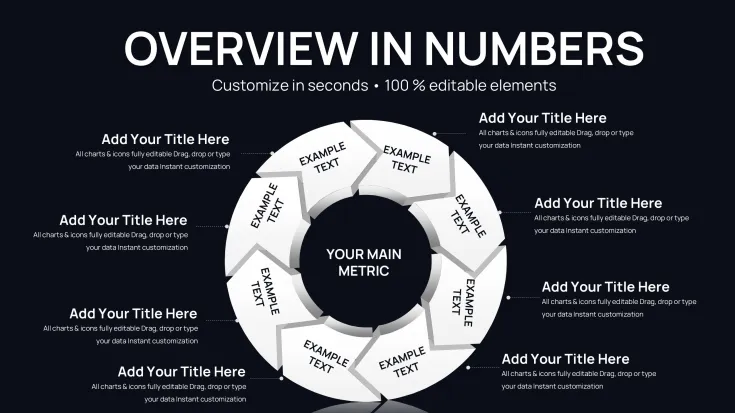
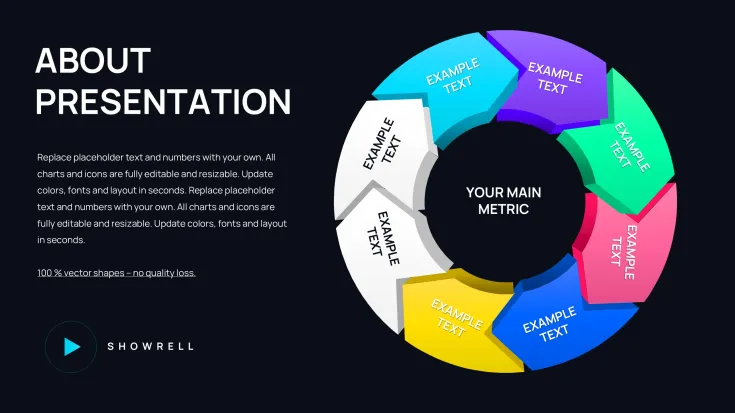
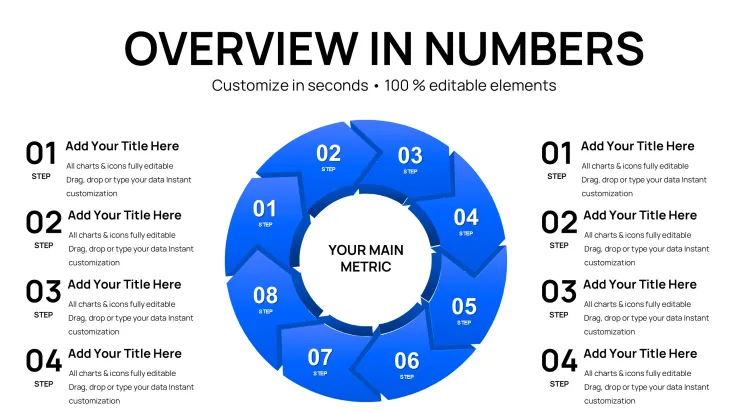
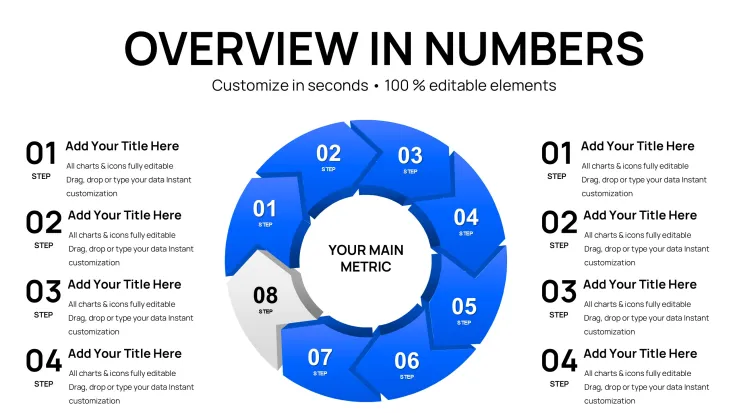
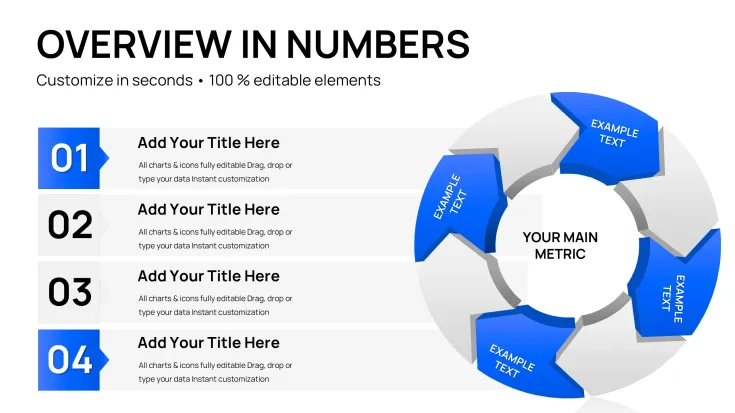
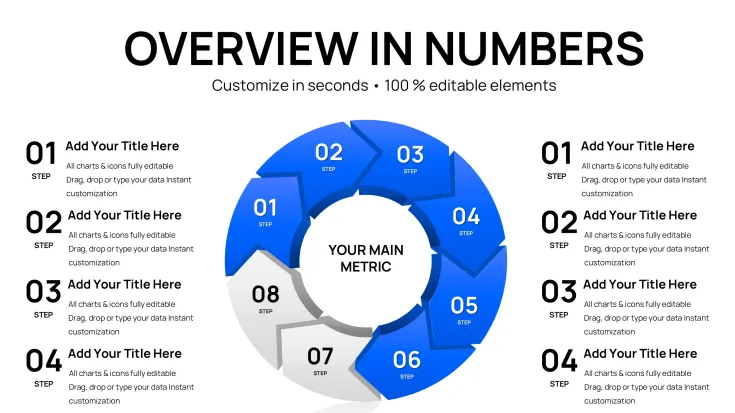
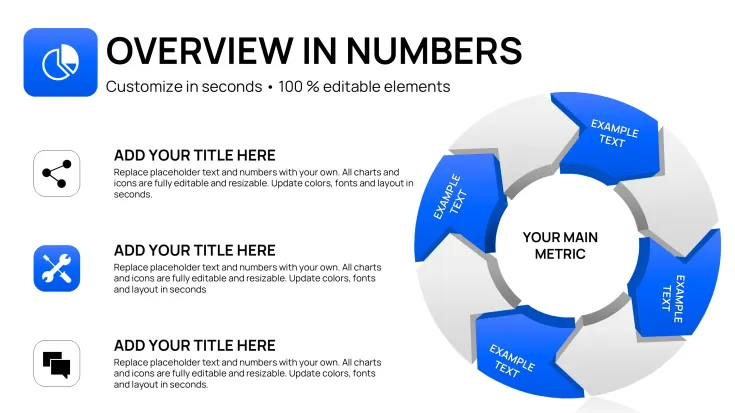
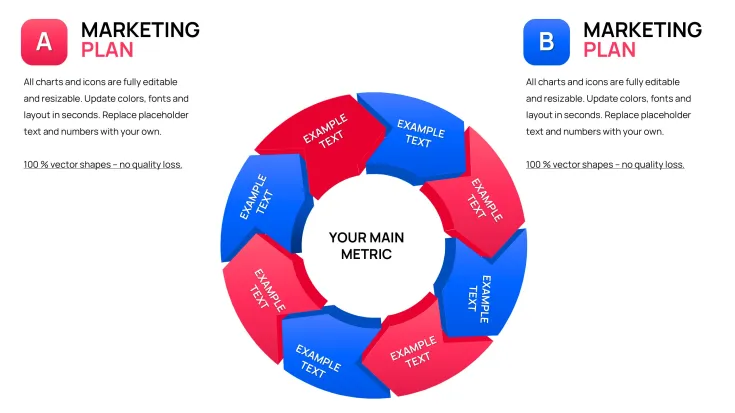
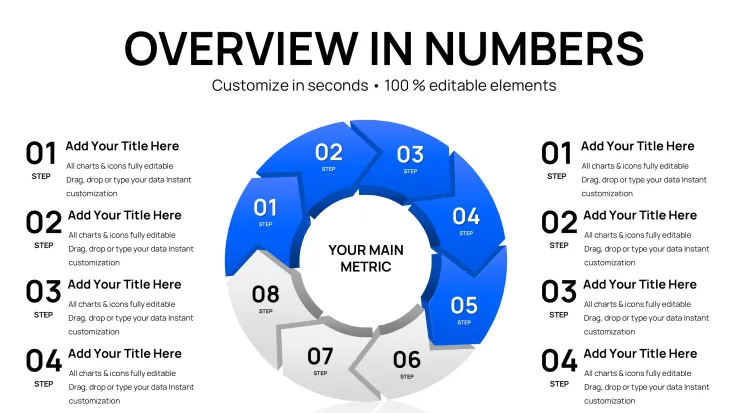
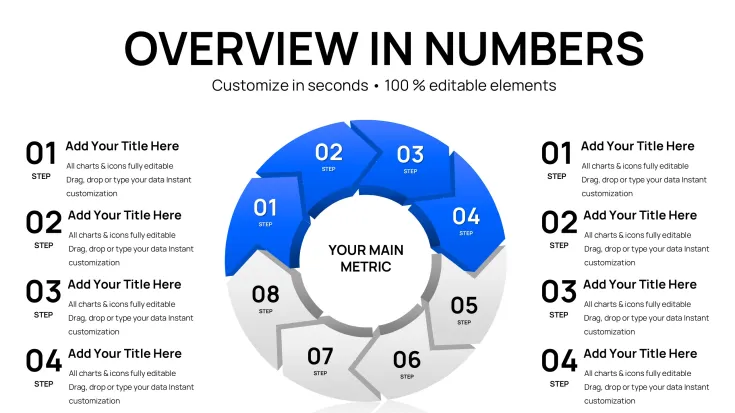
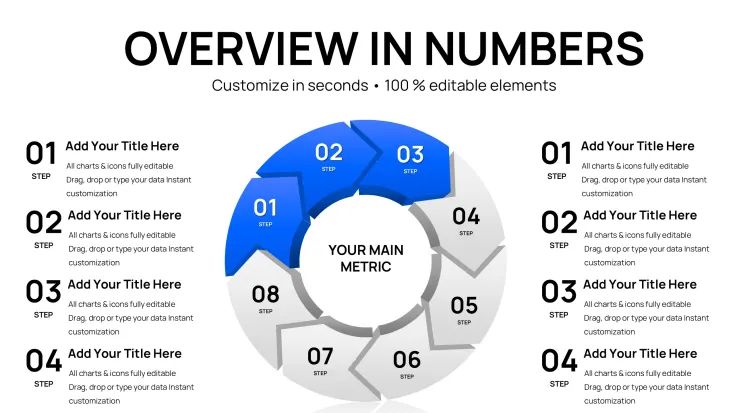
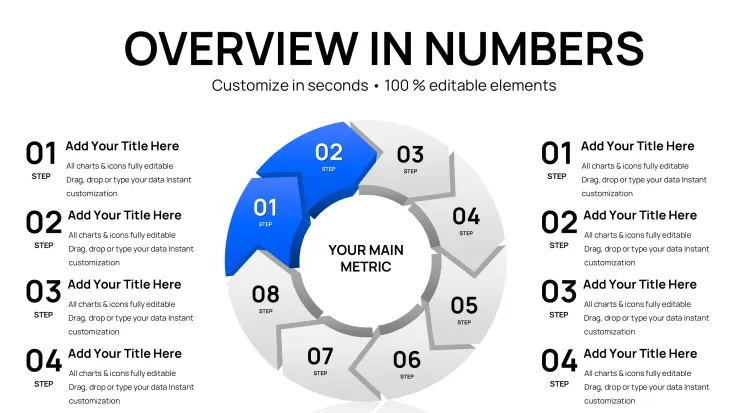
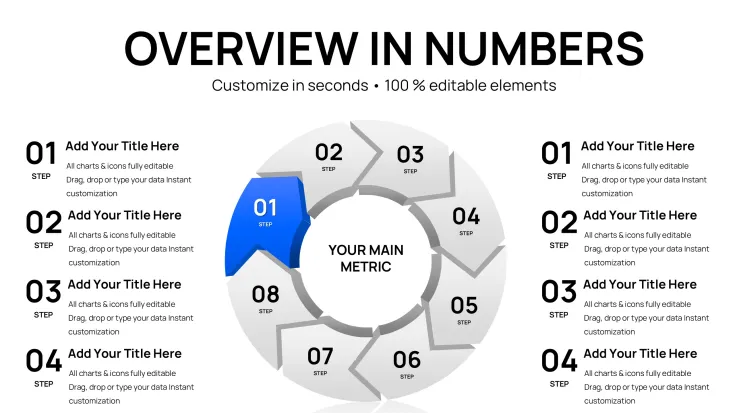
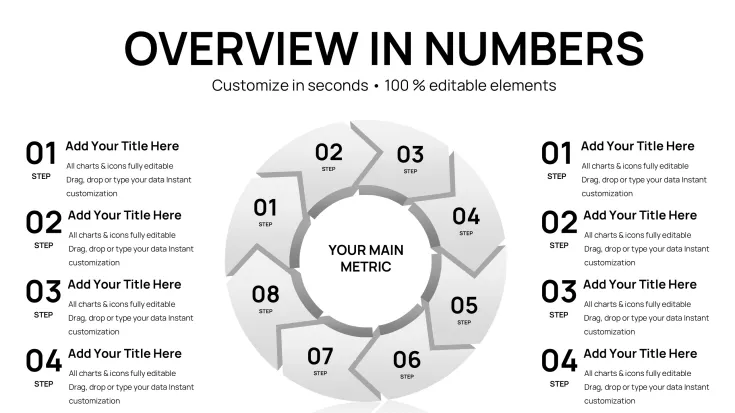
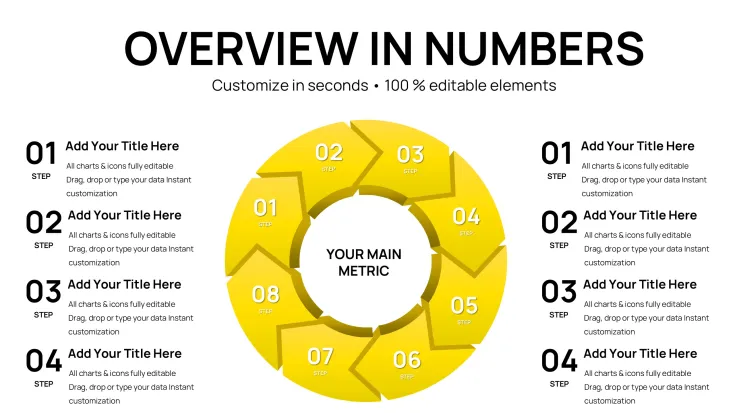
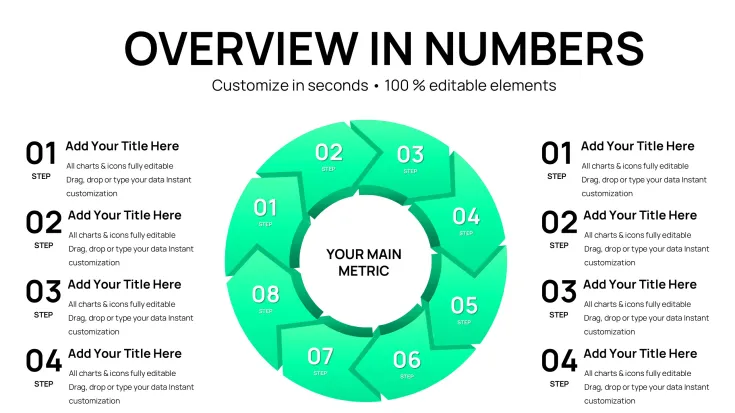
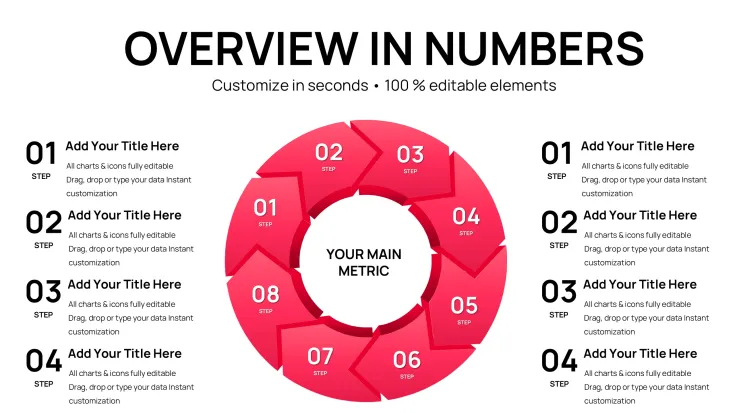
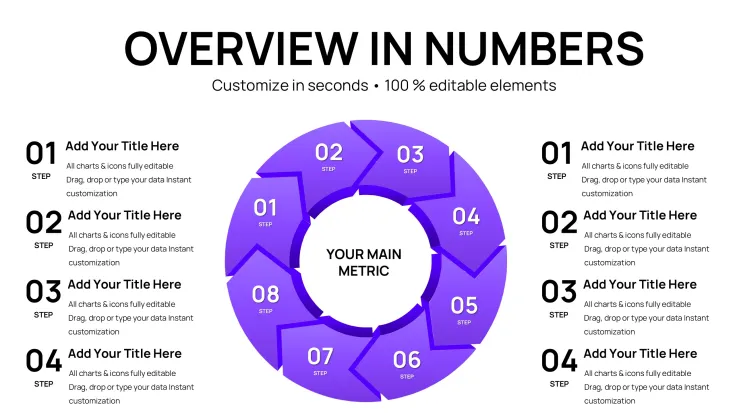
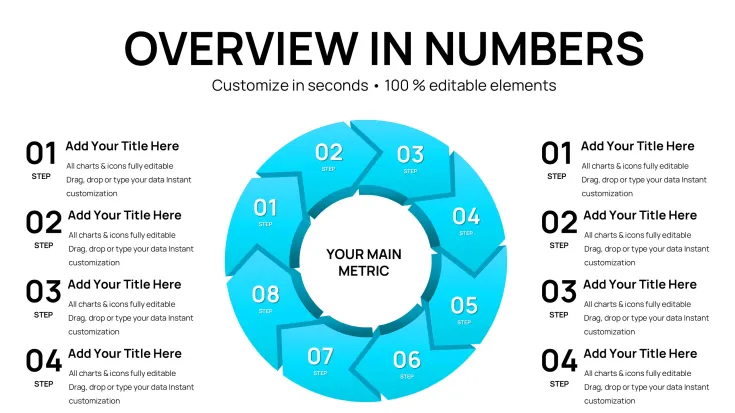
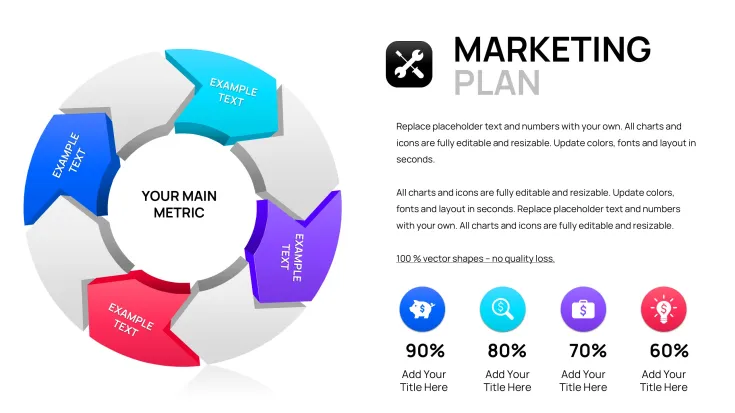
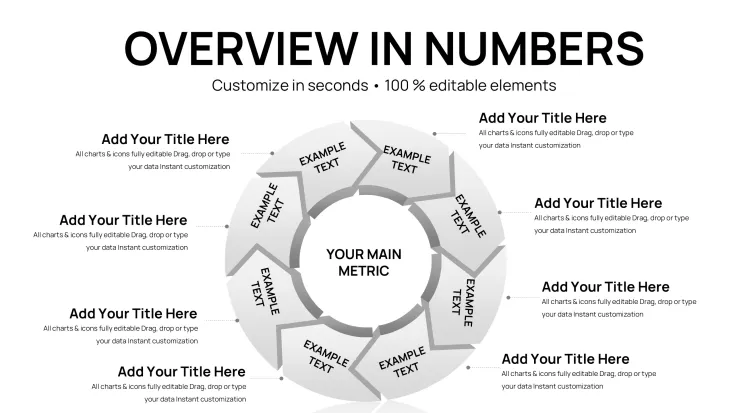
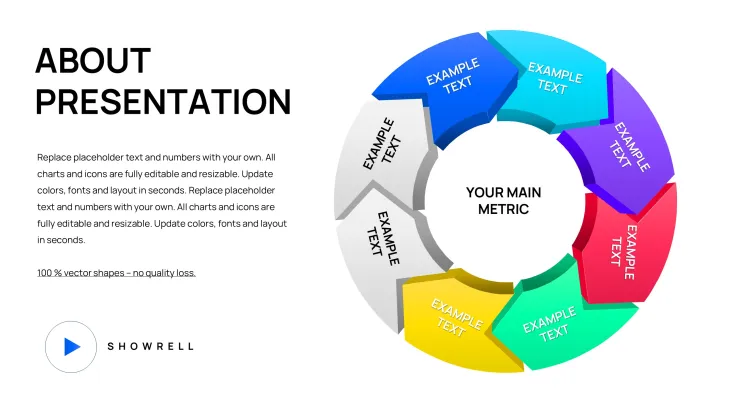
Each slide places volumetric 3D elements into cyclic arrangements so every phase of a repeating process shows both sequence and magnitude at once.
The full set maintains consistent information spacing across variations while the extruded segments create clear visual hierarchy for quarterly reviews and investor decks.
- Cyclic layouts with 3D volume segments
- Multiple stage variations for different cycle lengths
- Ready connectors for flow direction
What is a 3D volume cyclic Keynote chart template? A Keynote file packed with pre-designed slides that use extruded 3D shapes in circular or loop arrangements to illustrate feedback loops seasonal cycles or iterative business workflows.
Unlike flat workflow-focused sets the volume effect here gives visual weight to each stage so higher-impact phases stand out before the audience reads any label.
Editing Capabilities at a Glance
FeatureDetailsEditable shapes3D volume segments resize and recolor independentlyText placeholderslabels update without unlocking grouped elementsColor theme adjustmentscompatible with Keynote slide master paletteDiagram connectorsarrows and lines adjustable in direction and weightIcon layersicons replaceable without affecting layoutExport options.key for editing PDF for distributionSlides / diagrams included40 variations focused on cycle processesReal Scenarios
Three hours before the quarterly review the project manager discovered the existing cycle diagram failed to show volume differences between process stages.
The template provided an immediate 3D volume cyclic chart that the manager customized by adjusting segment heights and labels.
Preparation time dropped from 3 hours to 45 minutes and the file was reused across three client reports by swapping color schemes.
Download and start editing immediately
Adapting the Template to Your Brand
Open the .key file in Keynote 12 or later and spend the first minute reviewing the master slide structure where global color and 3D effects are controlled.
- Step 1 - Open the file in Keynote (1 minute)
- Step 2 - Replace placeholder text and data labels (3 minutes)
- Step 3 - Adjust 3D volume heights for each cycle segment using the format panel (5 minutes)
- Step 4 - Update color theme adjustments through the slide master for brand match (4 minutes)
- Step 5 - Preview connectors and export (2 minutes)
Total time stays under 15 minutes even for moderate skill users.
How to update chart data in this Keynote template? Select the chart slide click into the data table embedded in Keynote enter new values then the 3D volume segments update automatically while preserving cycle layout and depth.
Why This Template, Not a Blank Slide
Replicating 40 3D volume cyclic charts manually demands precise shape extrusion tools and alignment that consume hours and often result in inconsistent flow direction.
- Misaligned 3D shapes
- Inconsistent color contrast
- Broken diagram connectors
Users without advanced design skills typically spend 4 hours per diagram versus minutes here.
The 3D volume extrusion communicates quantitative impact in cycle phases instantly through visual weight before any label is read which matters for strategy meetings.
Download and start editing immediately
Frequently Asked Questions
What Keynote versions does this template support?The template works in Keynote 12 or later on macOS. Earlier versions may not render the 3D volume effects correctly or support all editable shape features. Always update to the latest stable release before opening the .key file to avoid compatibility issues with volumetric elements. Test the file immediately after download to confirm full functionality across your presentation software.
How do I change the color scheme?To change the color scheme open the slide master view then select the background or shape styles to apply global updates across all 40 slides simultaneously. Individual overrides remain possible on any slide without affecting the master. This method saves time compared to editing each chart separately and ensures color contrast stays consistent for data visualization. The change propagates to every cyclic diagram instantly.
What does the license allow for client work?The license permits use in paid client work and internal business presentations without additional fees. You may not resell or redistribute the template files themselves as standalone products. Multiple team members can access the file under the single purchase as long as it stays within one organization. Contact support for enterprise licensing if your team exceeds standard use.
What is the difference between free and paid versions?No free version exists for this 3D volume cyclic Keynote charts template. The paid version at $20 includes the complete set of 40 editable slides and all customization layers. Purchasing grants immediate download access to the full .key file without limitations. This ensures every buyer receives the exact product shown in the preview.
What is the refund policy?Refunds are available within 14 days if the file fails to open in a compatible Keynote version or if technical issues prevent editing the charts. Submit a support ticket with details of the problem encountered. The policy excludes cases where the user simply changes their mind after successful download and use. Full details appear in the terms linked on the purchase confirmation.
How do I update chart data?Chart data updates happen directly inside Keynote by editing the embedded table on each slide. The 3D volume elements recalculate and resize automatically to reflect new values while keeping the cyclic structure intact. No external data import is required for basic changes. This feature supports rapid iteration during live strategy workshops.
How do I export the charts for sharing?Export the finished deck as PDF for distribution or as images for web use directly from Keynote. The template preserves all diagram connectors and visual hierarchy in exported formats. Choose the export settings based on whether the destination is print client proposals or digital board briefings. Animation if present can be removed prior to export to keep file sizes small.
For more cycle options explore the cycle Keynote chart category.
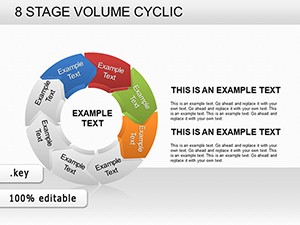
Professionals often combine this set with 8-stage volume cyclic layouts for extended stage coverage.
Or pair it with 3D volume Keynote charts for non-cyclic applications.
Good for
- Project roadmaps and sprint plans
- Product launch timelines
- Quarterly or annual review decks
- Company history and milestone summaries
Licence
reviews
Saved me from manually arranging shapes in Keynote the morning of the presentation and honestly that alone was worth the $14.
The node-and-link structures helped me map business development relationships and the outlined connector lines made dependencies obvious.
Used the radial layouts for a target market analysis and the flat-style design without shadows looked cleaner than my usual builds.
Good for relationship diagrams but not ideal for process flows because these are designed for mapping how entities depend on each other.
The vector shapes resized without quality loss and I could update colors via Keynote's format panel to change all matching styles at once.
FAQ
Will it work in Google Slides?
Are fonts embedded?
Can I use this for client work?
What's the refund policy?
Do you update the template after purchase?
Similar templates
See all Keynote Charts →
All 40 slides