 Click to zoom
3D Curve Graphics Keynote Diagrams - Advanced Visualization
| Format | .pptx |
| Slides | 8 unique layouts |
| Aspect ratio | 16:9 |
| Compatibility | PowerPoint |
| Animated | No |
| Language | English |
| License | Commercial |
| File size | — |
| Version | v1.0 |
| Last updated | February 2026 |
What's inside
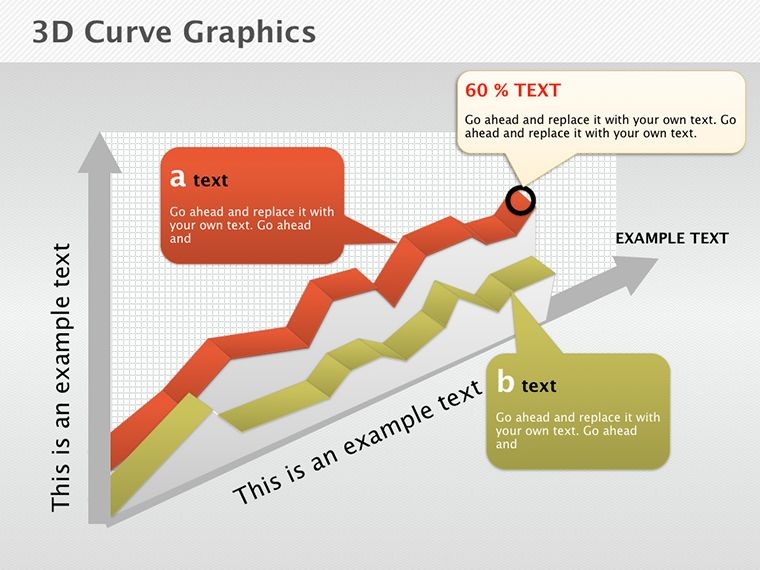
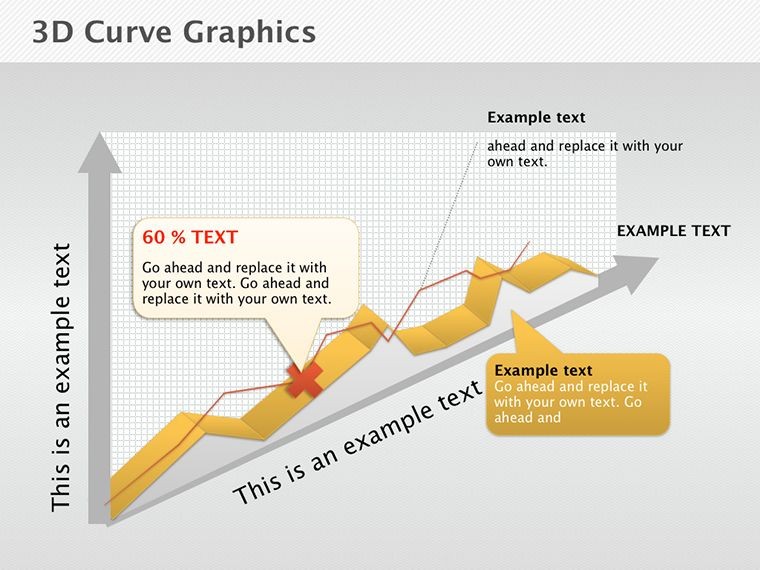
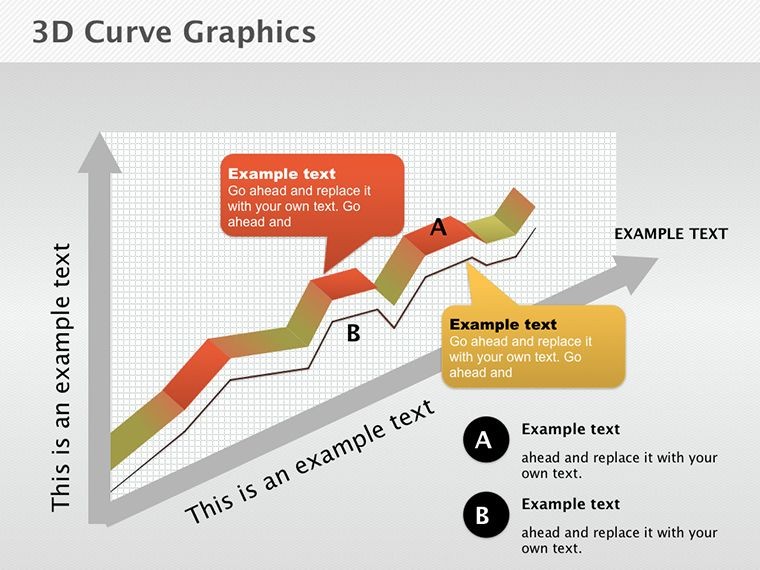
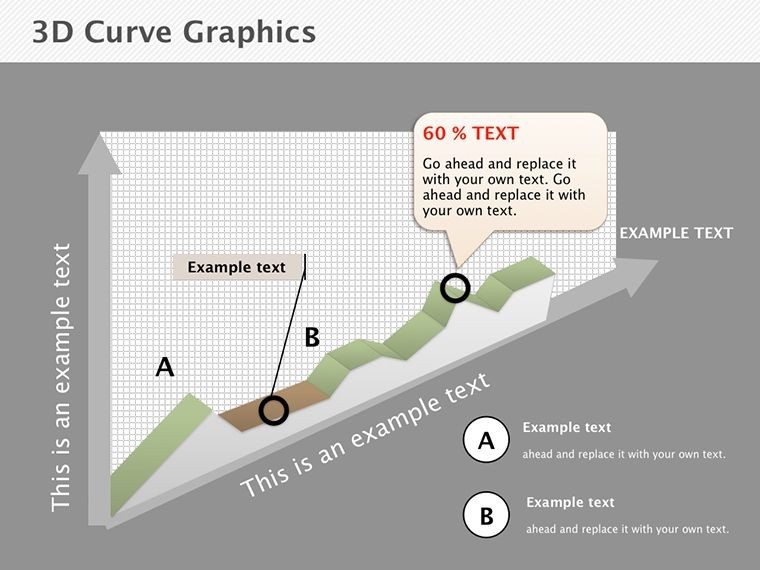
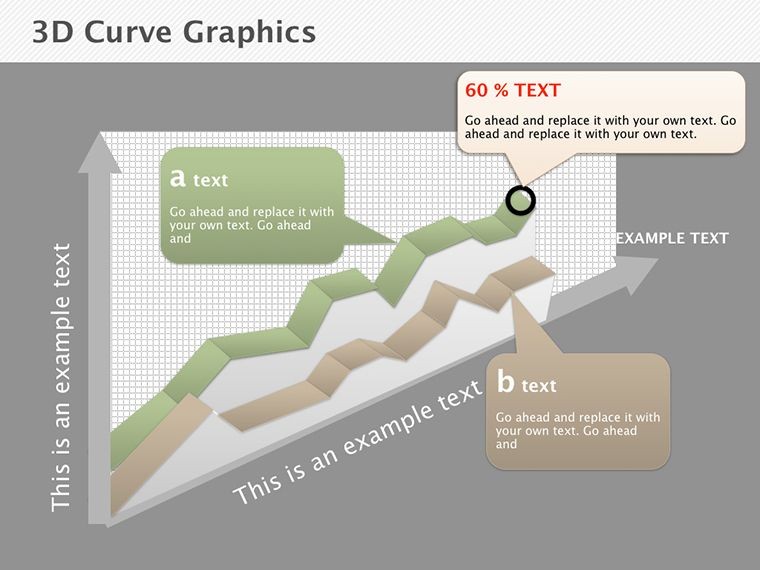
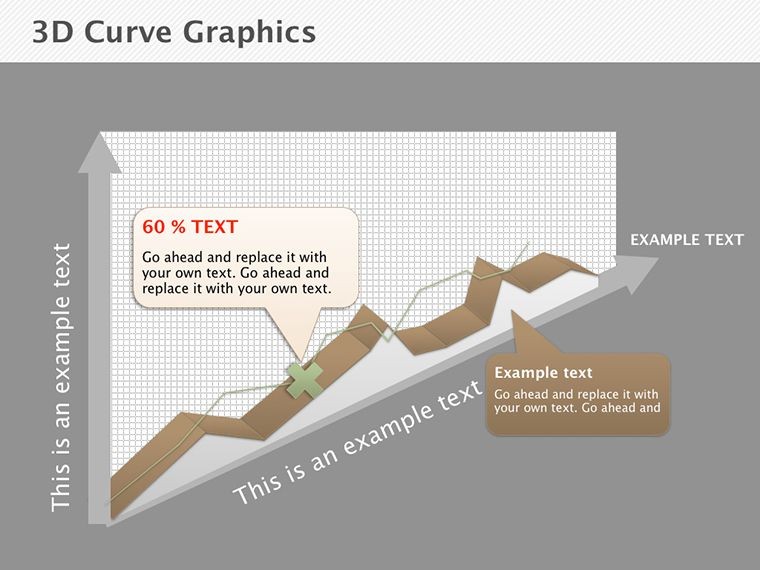
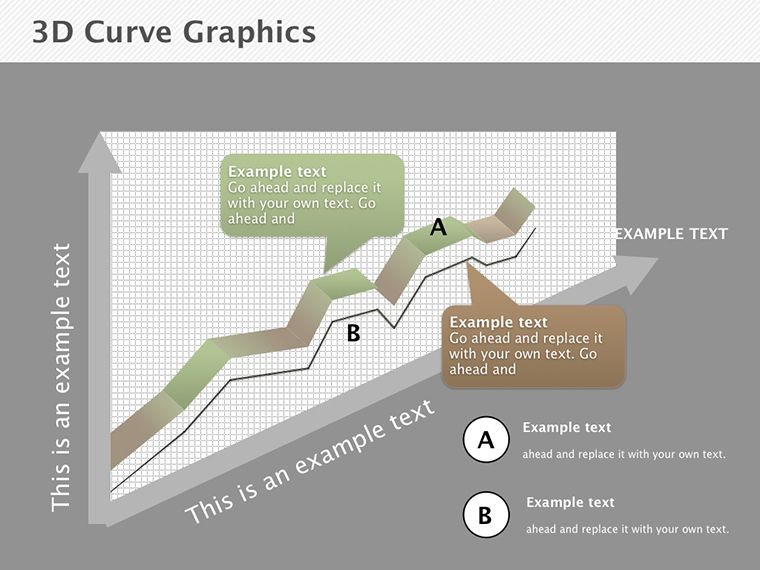
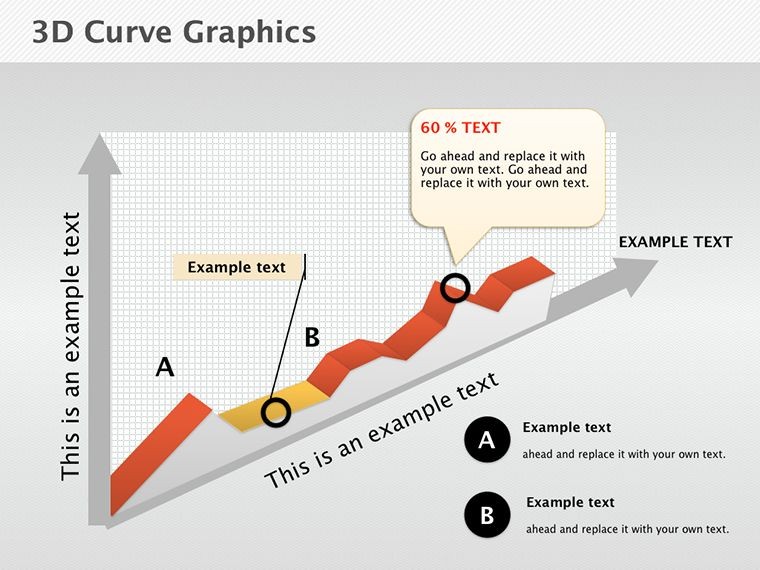
Imagine dissecting complex problems with visuals that pop off the screen, guiding your audience through data curves with ease. Our 3D Curve Graphics Keynote diagrams template is engineered for analysts, managers, and quality experts tackling root causes and resource allocation. With 8 editable slides, it classifies issues into major and minor categories, inspired by Pareto principles for focused action. In .key format, it's primed for Keynote, addressing the frustration of flat graphs by adding depth and dimension. Whether in manufacturing reviews or strategic planning, these diagrams turn data into decisions, leveraging techniques from Six Sigma methodologies to enhance understanding and drive results.
Delving into 3D Curve Dynamics
The core strength lies in its 3D representations, where curves illustrate trends and distributions vividly. Customize axes, colors, and labels to spotlight key insights - perhaps highlighting defect rates in a production line.
Backed by quality management standards like ISO 9001, these graphics facilitate better decision-making, as per studies from the American Society for Quality showing visual tools boost efficiency by 35%.
Core Features for Analytical Excellence
- Dynamic Editability: Reshape curves and data points for precise modeling.
- 3D Depth: Adds perspective to graphs, making patterns more discernible.
- Keynote Seamlessness: Full compatibility for effortless workflows.
- Resolution Integrity: Vectors ensure clarity in any format.
- Efficiency Boost: Pre-designed for quick adaptations in time-sensitive scenarios.
These elevate your analytical presentations.
Applications in Problem Resolution
For quality control, map defect curves to prioritize fixes, akin to Toyota's lean approaches. In finance, visualize risk distributions for informed investments.
An example: A tech startup used similar 3D curves to analyze user feedback, streamlining product updates and increasing satisfaction by 30%.
It solves vague data interpretations with clear, actionable visuals.
Steps to Harness 3D Curves
- Load the File: Import .key into Keynote.
- Data Integration: Input your metrics and adjust curves.
- Visual Refinement: Tweak angles for optimal 3D views.
- Narrative Building: Sequence slides for logical progression.
- Delivery Prep: Animate for engaging reveals.
This ensures impactful analyses.
Expert Strategies for Curve Graphics
Adopt tips from data viz gurus like Edward Tufte: Minimize ink for maximum insight. Use gradients for depth cues, enhancing perception.
Outperforms basic charts by providing multidimensional views, reducing misreads.
Innovate Your Analyses Today
Step up your game with these diagrams. Download and curve your way to success!
Frequently Asked Questions
Can I import Excel data?Yes, copy-paste into Keynote for curve generation.Supports 3D rotations?Absolutely, rotate views for different perspectives.Ideal for which industries?Manufacturing, finance, tech - any data-driven field.File size concerns?Compact .key keeps it lightweight.Team collaboration?Share via iCloud for joint edits.Export options?To PDF, images, or video for versatility.Good for
- Project roadmaps and sprint plans
- Product launch timelines
- Quarterly or annual review decks
- Company history and milestone summaries
Licence
reviews
Needed simple diagrams for a university report and this worked.
The flowchart sections saved me a lot of time.
Colors were okay but I changed most of them.
A few icons felt outdated.
Pretty practical if you need visual explanations quickly.
FAQ
Will it work in Google Slides?
Are fonts embedded?
Can I use this for client work?
What's the refund policy?
Do you update the template after purchase?
Similar templates
See all Keynote Diagrams →
All 8 slides