 Click to zoom
Web Testing PowerPoint Diagrams Template
| Format | .pptx |
| Slides | 13 unique layouts |
| Aspect ratio | 16:9 |
| Compatibility | PowerPoint |
| Animated | No |
| Language | English |
| License | Commercial |
| File size | — |
| Version | v1.0 |
| Last updated | September 2023 |
What's inside
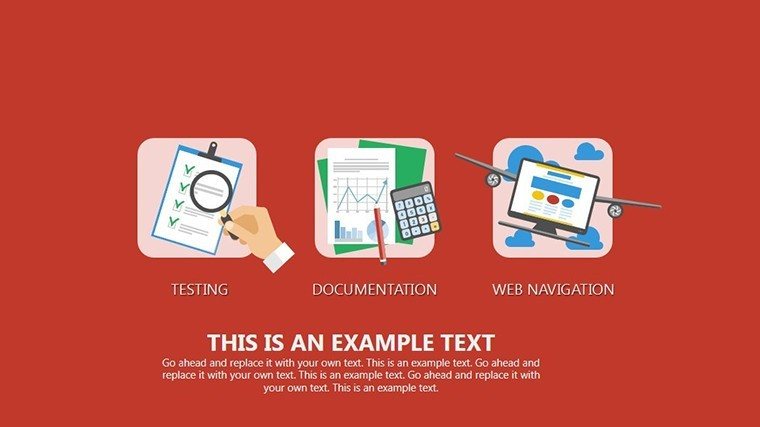
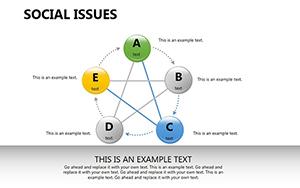
When it comes to demystifying the intricacies of web application testing, nothing beats a well-structured visual aid. Our Testing Web PowerPoint diagrams template is engineered for QA engineers, developers, and tech trainers who face the challenge of explaining testing methodologies without overwhelming their audience. With 13 editable slides, it bridges the gap between classic design tests and modern web interfaces, making complex processes accessible.
Rooted in industry standards like those from ISTQB (International Software Testing Qualifications Board), this template draws on proven techniques to illustrate browser interactions and skill-agnostic interfaces. Fully compatible with PowerPoint across Windows and Mac, it offers hassle-free edits, ensuring your presentations are as reliable as the tests they describe.
Key Diagram Features for Tech Clarity
Each slide is purpose-built: Slide 1's overview flowchart maps the entire testing lifecycle, from requirements to deployment. Themed in tech-friendly grays and blues, but fully adjustable, these diagrams surpass standard PowerPoint tools with specialized elements like error branching and user flow paths.
Benefits include clearer communication; as per Gartner reports, visual testing overviews can reduce misunderstanding in teams by 40%. For a software firm, Slide 6's interface diagram can highlight common pitfalls in web apps, tackling issues like usability testing head-on.
Core Components Highlighted
- Flowcharts: Detail step-by-step testing sequences.
- Interface Maps: Visualize browser elements and interactions.
- Error Trees: Branching diagrams for failure scenarios.
- Compatibility Grids: Checklists for cross-browser testing.
- Performance Metrics: Charts for load times and response data.
These are informed by agile methodologies, positioning your content as expert-level and trustworthy.
Application Scenarios in Software Testing
For training sessions, Slide 9's technique comparison diagram contrasts manual vs. automated testing. In project reviews, Slide 12's timeline tracks bug fixes over sprints.
Integration steps: Load the .pptx, customize Slide 4's path diagram with your test cases, add shapes for annotations. This resolves convoluted explanations, fostering better team alignment. Superior to basics, it includes vector precision for sharp visuals.
Case in point: Teams at companies like Google use analogous diagrams to streamline QA, leading to faster releases.
Practical Tips for Tech Presenters
- Focus on simplicity: Avoid clutter by using one key diagram per concept.
- Animate sequences: Reveal test steps progressively for emphasis.
- Include legends: Clarify symbols for non-expert viewers.
- Cross-reference: Link to external tools like Selenium in notes.
- Version control: Save iterations for collaborative reviews.
Derived from tech conference best practices, these enhance delivery effectiveness.
Master Web Testing Visuals – Download Today
Equip yourself with diagrams that make testing tangible and actionable. Grab this template now and elevate your tech discourse.
Frequently Asked Questions
How editable are the testing diagrams?100% – modify shapes, colors, and layouts freely.Compatible with which PowerPoint versions?2013 and newer, including Office 365.Can I use for automated testing visuals?Yes, dedicated slides for script flows.What if I'm not a designer?User-friendly; no advanced skills needed.Are there sample data included?Placeholders with examples for quick starts.Support for export?Easily to PDF or images.Good for
- Project roadmaps and sprint plans
- Product launch timelines
- Quarterly or annual review decks
- Company history and milestone summaries
Licence
reviews
The process charts made my training deck look more organized.
I don’t care much about design stuff but the slides were easy to edit.
Used this for an operations review and the arrows actually helped explain delays.
Some elements were oversized but resizing them was easy enough.
Honestly just needed something quick before a meeting and this worked.
FAQ
Will it work in Google Slides?
Are fonts embedded?
Can I use this for client work?
What's the refund policy?
Do you update the template after purchase?
Similar templates
See all Powerpoint Diagrams →
All 13 slides