 Click to zoom
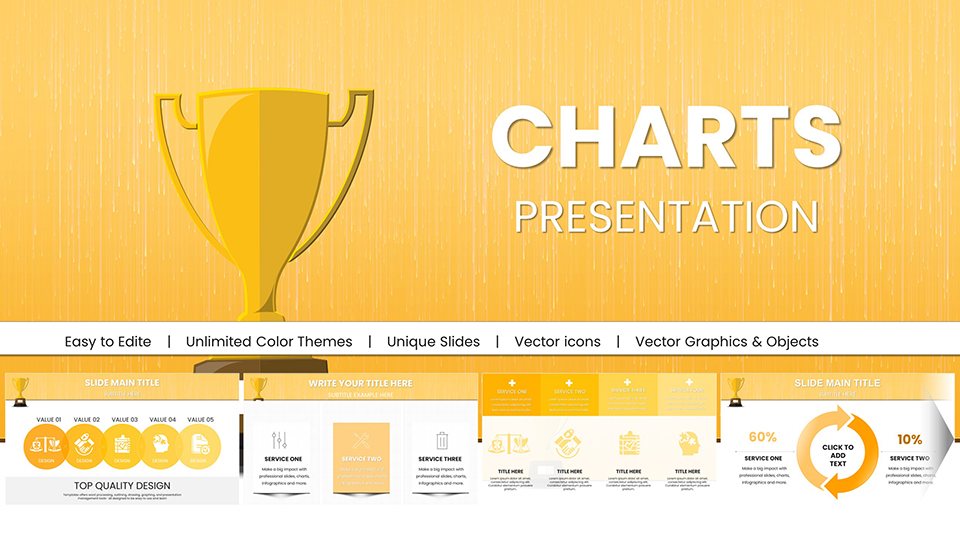
Victory Cup PowerPoint Charts: Sales & Success Template
| Format | .pptx |
| Slides | 57 unique layouts |
| Aspect ratio | 16:9 |
| Compatibility | PowerPoint |
| Animated | No |
| Language | English |
| License | Commercial |
| File size | — |
| Version | v1.0 |
| Last updated | January 2026 |
What's inside
Visualize Success and Drive Performance
In high-stakes environments - whether it is a quarterly sales kickoff or an executive board review - how you present success matters as much as the numbers themselves. You need to foster a culture of achievement without looking childish or overly "gamified." The Victory Cup PowerPoint Charts template is designed to bridge that gap. It solves the problem of dry performance reporting by injecting energy and prestige into your data.
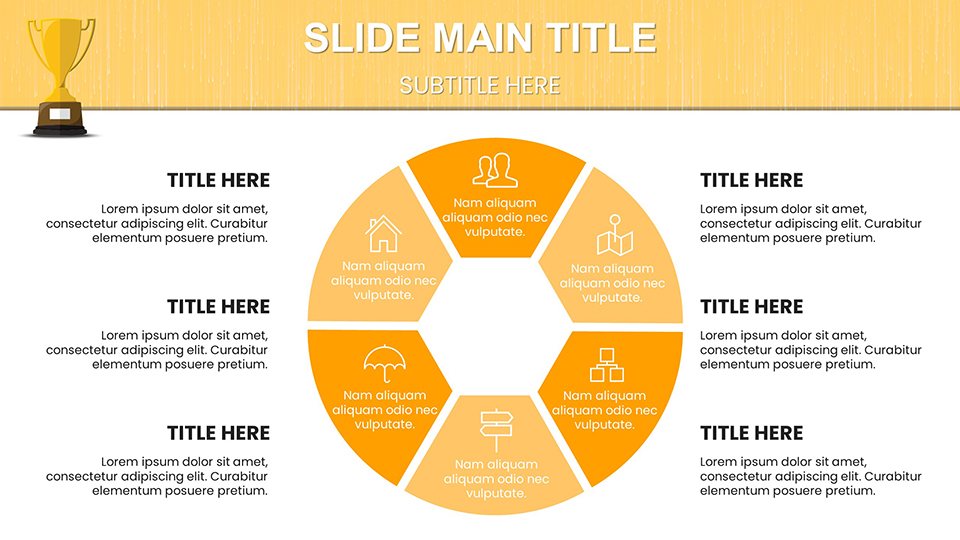
This is not about putting a gold star on a slide; it is about visually structuring a narrative of dominance and growth. Your audience - sales teams, investors, or competitive stakeholders - wants to know who is leading, what the benchmark is, and how close they are to the goal. These 57 slides answer those questions instantly with visual metaphors of cups, podiums, and race tracks that professionalize the concept of "winning."
Features That Command Attention
Forget standard bar charts that blend into the background. This template utilizes metaphorical data visualization to create emotional impact.
- Leaderboard Visuals: Podium graphics that clearly rank top performers, regions, or products.
- Progress Trackers: "Race to the finish" line graphs that show exactly where you stand against quotas or competitors.
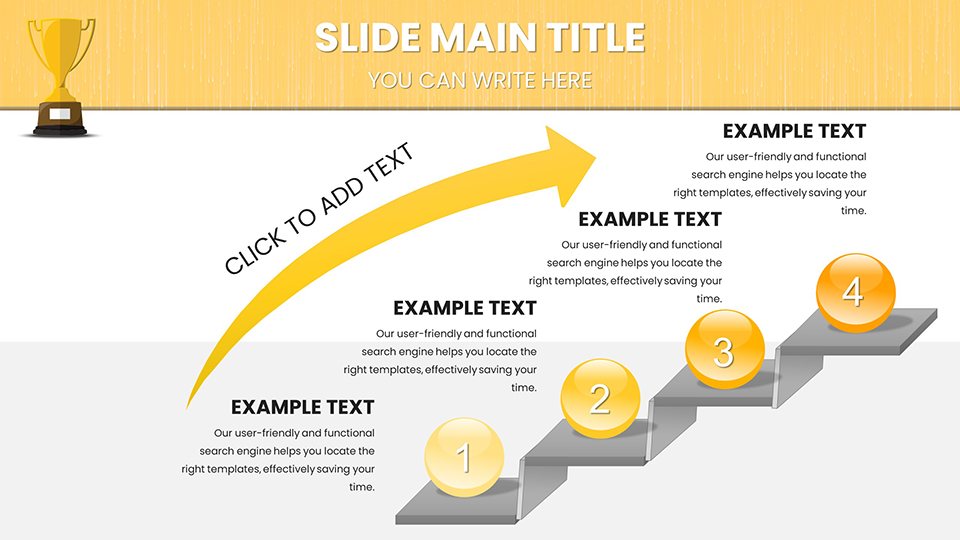
- Trophy Iconography: Editable vector cups that can be resized and recolored to align with your specific award categories (e.g., Gold, Silver, Bronze tiers).
Professional Use Cases
Sales Incentive Programs
Use the podium charts to announce President’s Club winners or monthly top performers. The visual recognition of a trophy graphic often carries more weight than a simple name on a list, driving competitive motivation for the next quarter.
Market Share Dominance
When pitching to investors, use the "Victory Cup" visualization to represent your brand's position relative to competitors. It sends a subliminal message of established leadership and quality that a standard pie chart cannot convey.
Project Milestones
For project managers, use the track-style graphs to celebrate the completion of major phases. It reinforces the team's momentum and visually "awards" the department for hitting a deadline.
Workflow Integration
These slides are fully integrated into the PowerPoint ecosystem. You can drag and drop your corporate logo onto the trophy cups or change the "gold" color to your specific brand hex code. The text placeholders are pre-formatted for impactful statements, ensuring your "Record Breaking Year" headline stands out. You do not need a designer to make these changes; the elements are grouped for easy manipulation by any intermediate PowerPoint user.
Real-World Example: The Quarterly Business Review (QBR)
Imagine you are presenting Q3 results where your team exceeded targets by 150%. Instead of a spreadsheet, you open with Slide #1 (The Main Victory Cup) containing the "150%" figure inside the trophy. You then transition to Slide #4, a podium chart showing the top three contributing regions. This framing transforms a standard report into a celebration of strategy and execution.
Internal Comparison: When to Use This Template
FeatureVictory Cup Charts (This Template)Standard Data ChartsPrimary GoalMotivation, Recognition, RankingInformation Transfer, AnalysisBest AudienceSales Teams, All-Hands MeetingsFinancial Auditors, ComplianceEmotional ImpactHigh (Excitement, Pride)Neutral (Clarity)Industry Applications
While perfect for sales organizations, this template is also widely used in education for student ranking, HR for employee tenure recognition, and sports management for statistical breakdowns. Any scenario where ranking and reward are central to the message will benefit from this layout.
Don't let your wins fade into the background. Start editing your victory slides today and give your success the spotlight it deserves.
Good for
- Project roadmaps and sprint plans
- Product launch timelines
- Quarterly or annual review decks
- Company history and milestone summaries
Licence
reviews
Victory Cup charts turned our QBR into a motivational event with podium graphics ranking regions. Trophy icons are editable and look premium in gold/silver/bronze. Sales team loved the energy it added to performance data.
Used for a sales incentive meeting. The race track progress trackers clearly showed quota achievements. Fun without being childish, but some leaderboard slides needed extra text adjustments. Good value.
The metaphorical visuals with cups and podiums boosted team morale in our all-hands. Clean integration with corporate colors. As a manager under pressure, it cut my prep time significantly.
Practical for project milestones with track-style graphs. The 57 slides feel professional. Slightly gamified for executive audiences, but effective for recognition.
Student using it for a group presentation on market leadership. The victory cup main slide with big percentages was a hit. Simple to customize.
Reviewed quarterly results with the template. Emotional impact from trophy visuals is strong, though some animations felt over-the-top for conservative clients.
FAQ
Will it work in Google Slides?
Are fonts embedded?
Can I use this for client work?
What's the refund policy?
Do you update the template after purchase?
Similar templates
See all PowerPoint Charts →
All 57 slides