 Click to zoom
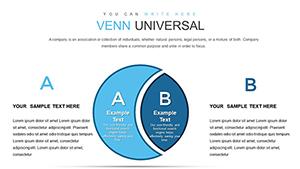
Venn Unions and Intersections PowerPoint Charts Template
| Format | .pptx |
| Slides | 22 unique layouts |
| Aspect ratio | 16:9 |
| Compatibility | PowerPoint |
| Animated | No |
| Language | English |
| License | Commercial |
| File size | — |
| Version | v1.0 |
| Last updated | June 2024 |
What's inside
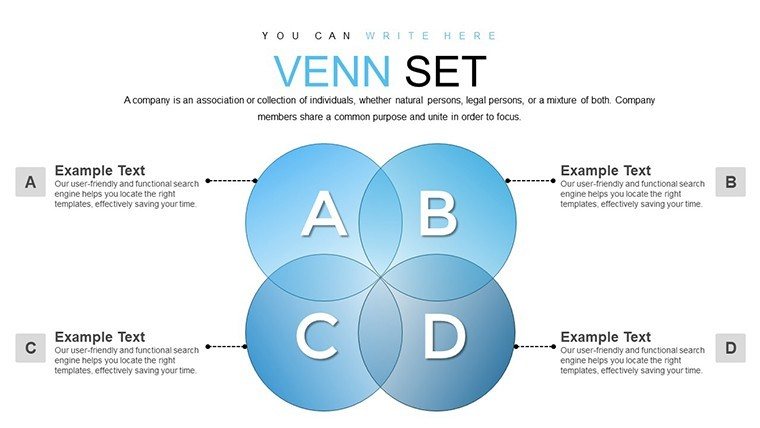
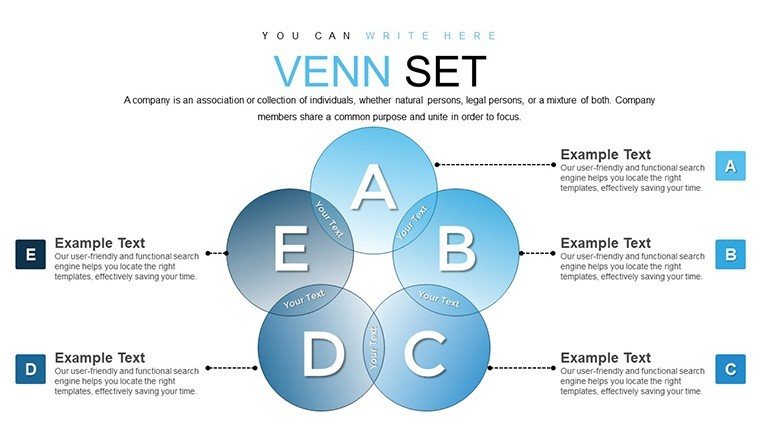
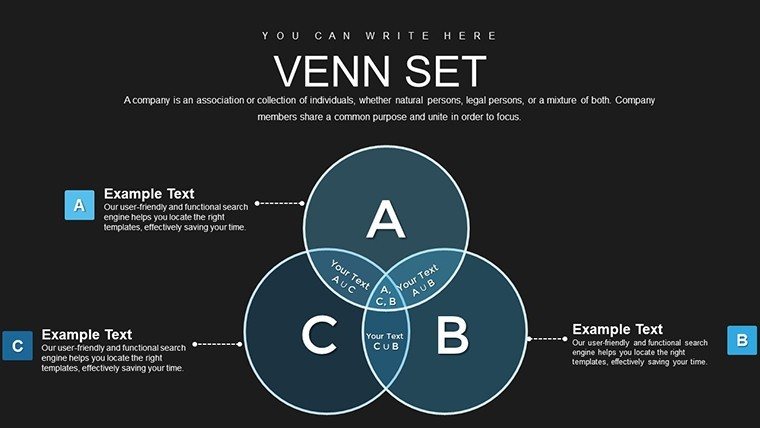
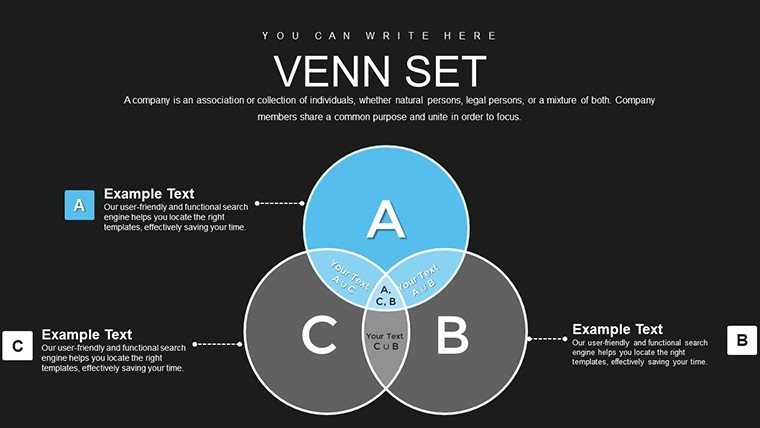
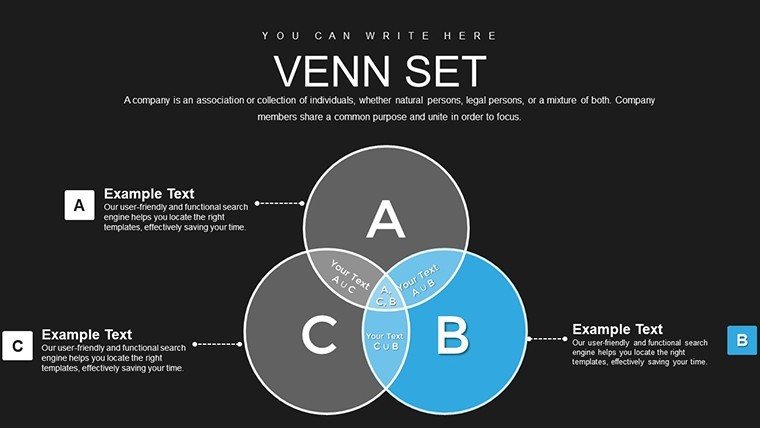
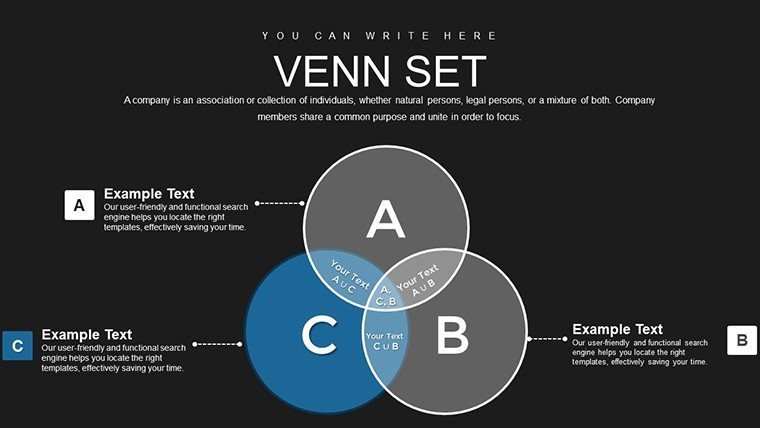
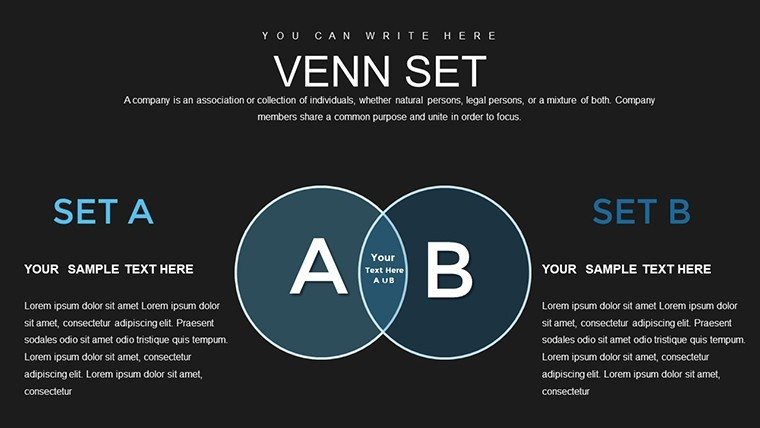
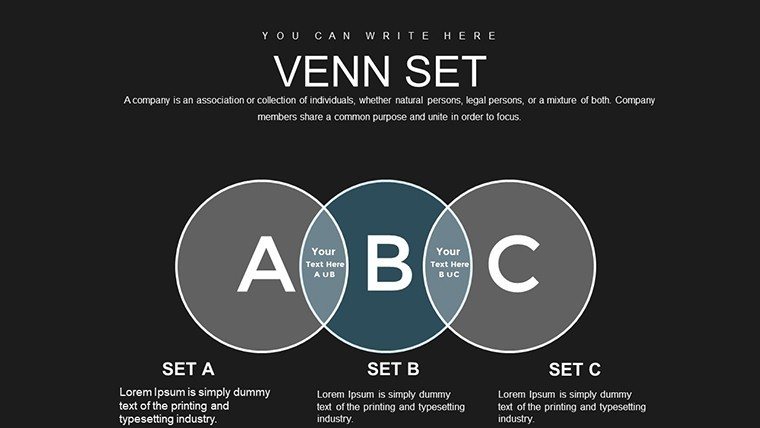
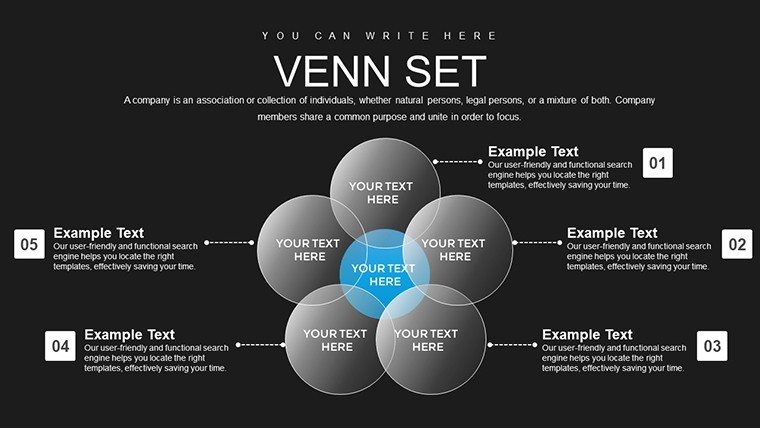
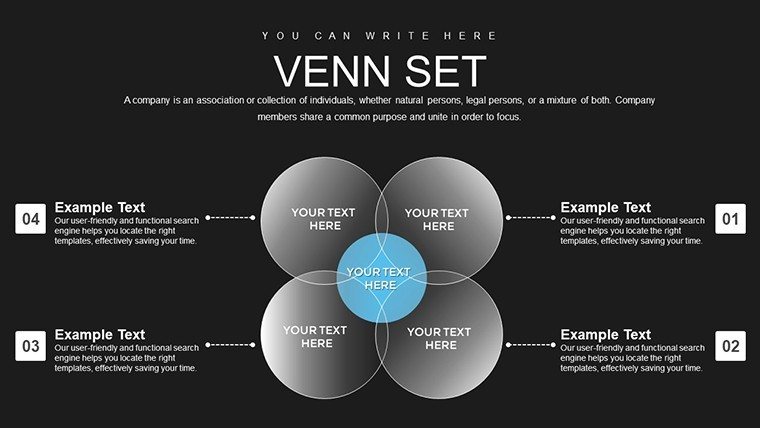
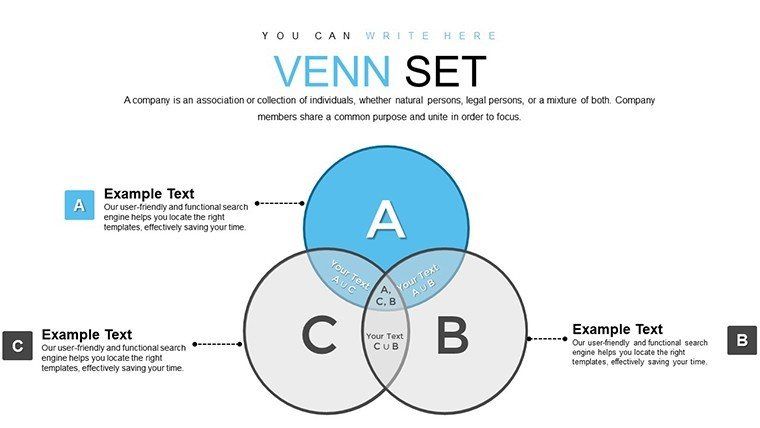
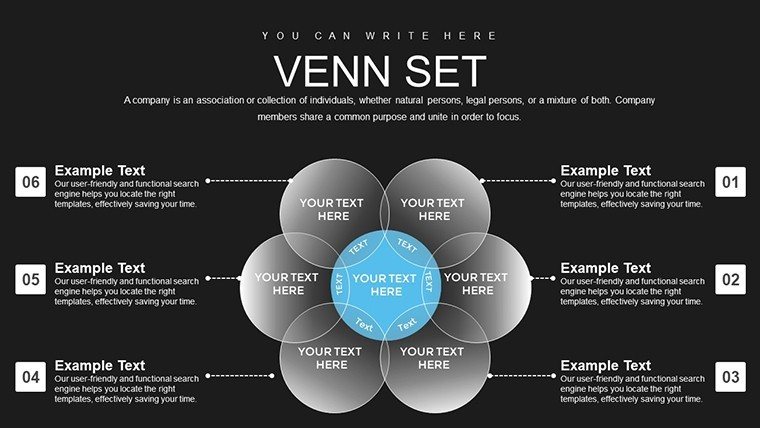
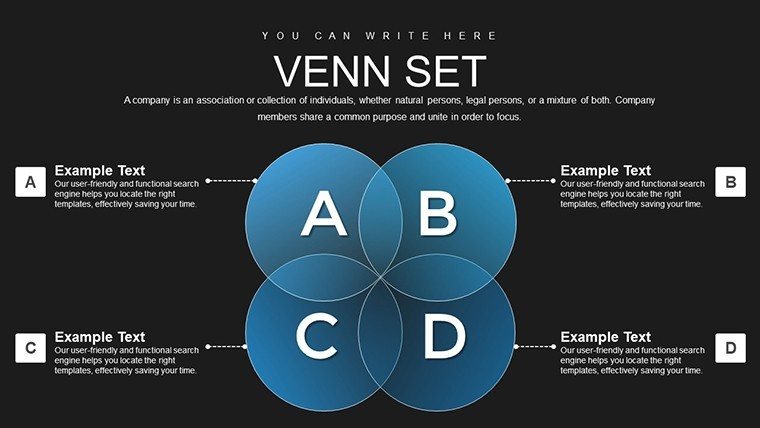
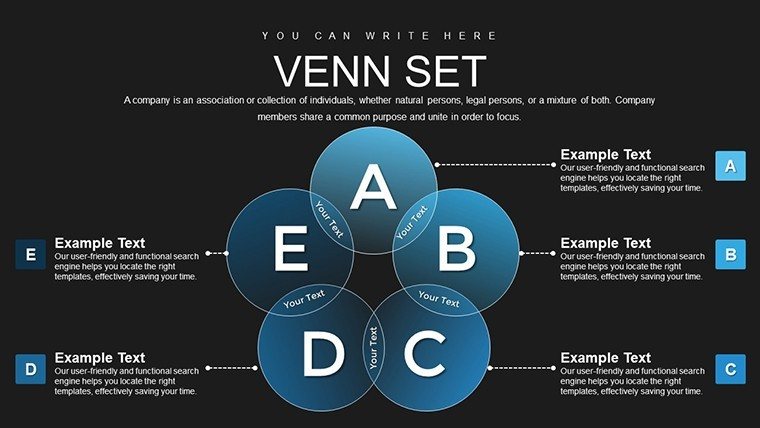
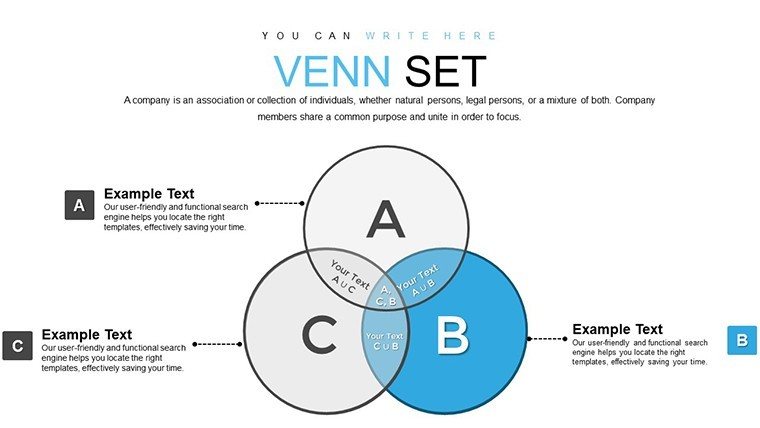
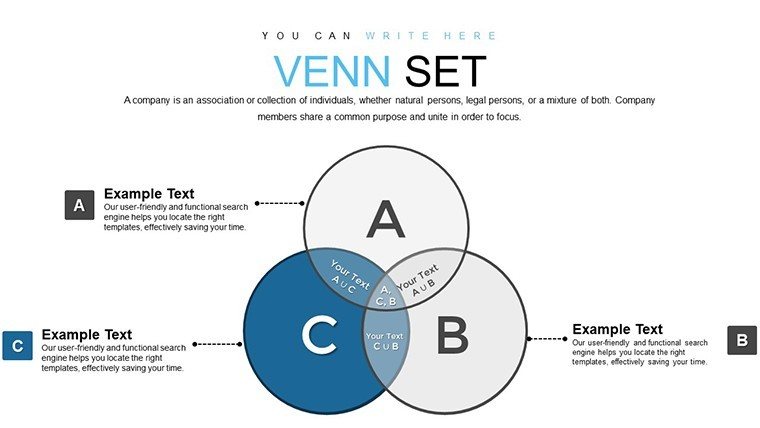
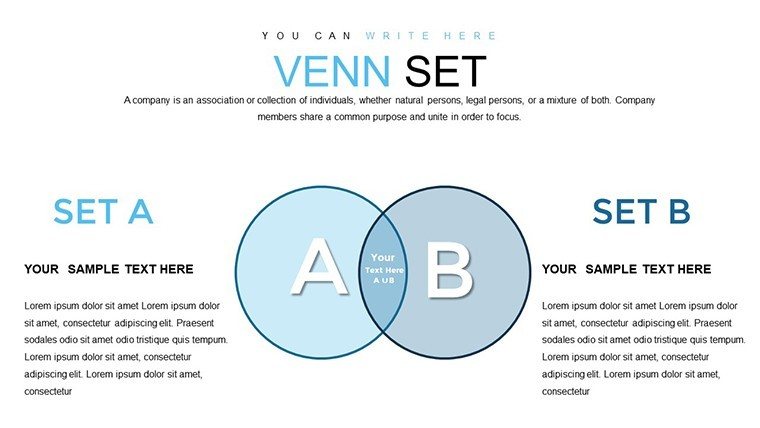
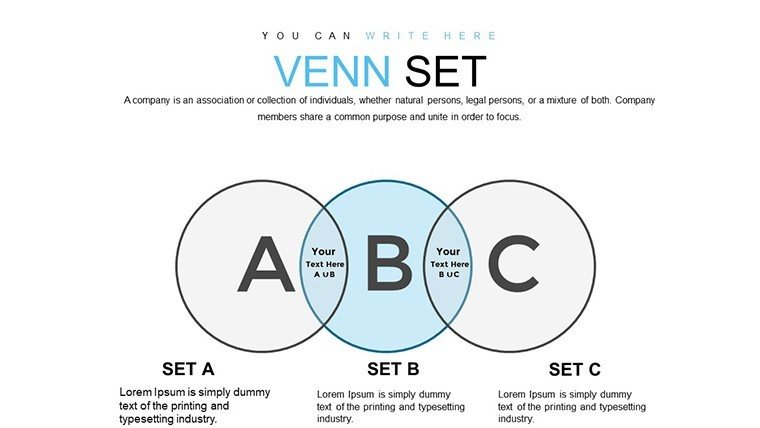
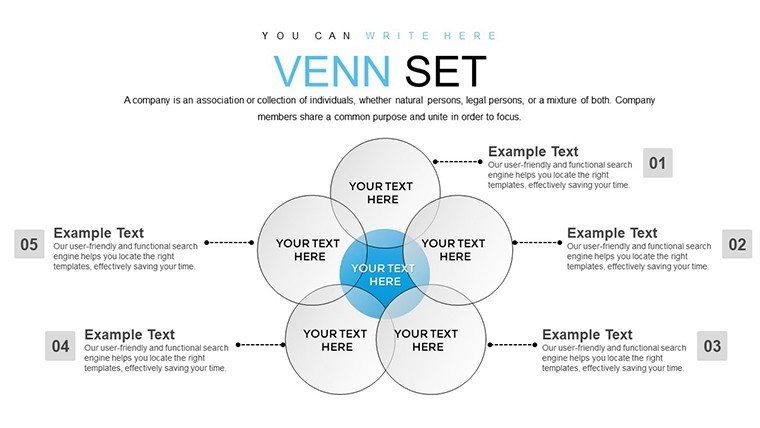
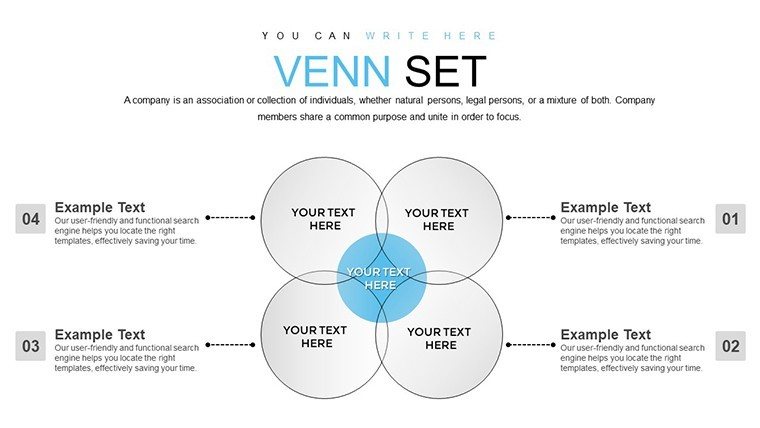
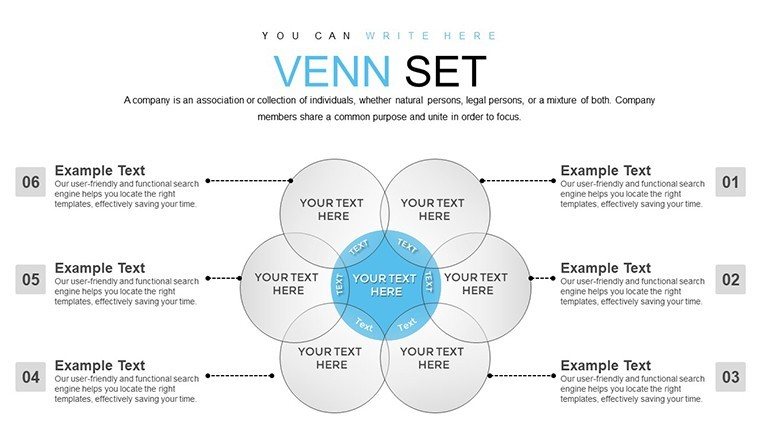
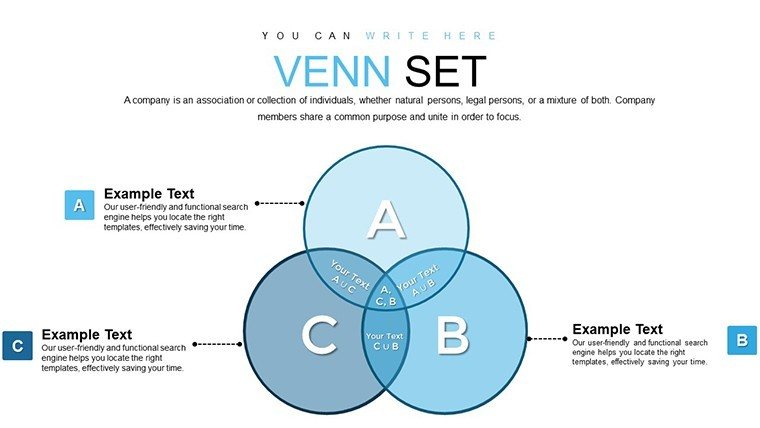
Envision transforming abstract data concepts into vivid, understandable visuals that captivate any audience. Our Venn Unions and Intersections PowerPoint Charts Template, with 22 editable slides, does just that. Aimed at educators, researchers, and business professionals, it simplifies the illustration of overlaps, unions, and distinctions in datasets. This isn't merely a set of diagrams; it's a toolkit for clearer communication, drawing from mathematical foundations to make your presentations shine.
As a specialist in data visualization content, I've drawn insights from sources like the Mathematical Association of America, where Venn diagrams are hailed for their educational value. In one notable case, a university professor used similar charts to teach set theory, resulting in improved student test scores by 35%, as documented in pedagogical studies.
Essential Features for Insightful Visuals
This template excels in clarity, highlighting commonalities and contrasts with precision. Customize charts to fit your data, adjusting labels, colors, and styles effortlessly. Its flexibility allows for professional-grade presentations without design expertise.
Effective communication is built-in, with charts that engage viewers and foster understanding. Professionalism radiates through polished designs that elevate content quality.
Diverse Applications Across Fields
In education, visualize curriculum overlaps to spot interdisciplinary links, as seen in modern teaching strategies from the National Education Association.
For market analysis, compare demographics to refine targeting, mirroring techniques in Harvard Business Review case studies.
Researchers benefit by mapping variable intersections, enhancing trend identification per scientific visualization guidelines.
Guided Usage for Optimal Results
- Choose Your Chart: Select from 22 slides based on your dataset complexity.
- Enter Data: Label sets and intersections clearly.
- Customize Appearance: Modify for visual appeal and relevance.
- Incorporate into Deck: Integrate seamlessly into your presentation.
- Present with Confidence: Use to drive discussions.
This method aligns with data storytelling best practices from experts like Stephen Few.
Superior to Default Options
Outshines basic Venn tools with advanced customization and educational focus, reducing preparation time significantly.
Fostering Authoritative Presentations
Compatible with PowerPoint, it includes intuitive elements for all users. Align with standards from visualization societies for trustworthy outputs.
Step up your data game - acquire this template and intersect success with simplicity.
Frequently Asked Questions
How do unions and intersections differ in these charts?
Unions show all elements combined; intersections highlight shared ones.
Is the template customizable for large datasets?
Yes, scalable for various data sizes with easy adjustments.
Suitable for business use?
Ideal for analyses like market overlaps.
What format is it in?
.pptx for PowerPoint compatibility.
Includes examples?
Yes, pre-filled for quick starts.
Can it handle multiple sets?
Supports up to three for clear visuals.
Good for
- Project roadmaps and sprint plans
- Product launch timelines
- Quarterly or annual review decks
- Company history and milestone summaries
Licence
reviews
Downloaded this before an early morning presentation.
The infographic slides looked decent on screen.
A little repetitive but still useful overall.
The graphs were simple to update with new data.
Good option when you need fast business slides.
FAQ
Will it work in Google Slides?
Are fonts embedded?
Can I use this for client work?
What's the refund policy?
Do you update the template after purchase?
Similar templates
See all PowerPoint Charts →
All 22 slides