 Click to zoom
Venn Collection Diagrams - Download Venn Keynote Charts Template
| Format | .pptx |
| Slides | 12 unique layouts |
| Aspect ratio | 16:9 |
| Compatibility | PowerPoint |
| Animated | No |
| Language | English |
| License | Commercial |
| File size | — |
| Version | v1.0 |
| Last updated | December 2024 |
What's inside
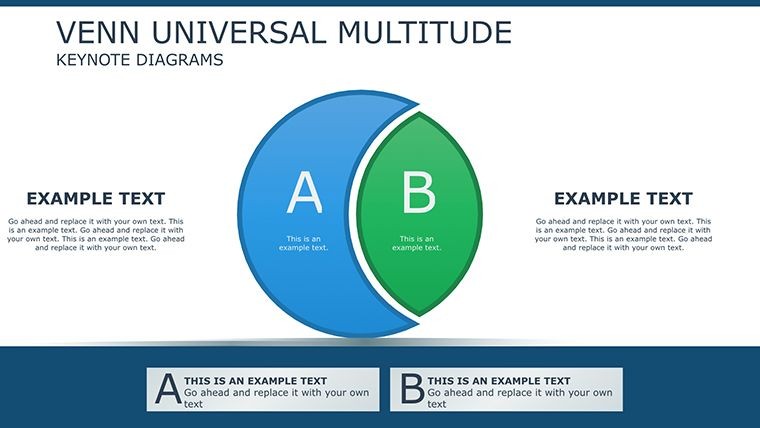
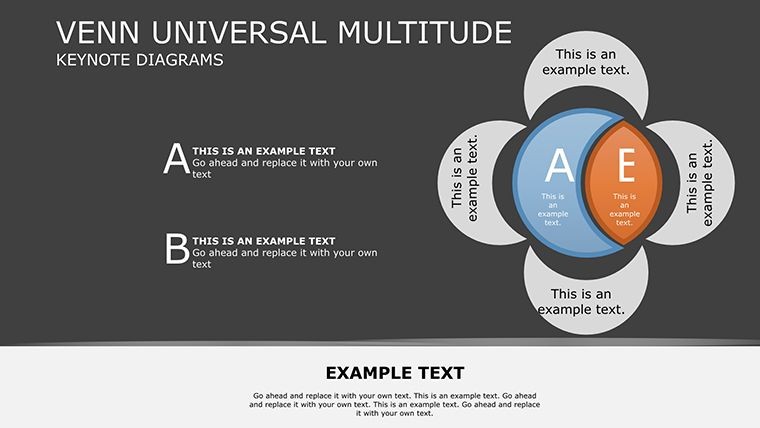
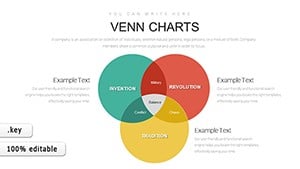
Visualizing relationships between ideas can turn a confusing jumble of data into a crystal-clear story that resonates with any audience. Whether you're dissecting market overlaps in a strategy session or explaining scientific concepts in a classroom, the right diagram makes all the difference. Enter our Venn Collection Diagrams Keynote Template: a versatile toolkit with 12 editable slides featuring classic two-circle setups to intricate multi-circle designs. Tailored for professionals who demand precision and flair, this template helps you express intersections, unions, and exclusions with ease, using high-quality, customizable graphics that adapt to your theme.
Beyond mere visuals, this resource addresses common pain points like time-consuming custom builds or lackluster stock options. Fully compatible with Keynote in .key format, it's designed for quick integration, allowing adjustments to colors, sizes, and fonts on the fly. Ideal for business analysts, educators, and project managers, it transforms abstract concepts into tangible visuals, fostering better understanding and decision-making. With its ready-to-use nature, you'll spend less time designing and more time delivering impactful messages.
Standout Features for Enhanced Visualization
At the heart of this template are its adaptable Venn diagrams, which go beyond basics to include layered configurations for complex analyses. Each slide is built with vector precision, ensuring scalability for digital screens or print without pixelation. Customize opacity for overlapping areas to emphasize shared traits, or add labels for detailed annotations.
- Varied Layouts: From simple dual overlaps to five-circle complexities, covering diverse scenarios.
- Color Customization: Match your brand palette effortlessly, enhancing thematic consistency.
- Font and Size Flexibility: Adjust text for readability, supporting multiple languages if needed.
- High-Quality Graphics: Professional-grade elements that elevate your slides above amateur efforts.
In contrast to Keynote's default shapes, which require manual alignment and often look rudimentary, this template offers pre-aligned, aesthetically pleasing options. Marketing teams, for example, have used similar tools to map customer segments, as seen in case studies from industry leaders like HubSpot, boosting engagement by highlighting synergies.
In-Depth Slide Overview
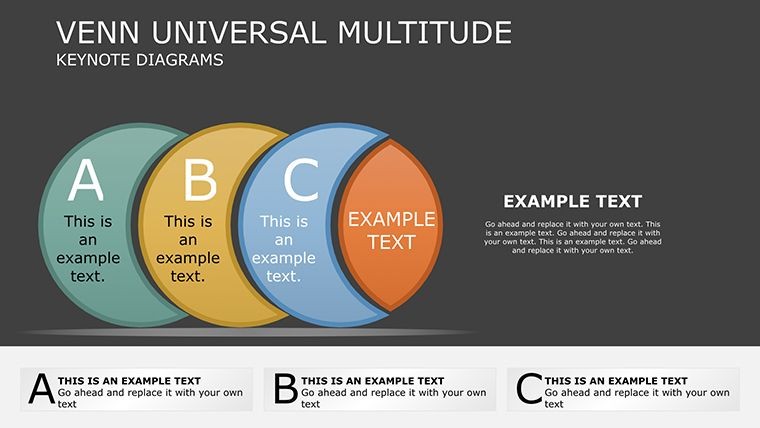
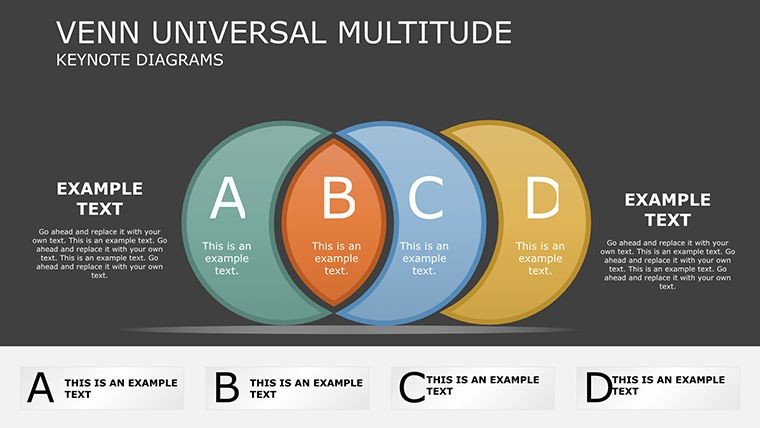
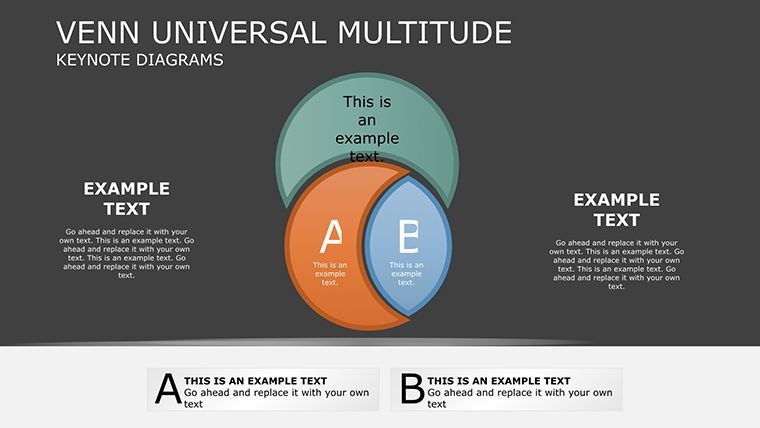
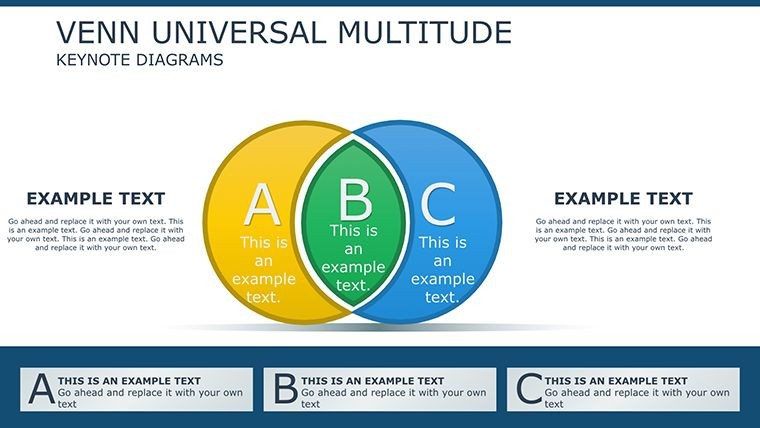
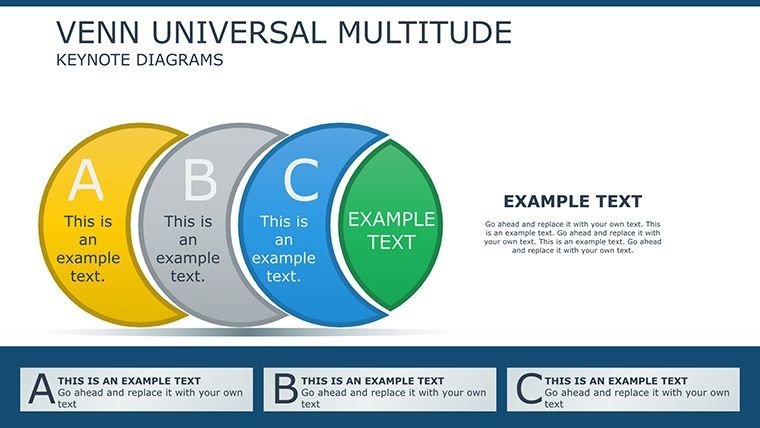
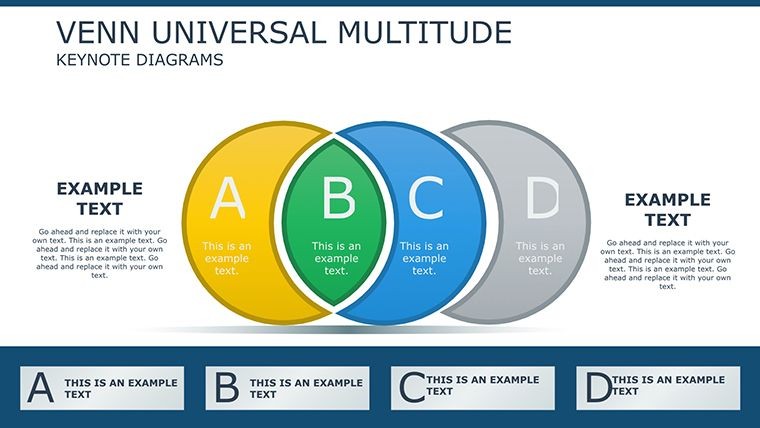
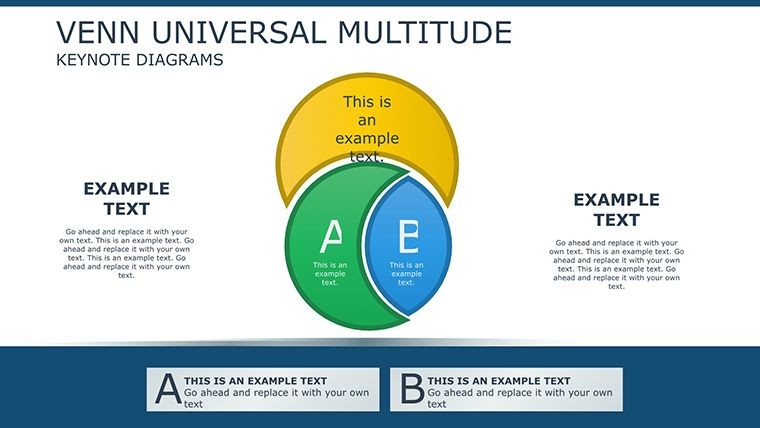
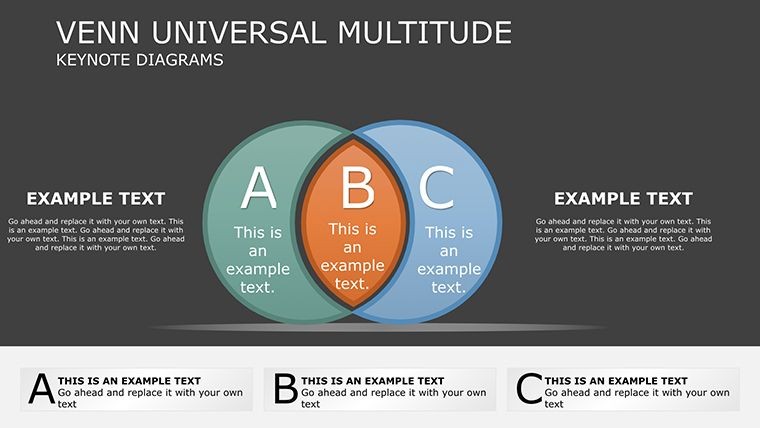
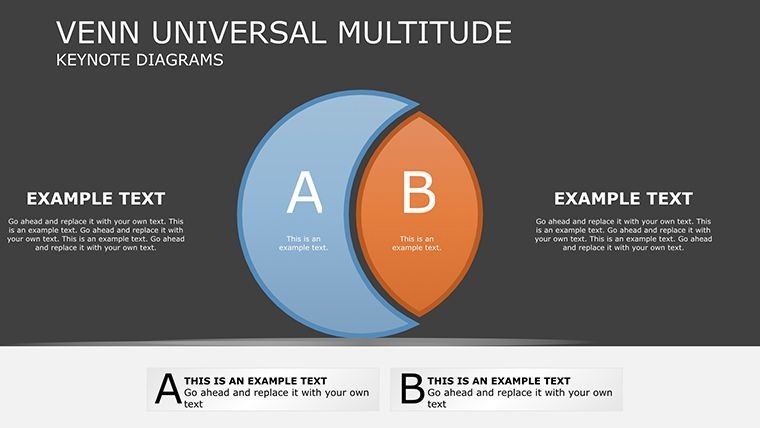
Breaking it down, Slide 1 introduces a basic two-set Venn for foundational comparisons, like pros vs. cons. Progressing through, slides build complexity: three-circle for multifaceted relationships, up to multi-set for advanced data like ecosystem mappings. Each includes placeholders for titles, descriptions, and data points, with subtle gradients in overlaps for visual depth. Tips: Use bold fonts for key intersections to guide viewer focus, or incorporate icons from Keynote's library for added context.
For workflow, start by selecting a slide, input your sets (e.g., 'Team A Skills' and 'Team B Skills'), and tweak overlaps to reflect shared competencies. This streamlined approach saves hours compared to from-scratch creation.
Practical Use Cases Across Industries
This template excels in real-world applications. In business, analysts can illustrate competitor overlaps in market share, aiding strategic planning. Educators simplify topics like literary themes, where Venns show character similarities across novels, aligning with pedagogical standards from sources like the National Education Association.
Step-by-step for project management: Open the .key file, choose a three-circle slide for team role analysis. Label circles as 'Development,' 'Design,' and 'Marketing,' shading intersections for collaborative areas. Add metrics like task counts, preview, and present. This visual aid clarifies responsibilities, reducing miscommunication.
Other scenarios include data analysis for research, where overlaps reveal correlated variables, or creative brainstorming sessions to merge ideas. Students benefit too, creating polished assignments that stand out. Unlike rigid tools, its editability supports iterative refinements, integrating seamlessly with tools like MindMeister for idea export.
Integrating into Your Presentation Flow
Enhance your routine by combining with Keynote animations - fade in circles sequentially to build suspense. Value adds: Cost-effective for repeated use, professional polish that builds trust, and versatility across sectors. A real-inspired example: A tech startup used Venn diagrams to pitch investor alignments, securing funding by clearly showing value propositions, akin to successes reported in Entrepreneur magazine.
Expert Tips for Optimal Use
- Balance complexity: Start simple to avoid overwhelming viewers.
- Color code strategically: Use hues to denote categories intuitively.
- Annotate thoroughly: Add notes for clarity in shared presentations.
- Export options: Save as PDF for non-editable distributions.
- Combine with data: Link to spreadsheets for dynamic updates.
These practices ensure your Venns not only inform but inspire dialogue.
Ready to clarify your concepts with elegance? Download this Venn template and revolutionize how you present relationships today.
Frequently Asked Questions
How customizable are the Venn diagrams?
Fully editable - change colors, sizes, fonts, and layouts to suit your needs.
Does it support multi-circle designs?
Yes, from two to multiple circles for complex overlaps.
What format is the template in?
.key, native to Keynote for easy opening and editing.
Can I use it for educational purposes?
Absolutely, ideal for simplifying concepts in teaching or training.
Are animations pre-built?
No, but add Keynote animations easily for dynamic reveals.
Good for
- Project roadmaps and sprint plans
- Product launch timelines
- Quarterly or annual review decks
- Company history and milestone summaries
Licence
reviews
Used for university presentation and charts were easy to follow
Made a work report and everything looked structured
It is okay but not very advanced design
Helped me save time on formatting slides
Simple graphs made data explanation easier
FAQ
Will it work in Google Slides?
Are fonts embedded?
Can I use this for client work?
What's the refund policy?
Do you update the template after purchase?
Similar templates
See all Keynote Charts →
All 12 slides