 Click to zoom
Vacancy Charts PowerPoint Template - HR Visualization Tool
| Format | .pptx |
| Slides | 15 unique layouts |
| Aspect ratio | 16:9 |
| Compatibility | PowerPoint |
| Animated | No |
| Language | English |
| License | Commercial |
| File size | — |
| Version | v1.0 |
| Last updated | February 2024 |
What's inside
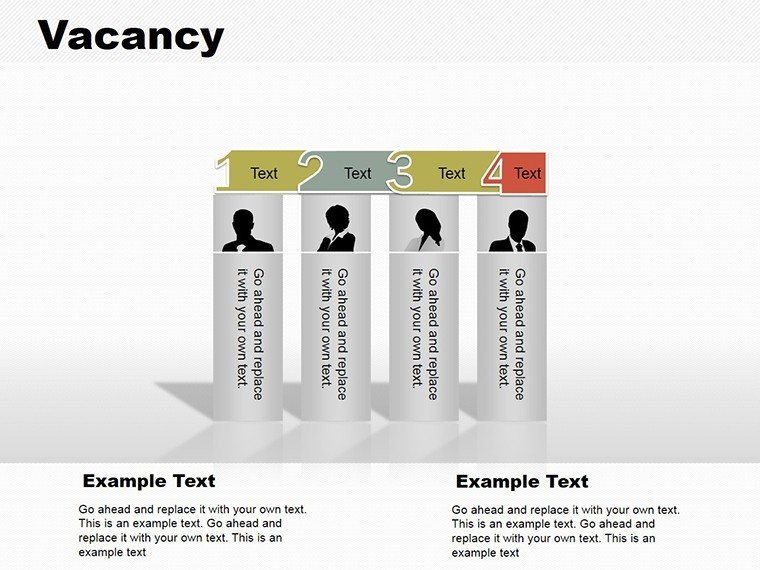
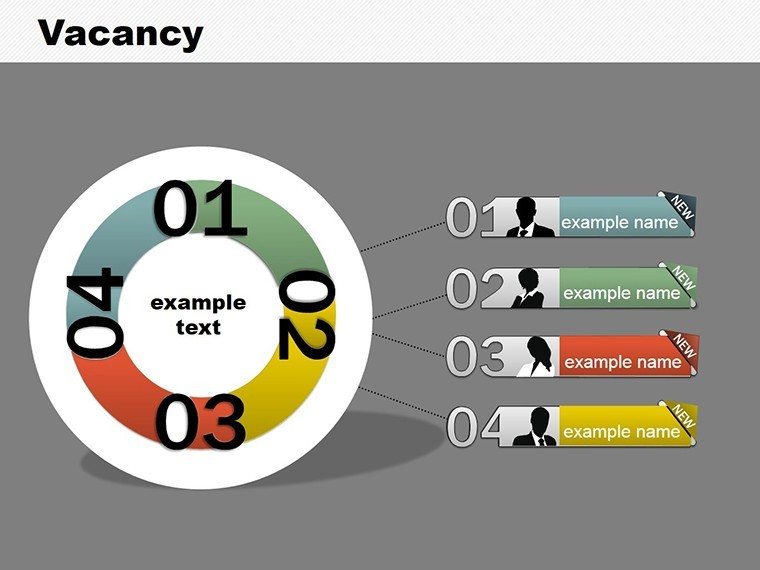
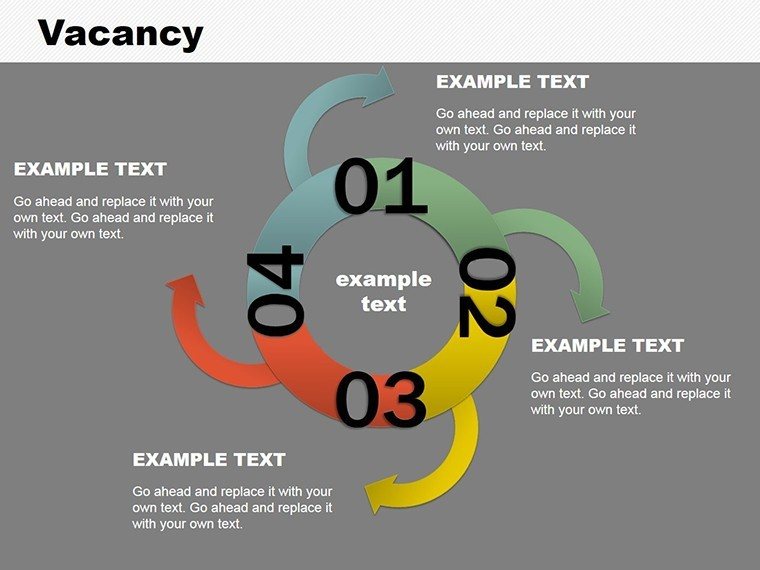
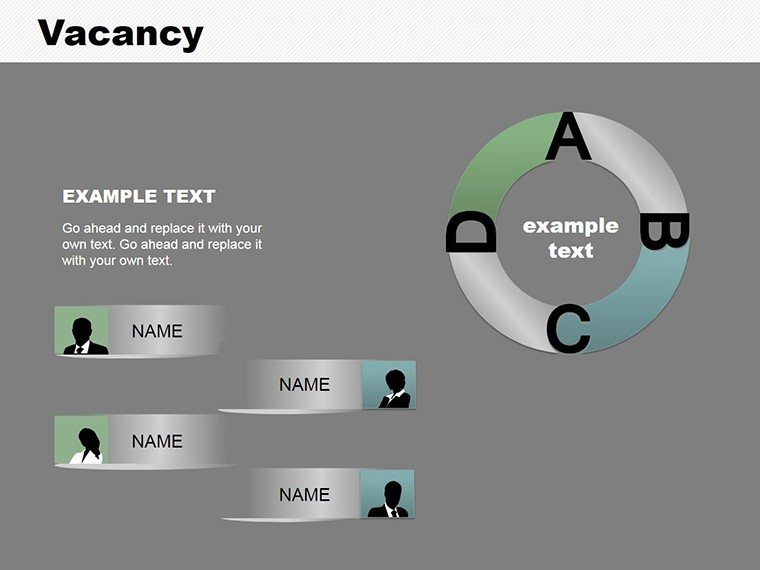
Navigating the complexities of human resources requires tools that not only display data but also tell a compelling story about your organization's talent landscape. Our Vacancy Charts PowerPoint Template, with its 15 editable slides, is crafted specifically for HR professionals, recruiters, and managers who need to communicate job openings, recruitment metrics, and organizational hierarchies effectively. Picture this: A clear pie chart breaking down vacancy rates by department, paired with an organizational flowchart showing reporting lines - turning abstract HR data into actionable insights that drive strategic decisions.
This template bridges the gap between raw statistics and meaningful narratives, ideal for board meetings, team updates, or talent acquisition strategies. By focusing on vacancy-specific visuals, it helps highlight pain points like high turnover in key roles or growth opportunities in expanding teams, all while maintaining a professional, modern aesthetic that resonates with stakeholders.
The Role of Visuals in HR and Recruitment
In HR, data visualization is more than a trend - it's a necessity for clarity in a field governed by metrics like time-to-hire and employee retention rates. This template draws on best practices from SHRM (Society for Human Resource Management) guidelines, emphasizing intuitive designs that reduce cognitive load. For example, use pie charts to illustrate vacancy distributions across roles, making it easy to spot imbalances in staffing.
Unlike standard PowerPoint defaults, these charts incorporate organizational elements, allowing for hybrid views that combine percentage-based vacancies with structural overviews. This unique blend supports scenarios like merger integrations, where visualizing post-merger vacancies helps in reallocating talent seamlessly.
Standout Features for Efficient HR Presentations
At the heart of this template are features tailored for HR workflows. The 15 slides include vector graphics for sharp visuals, ensuring they look great on any screen size. Easy customization means you can rebrand with your company's colors, fonts, and logos in minutes, fostering a consistent look across all HR materials.
- Diverse Chart Types: Mix of pie charts for proportional data and organizational hierarchies for structure mapping.
- Data Linking Capabilities: Connect to HR software like Workday or Excel for real-time updates on vacancy stats.
- Professional Themes: Options for corporate, modern, or minimalist styles to match your audience's expectations.
- Interactive Elements: Hyperlinks within org charts to drill down into role descriptions.
- Broad Compatibility: Fully functional in PowerPoint and Google Slides for team collaborations.
These tools empower you to create presentations that go beyond static slides. In a recruitment drive, for instance, select a slide showing vacancy trends over time and adjust the data to reflect current openings, instantly updating visuals to support your pitch for new hires.
In-Depth Look at the Slide Collection
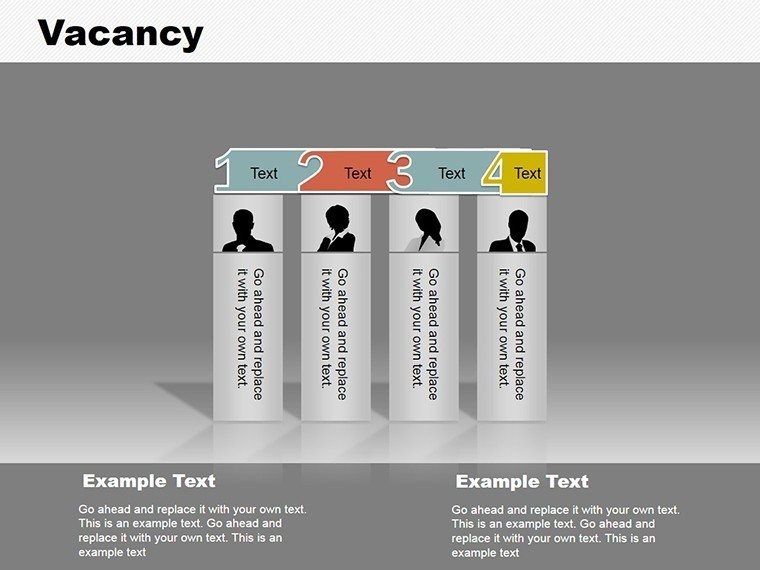
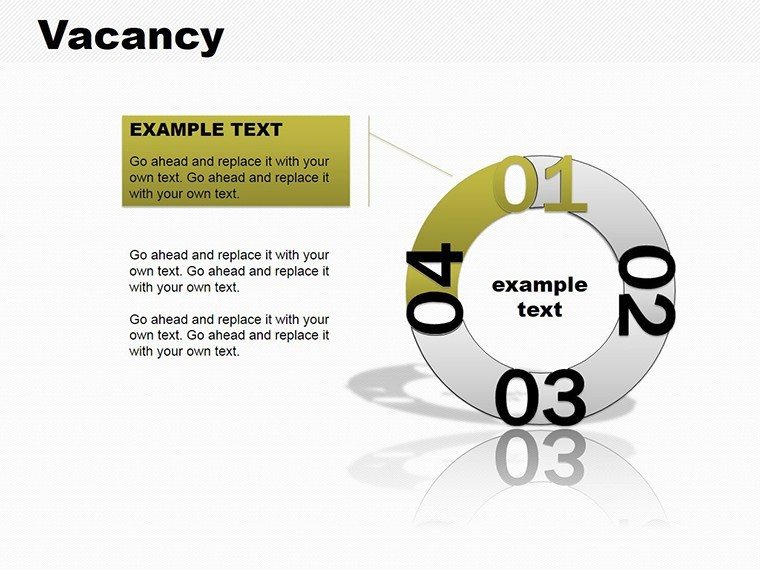
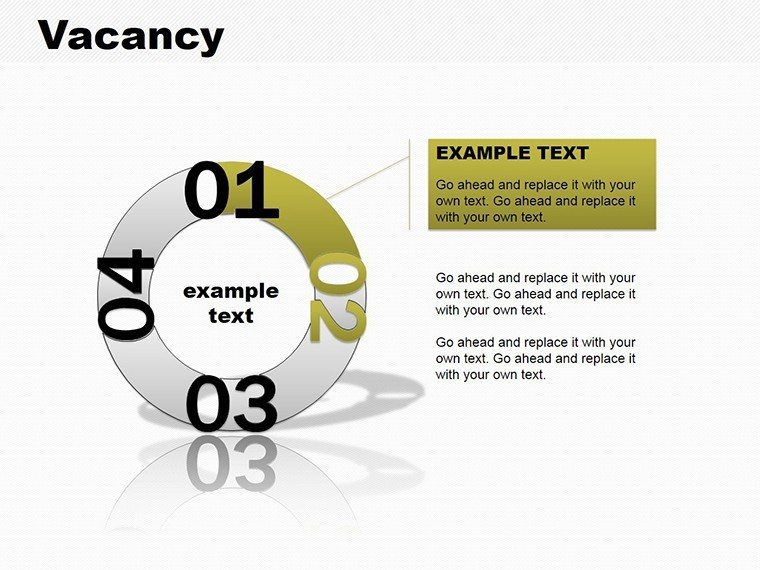
Breaking it down, Slide 1 offers an overview pie chart for total vacancies, with ample space for executive summaries. Slides 2-5 focus on departmental breakdowns, using colored segments to denote urgency levels. Organizational charts dominate Slides 6-10, allowing for layered views of teams with vacant positions highlighted in red.
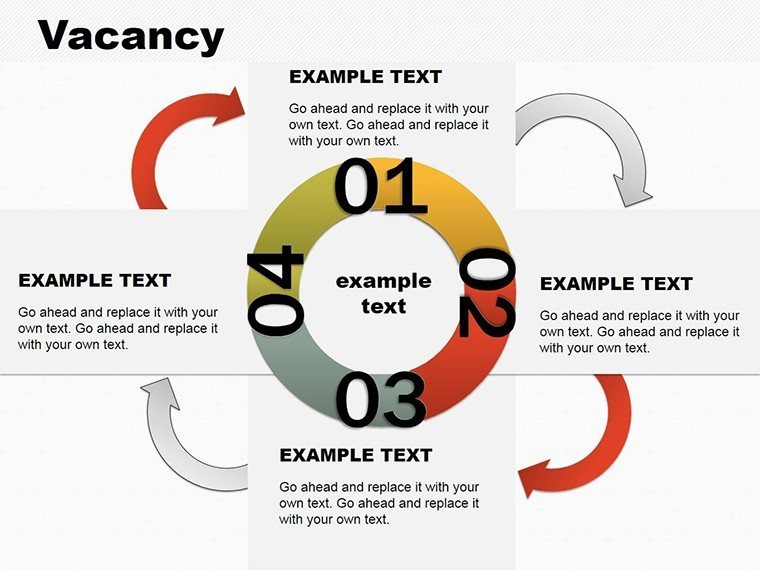
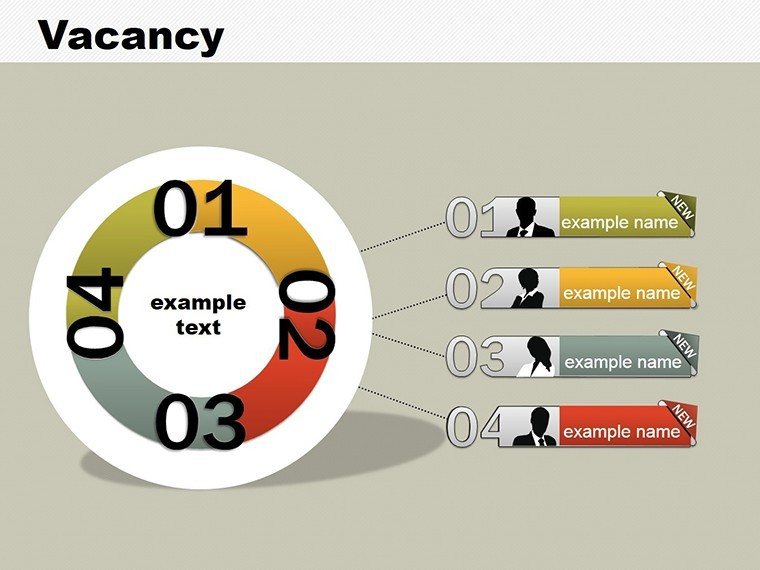
The latter slides, 11-15, combine elements - like a pie within an org chart - for comprehensive reports on hiring pipelines. Each includes customizable icons representing roles, from entry-level to C-suite, drawn from a HR-themed library to enhance relevance.
Practical Use Cases in Talent Management
Apply this template in real HR contexts for maximum effect. In corporate settings, use it to present to leadership on staffing gaps, perhaps in a healthcare firm aligning with Joint Commission standards by visualizing nurse shortages. Educators in HR training programs can leverage it to teach recruitment strategies, with charts showing hypothetical vacancy scenarios.
For research or conferences, showcase industry trends, like post-pandemic hiring shifts, using data-backed visuals. These applications, inspired by case studies from firms like Deloitte, demonstrate how targeted charts lead to faster decision-making and better resource allocation.
- Assess Your Data: Compile vacancy rates, role details, and org structures.
- Pick Appropriate Slides: Match complexity to your audience - simple pies for overviews, full orgs for details.
- Tailor Visuals: Input data, adjust colors to indicate priorities (e.g., red for critical vacancies).
- Integrate into Strategy: Use in conjunction with HR plans for cohesive narratives.
- Review and Present: Simulate delivery to ensure flow and impact.
Users often find this process cuts presentation prep time in half, freeing up focus for strategic HR initiatives.
Expert Tips for HR Data Visualization
Optimize by adhering to color psychology - use greens for filled roles, yellows for pending. Ensure accessibility with high-contrast text, aligning with ADA guidelines. Complement charts with narratives, explaining implications like how a 20% vacancy rate affects productivity. Avoid overload by focusing on key metrics, as per HR analytics best practices.
Incorporate feedback loops: After presentations, note audience reactions to refine future uses, turning this template into a evolving tool for your HR arsenal.
Transform Your HR Insights Now
Don't let vacancy data languish in spreadsheets - bring it to life with this specialized template. Download today and position your organization for talent success with visuals that inform and engage.
Frequently Asked Questions
How customizable are the organizational charts?
Fully adjustable - add/remove nodes, change shapes, and update labels effortlessly.
Does it support real-time data updates?
Yes, link to external sources like Excel for automatic refreshes.
Is it suitable for non-HR uses?
While HR-focused, it adapts to any hierarchical or proportional data needs.
What file format is provided?
.pptx, compatible with Microsoft PowerPoint and Google Slides.
Can I add my own icons?
Absolutely, integrate custom graphics to personalize further.
Good for
- Project roadmaps and sprint plans
- Product launch timelines
- Quarterly or annual review decks
- Company history and milestone summaries
Licence
reviews
Used this template for a business class presentation.
The chart sections were easy to fill with my data.
I liked the clean slide order.
A few graphs looked slightly old-fashioned.
Still worked fine for my assignment.
FAQ
Will it work in Google Slides?
Are fonts embedded?
Can I use this for client work?
What's the refund policy?
Do you update the template after purchase?
Similar templates
See all PowerPoint Charts →
All 15 slides