 Click to zoom
Useful Pie Indicators Keynote Template: Decode Macro Trends
| Format | .pptx |
| Slides | 17 unique layouts |
| Aspect ratio | 16:9 |
| Compatibility | PowerPoint |
| Animated | No |
| Language | English |
| License | Commercial |
| File size | — |
| Version | v1.0 |
| Last updated | January 2022 |
What's inside
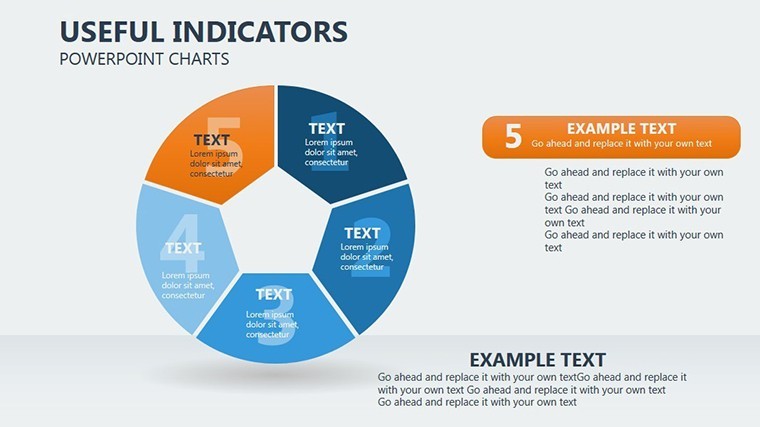
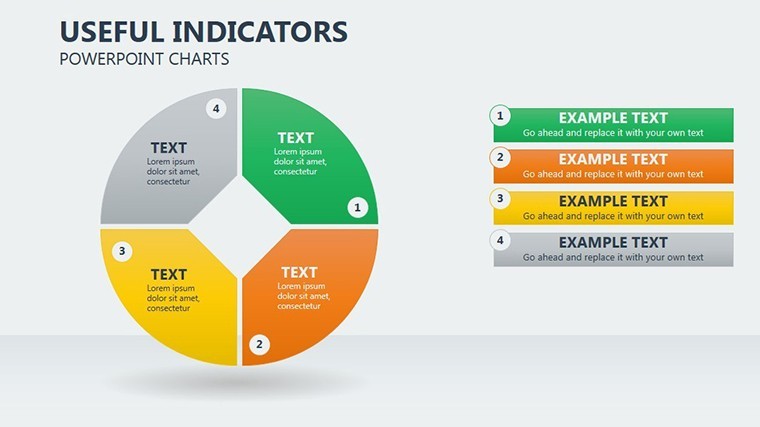
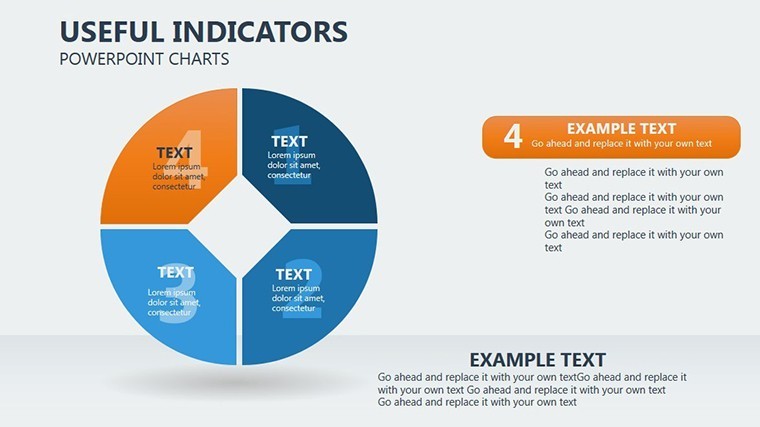
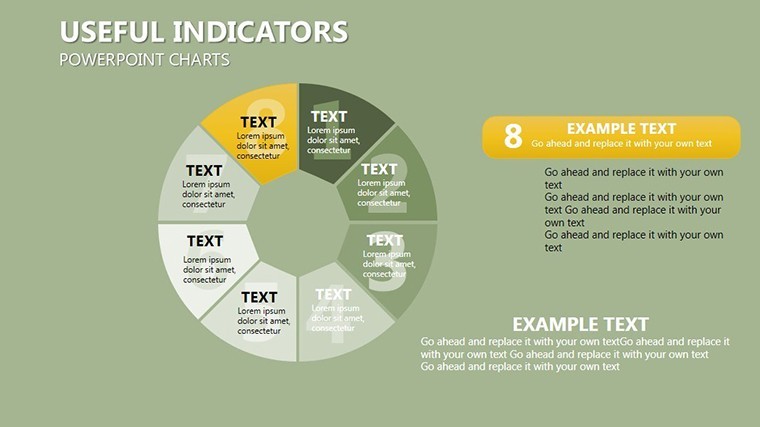
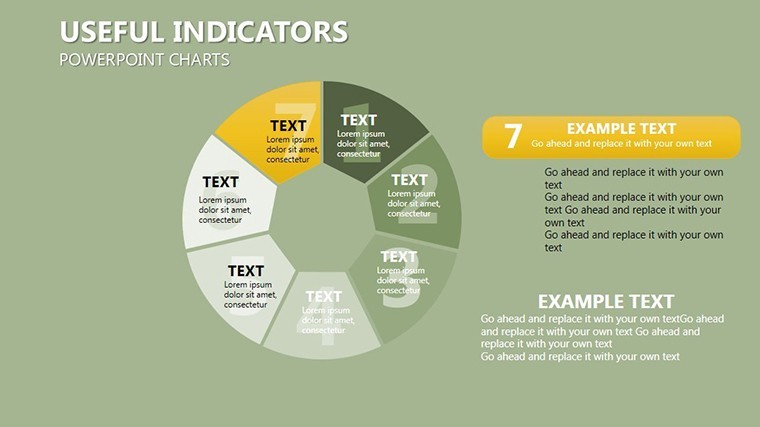
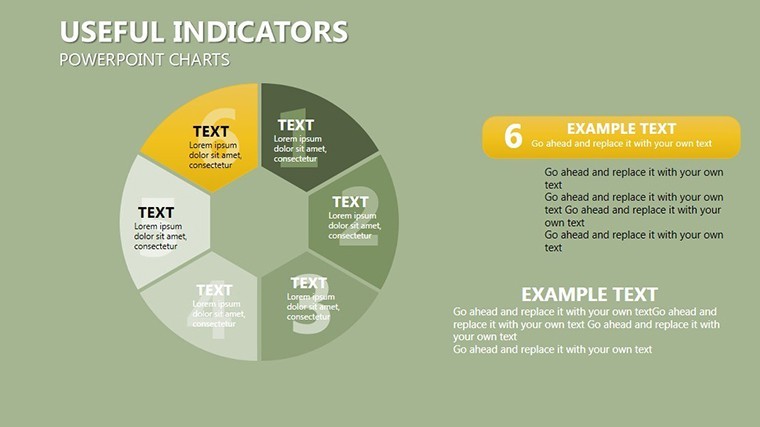
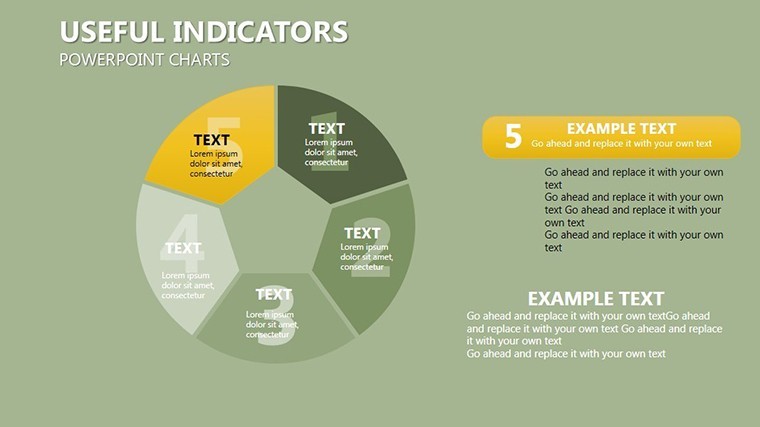
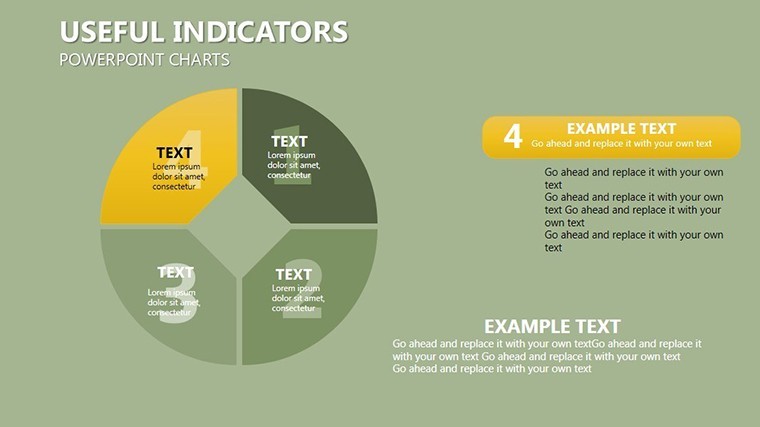
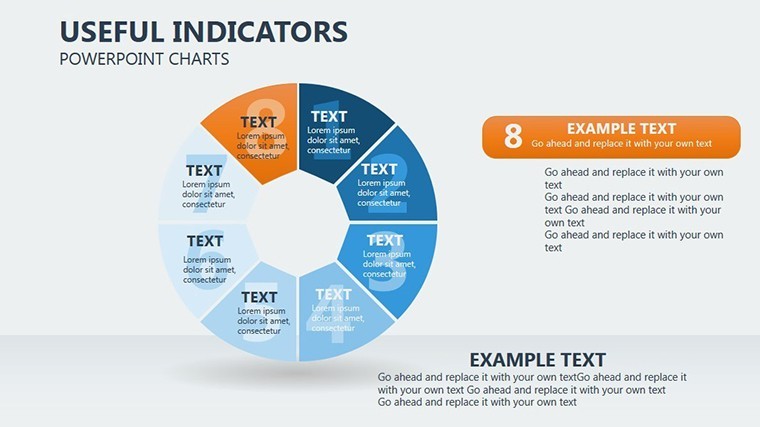
Envision slicing through the noise of global markets to reveal actionable insights that shape investment strategies. The Useful Pie Indicators Keynote template delivers precisely that, with 17 editable slides crafted for finance professionals navigating macroeconomic complexities. Targeted at investors, bankers, and market agents, it highlights variances in event assessments, empowering you to present data with clarity and conviction.
Rooted in pie chart fundamentals, enhanced for financial storytelling, this template draws from methodologies like those in IMF reports, where segmented visuals dissect factors such as GDP contributions or risk distributions. It's ideal for illustrating how macroeconomic shifts influence decisions, fostering a deeper understanding among stakeholders.
With a sleek, professional palette of greens and blues symbolizing growth and stability, the slides integrate seamlessly into Keynote, offering a trustworthy platform for high-stakes presentations. It's about turning data disparities into strategic advantages.
Core Features for Financial Visualization
The template's pie charts are engineered for precision, allowing nuanced representations of proportional data.
- Segmented Pie Designs: Customize slices for factors like inflation rates or sector allocations, with labels and legends for quick comprehension.
- Indicator Overlays: Add arrows or highlights to emphasize key differences, ideal for comparative analyses.
- Data Linking: Connect to external sources via Keynote for live updates during volatile markets.
- Icon Library: Financial-themed graphics, such as currency symbols or trend lines, to enrich narratives.
- Widescreen Optimization: 16:9 format ensures crisp displays on modern screens.
These elements adhere to standards from the CFA Institute, promoting ethical and effective data presentation.
Slide-by-Slide Insights
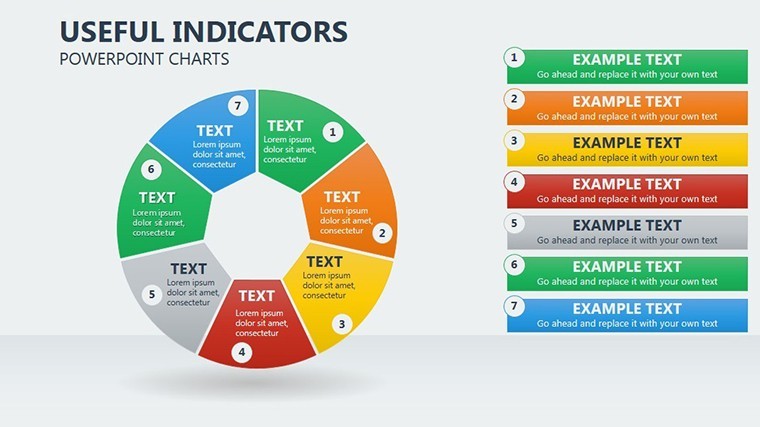
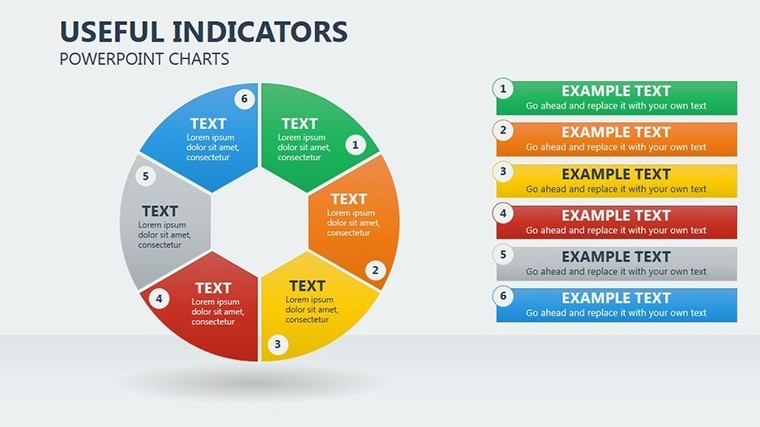
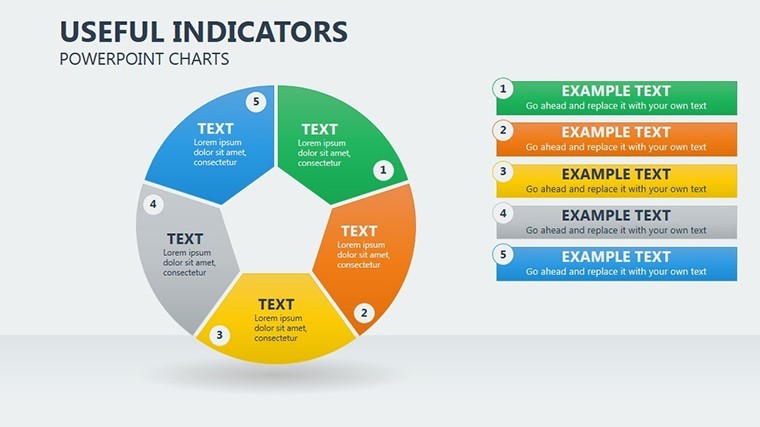
Slides 1-3 kick off with overview pies, perfect for summarizing macroeconomic overviews - like piecing together interest rate impacts on currencies. Slides 4-9 introduce multi-pie comparisons, enabling side-by-side views of scenarios, e.g., pre- and post-event assessments.
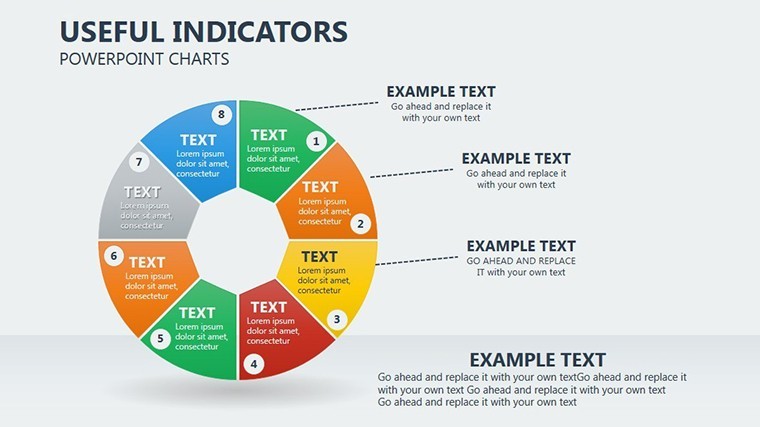
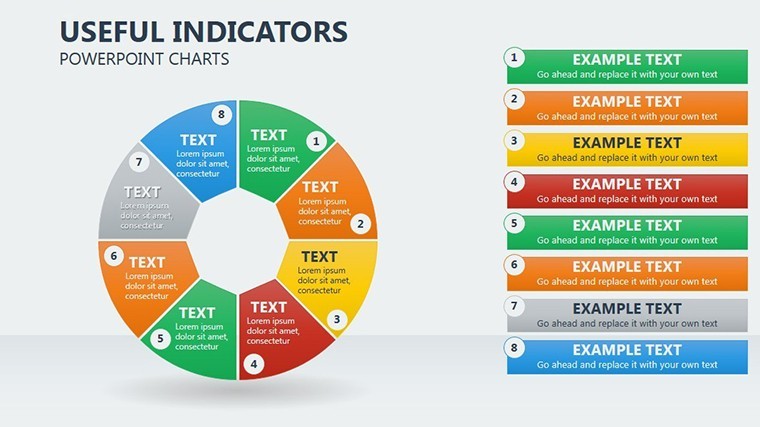
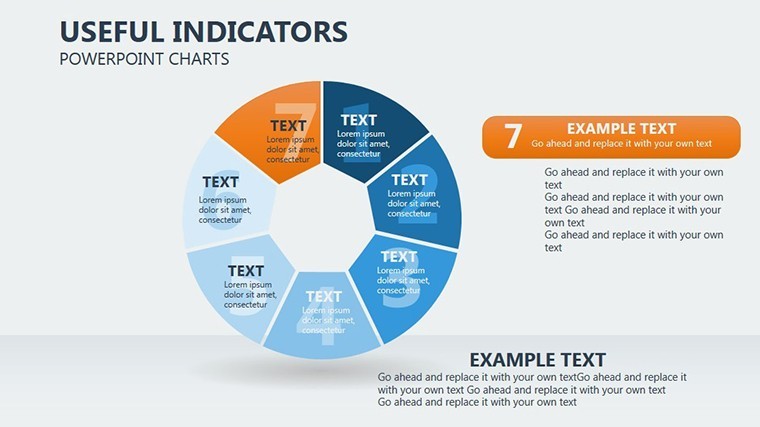
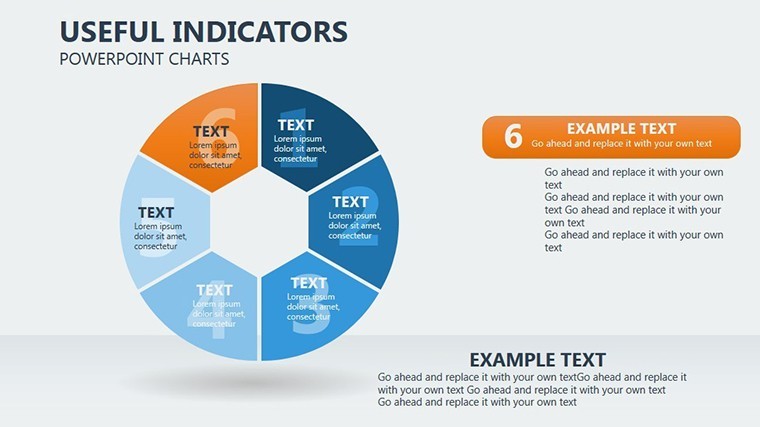
Deeper dives in Slides 10-14 feature exploded pies for emphasis, useful in banking reports to spotlight outlier factors. Slide 12, notably, allows for doughnut variations, circling core indicators amid surrounding data.
Final slides (15-17) wrap with actionable summaries, including dashboards that aggregate pies for holistic views, akin to Bloomberg terminal inspirations.
Applications in International Finance
For a hedge fund analyst, use it to visualize currency market reactions to geopolitical events, guiding portfolio adjustments. Banks might employ it for risk assessments, segmenting loan portfolios by macroeconomic vulnerabilities.
In academia, professors can demonstrate indicator divergences in lectures on global economics, making theory relatable. Step-by-step:
- Collect Indicators: Assemble data on events and factors.
- Segment Pies: Allocate proportions accurately.
- Enhance Visuals: Apply colors and indicators for clarity.
- Interpret Differences: Present to reveal strategic insights.
This method tackles challenges like misaligned assessments, aligning teams on data-driven paths.
Tips from Financial Experts
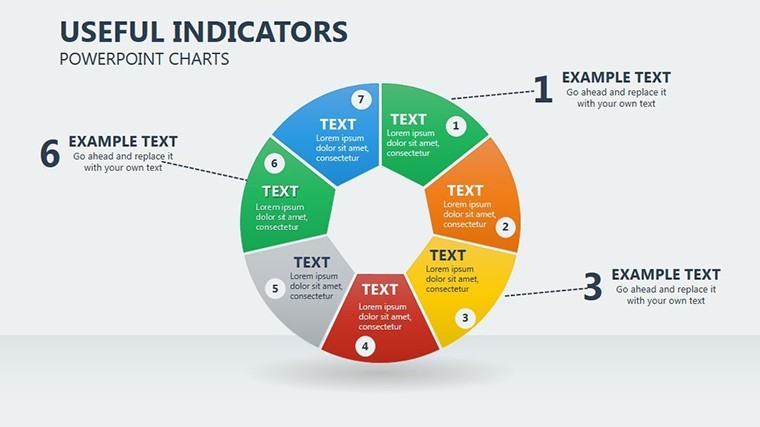
Limit slices to 5-7 for readability; use contrasting colors for distinctions. Leverage Keynote's build animations to unveil segments sequentially, building suspense in narratives. Unlike generic pies, these indicators add contextual layers, elevating from basic to bespoke analysis.
Secure Your Market Edge Now
Backed by expert design and real-world applicability, this template ensures authoritative, trustworthy outputs. Dive into macroeconomic mastery - acquire the Useful Pie Indicators today and chart your success.
FAQ
How flexible are the pie segments?
Completely adjustable in Keynote, with easy data input for custom proportions.
Suitable for beginner financiers?
Yes, intuitive design aids novices while scaling for experts.
Can I integrate real-time data?
Link to spreadsheets for dynamic updates.
Compatible with Mac only?
Primarily for Keynote on Apple devices, but exportable to PDF.
What if data changes mid-presentation?
Quick edits ensure adaptability.
Are there color-blind friendly options?
Yes, customizable palettes for accessibility.
Good for
- Project roadmaps and sprint plans
- Product launch timelines
- Quarterly or annual review decks
- Company history and milestone summaries
Licence
reviews
I used this for a university statistics project.
The pie chart slides were the most useful part for me.
One layout broke when I changed fonts but maybe that was my fault.
Didn’t expect much honestly but it looked fine during the presentation.
The darker background made the charts easier to read.
FAQ
Will it work in Google Slides?
Are fonts embedded?
Can I use this for client work?
What's the refund policy?
Do you update the template after purchase?
Similar templates
See all Keynote Charts →

All 17 slides