 Click to zoom
Unleashing the Flow: Hydropower Energy PowerPoint Charts for Dynamic Presentations
| Format | .pptx |
| Slides | 59 unique layouts |
| Aspect ratio | 16:9 |
| Compatibility | PowerPoint |
| Animated | No |
| Language | English |
| License | Commercial |
| File size | — |
| Version | v1.0 |
| Last updated | June 2023 |
What's inside
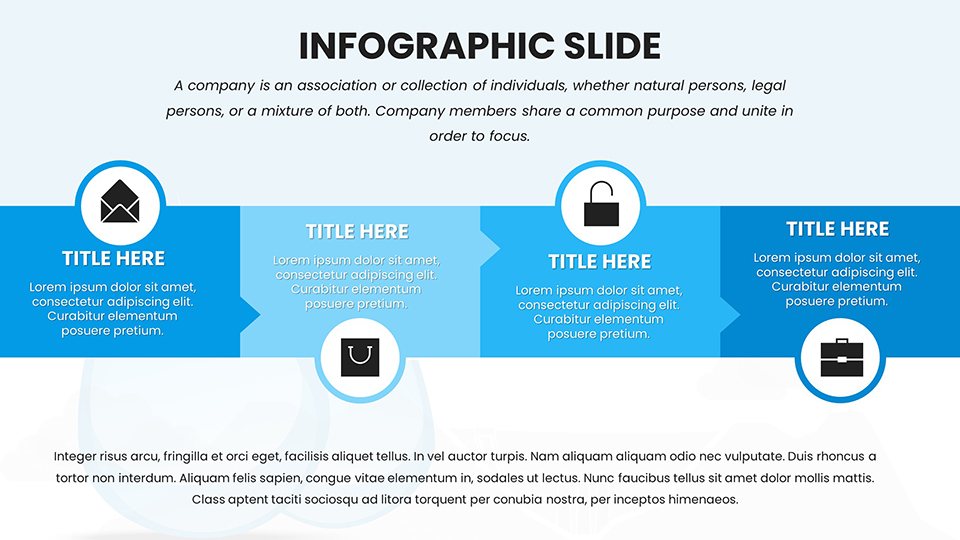
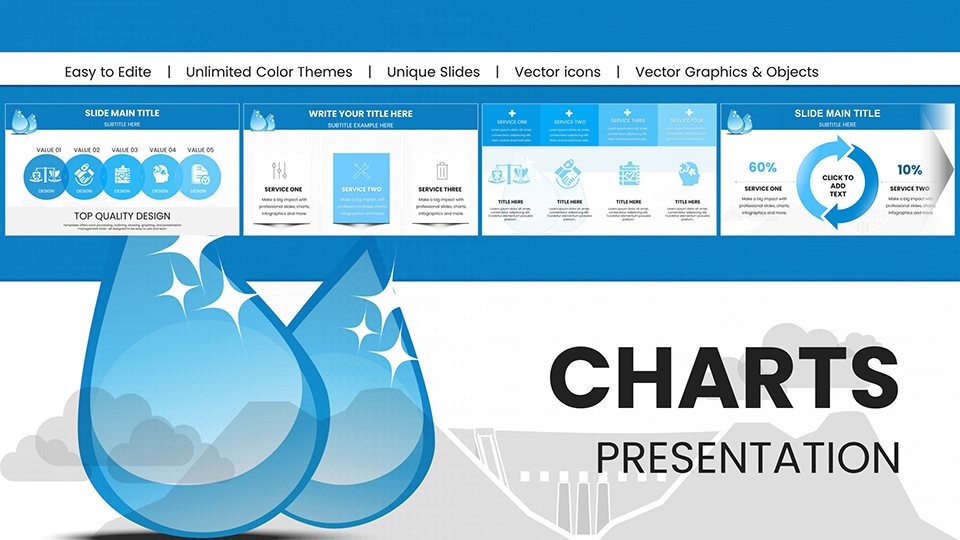
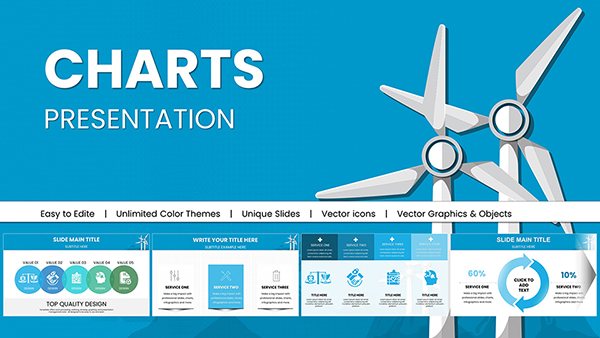
Feel the rush of water turning turbines into tales of sustainable power. Our Hydropower Energy PowerPoint charts template channels this energy into 59 editable slides, equipped with infographics that vividly depict everything from dam operations to river basin management. Ideal for energy sector professionals in utilities, researchers exploring hydroelectric innovations, and government officials drafting policy briefs, this template streamlines complex concepts like capacity factors and environmental impacts into flowing visuals. Customize to highlight successes, such as China's Three Gorges Dam generating over 100 TWh annually per official stats, making your pitches as powerful as the currents they represent. Whether for R&D symposiums or agency reports, these charts ensure your data surges ahead, fostering informed decisions on renewable integration.
Powerful Features for Streamlined Communication
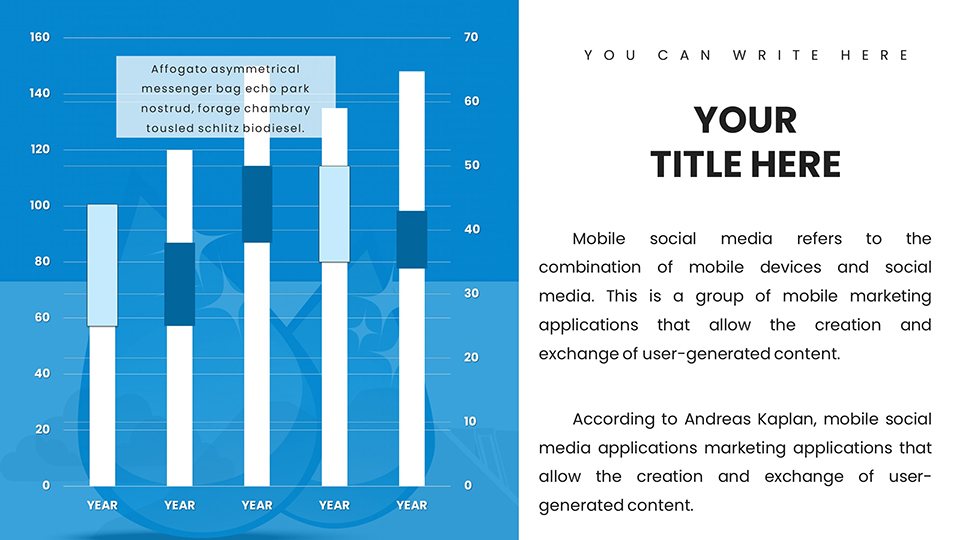
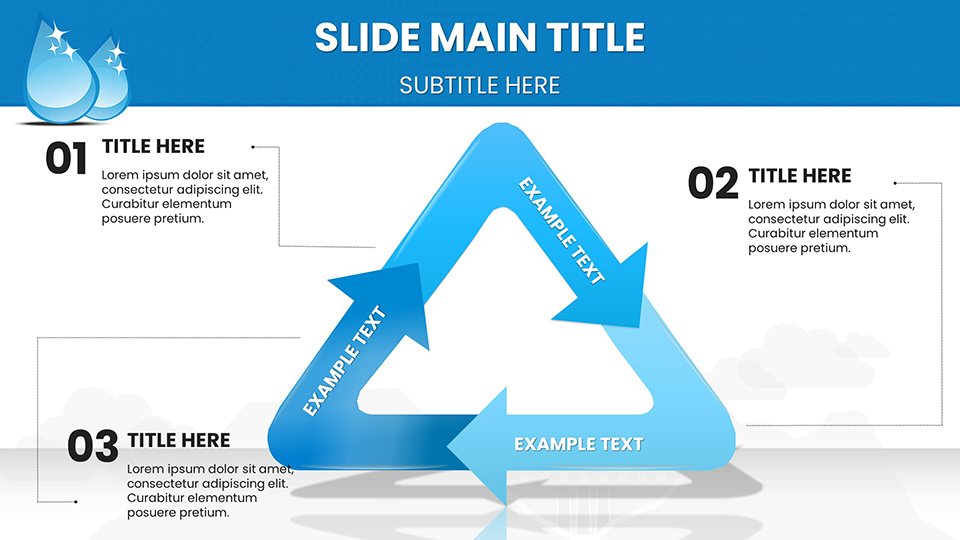
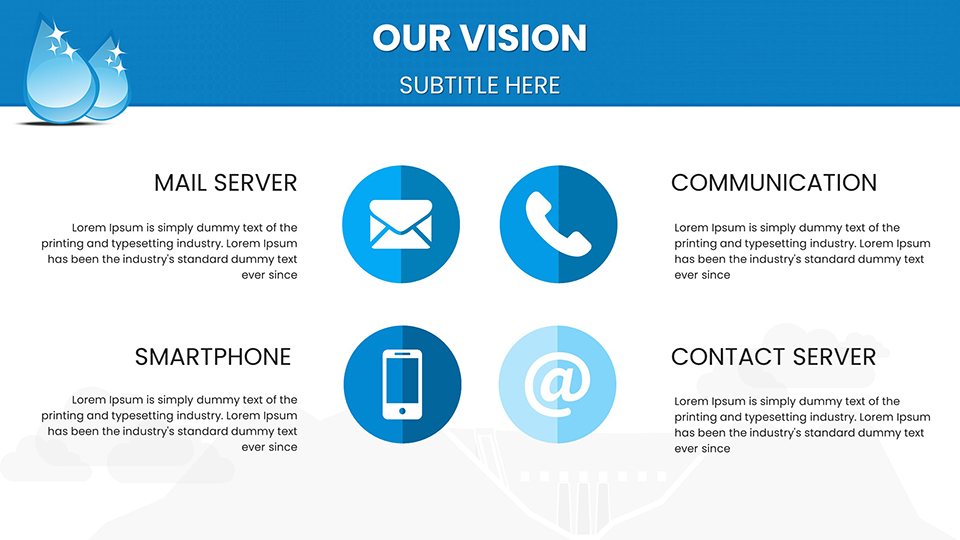
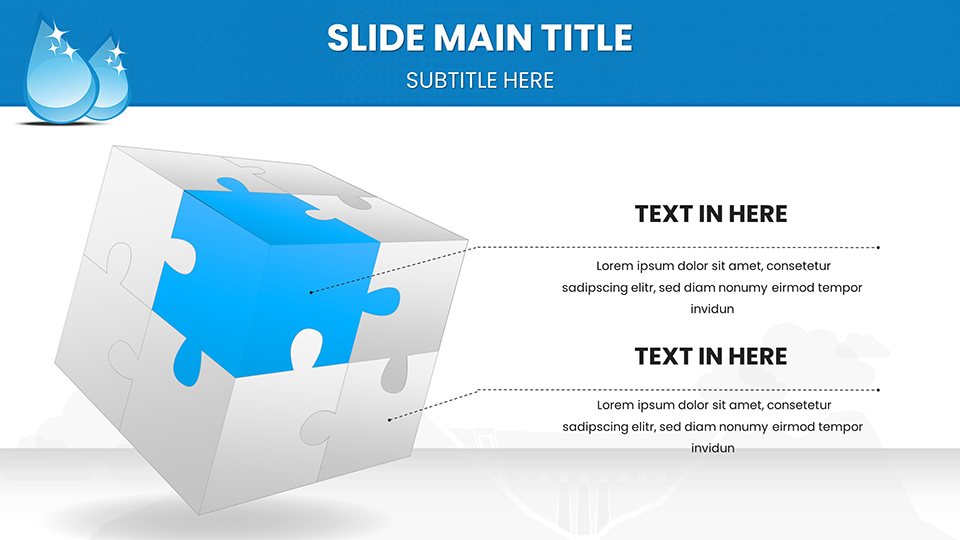
This template's strength lies in its robust, water-themed elements: Flowcharts for energy conversion processes, gauge charts for reservoir levels, and network diagrams for grid connections. Blues and whites dominate, evoking rivers and waves.
- Editable Graphs: Adjust for site-specific data, like turbine efficiency curves from GE Hydro reports.
- Custom Layouts: Reshape to fit narratives on pumped storage, enhancing peak load management discussions.
- Intuitive Design: Quick edits for non-designers, with tooltips on hydropower metrics.
- Wide Scope: From micro-hydro setups to mega-dams, aligned with IHA sustainability protocols.
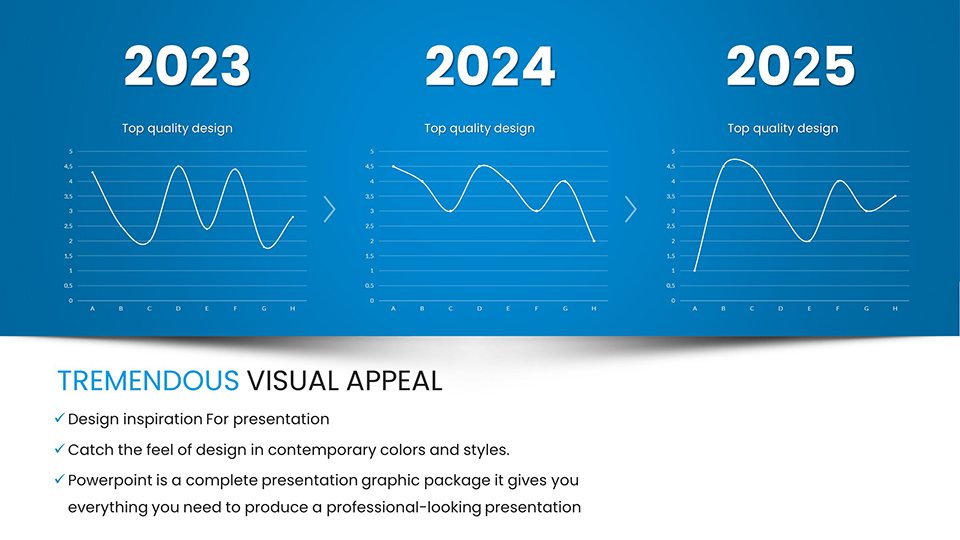
Addresses issues like seasonal variability; use area charts to model flow rates across wet/dry seasons.
Navigating the Slides: From Source to Surge
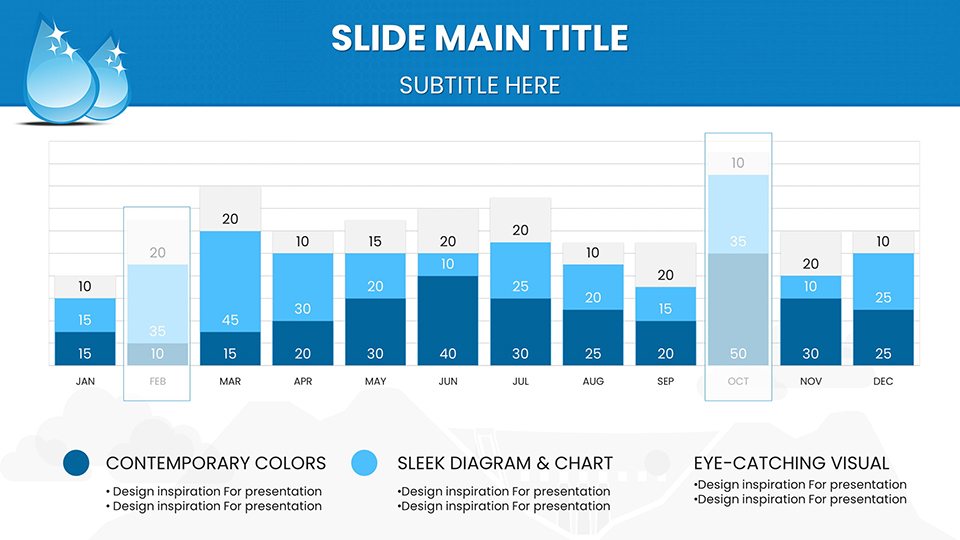
Launch with Slide #3, a hydrological cycle overview, tailorable for regional climates - e.g., monsoon impacts in India. Proceed to Slide #18, bar graphs on global capacity, citing IRENA's 1,300 GW installed base. Core slides 30-50 tackle economics and ecology: Cost-benefit matrices, fish ladder illustrations, and trend lines for sediment management.
Final slides propose futures, like hybrid hydro-solar systems, with Gantt charts for project phasing.
Deployment in the Field: Energizing Audiences
Utilities use for investor updates, visualizing ROI from upgrades like Norway's 95% hydro reliance. Researchers present at WEF forums with comparative charts vs. wind. Agencies craft compliance docs with EIA-aligned visuals.
Expert Strategies for Hydro Mastery
Boost with: Animate water flows for engagement. Reference standards like ASME for credibility. Simulate scenarios with variable data sets.
- Localize content: Adapt to river-specific challenges like the Mississippi's flooding.
- Collaborate: Share editable versions for team inputs.
- Update regularly: Incorporate new tech like floating hydro.
Turns presentations into catalysts for hydro advancements.
Beyond Basics: The Hydro Advantage
Surpasses default charts with specialized hydro icons, offering depth for technical audiences. 59 slides provide exhaustive coverage.
Harness this power - download your hydropower charts and let ideas flow freely.
Frequently Asked Questions
How flexible are the hydropower graphs?
Fully flexible, with editable data and designs for custom scenarios.
Works with collaborative tools?
Yes, integrates with OneDrive for real-time edits.
Ideal for policy presentations?
Excellent, with templates for regulatory compliance visuals.
Includes environmental impact charts?
Yes, dedicated slides for ecology assessments.
Support for large-scale data?
Handles extensive datasets without performance lags.
Animations pre-included?
Selective animations enhance flow depictions.
Good for
- Project roadmaps and sprint plans
- Product launch timelines
- Quarterly or annual review decks
- Company history and milestone summaries
Licence
reviews
Hydropower flow charts and dam illustrations are detailed in this template. Used for energy sector briefing - water blue palette sets the right mood.
As a policy advisor, generation capacity comparisons came out clear. Editable for specific projects.
Practical for environmental impact assessments. Timelines for plant development helpful.
The dynamic flow visuals engage audiences well. Good slide variety.
Deadline project benefited from ready infographics. Professional output.
Turbine icons and output graphs are spot-on for technical talks.
FAQ
Will it work in Google Slides?
Are fonts embedded?
Can I use this for client work?
What's the refund policy?
Do you update the template after purchase?
Similar templates
See all PowerPoint Charts →
All 59 slides