 Click to zoom
Traffic Lights Keynote Charts Template: Illuminate Your Urban Traffic Strategies
| Format | .pptx |
| Slides | 16 unique layouts |
| Aspect ratio | 16:9 |
| Compatibility | PowerPoint |
| Animated | No |
| Language | English |
| License | Commercial |
| File size | — |
| Version | v1.0 |
| Last updated | October 2021 |
What's inside
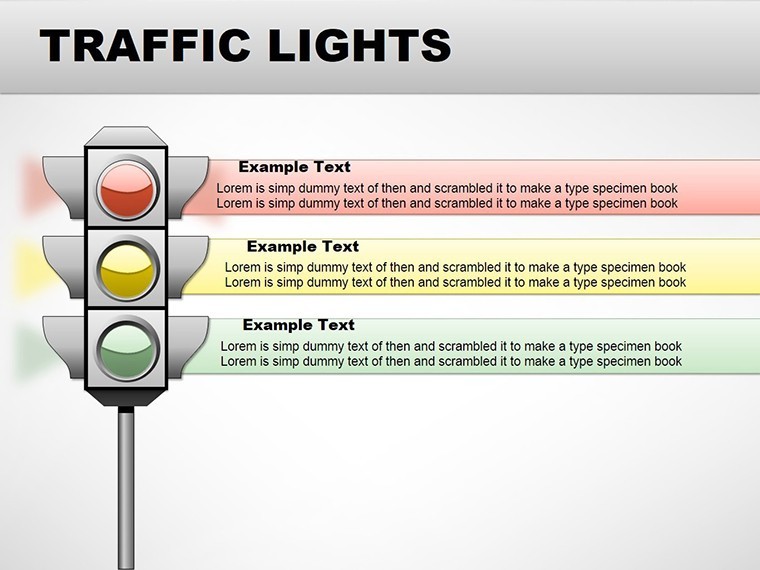
Navigating the complexities of city traffic requires more than words - it demands visuals that capture the essence of control and flow. Enter our Traffic Lights Keynote charts template, a game-changer for professionals in municipal roles, urban development, and safety education. With 16 editable slides emphasizing 3D models and illustrations, this resource turns abstract concepts like signal timings into tangible, engaging stories. Picture a municipal administrator presenting a new intersection plan: instead of dull lists, they use dynamic 3D renders to show how traffic lights reduce congestion, drawing from real data like that from the Institute of Transportation Engineers (ITE). This template caters to traffic police outlining enforcement, developers proposing smart city integrations, or educators teaching road rules to novices. Its benefits are clear - save time on design, ensure compatibility with Keynote (and exports to PowerPoint/Google Slides), and elevate your expertise with visuals that align with urban planning best practices. No more struggling with mismatched graphics; here, every slide is crafted to spotlight efficiency and safety. As we explore further, you'll see how these features translate into real-world wins, from boardroom approvals to community buy-in.
Standout Features for Dynamic Traffic Visualizations
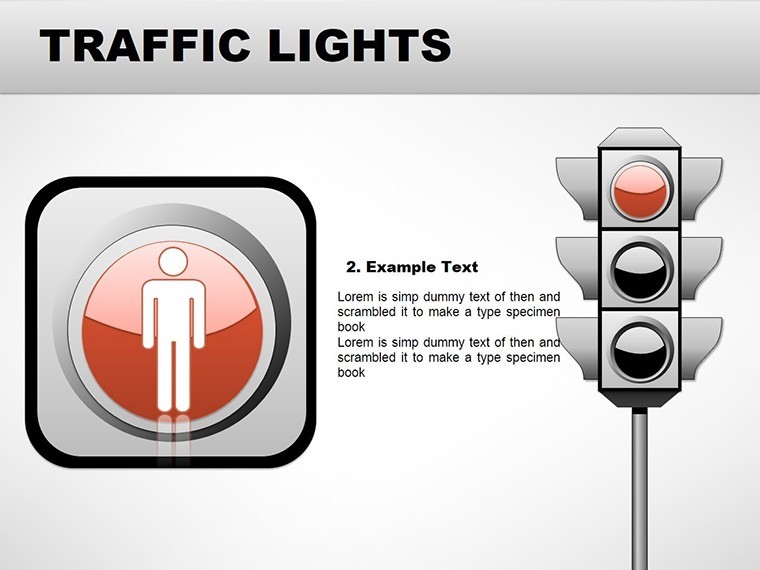
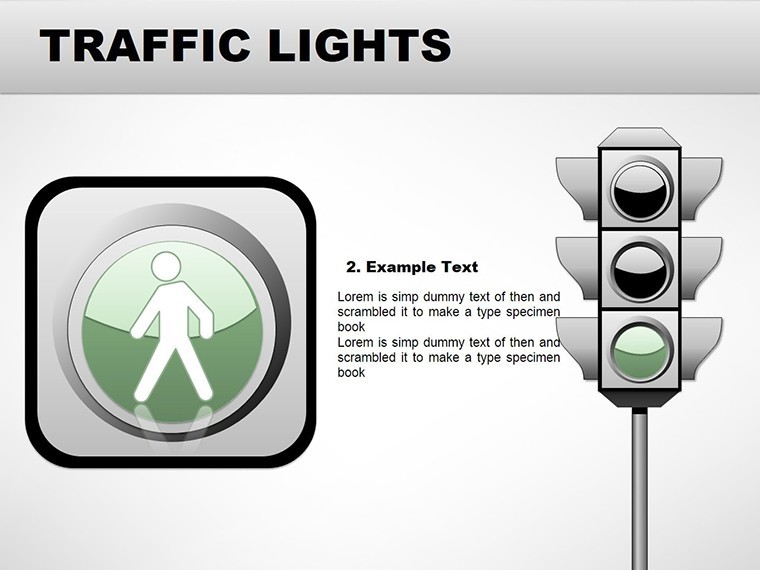
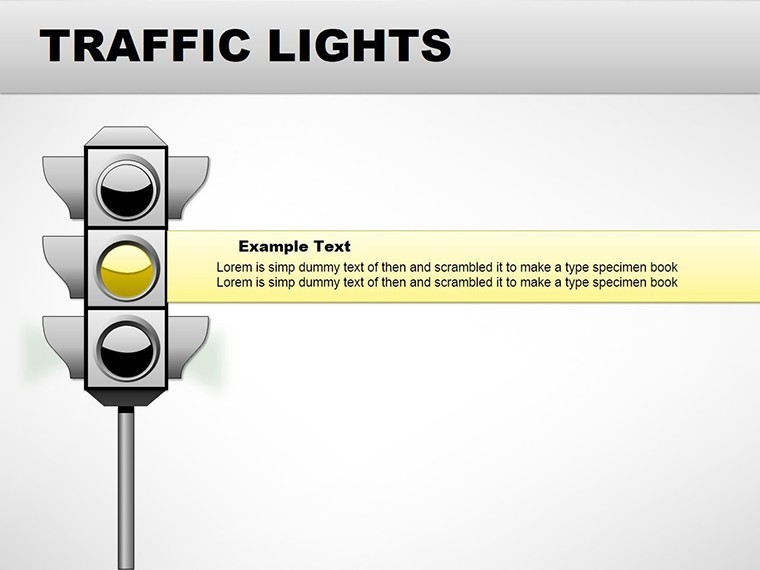
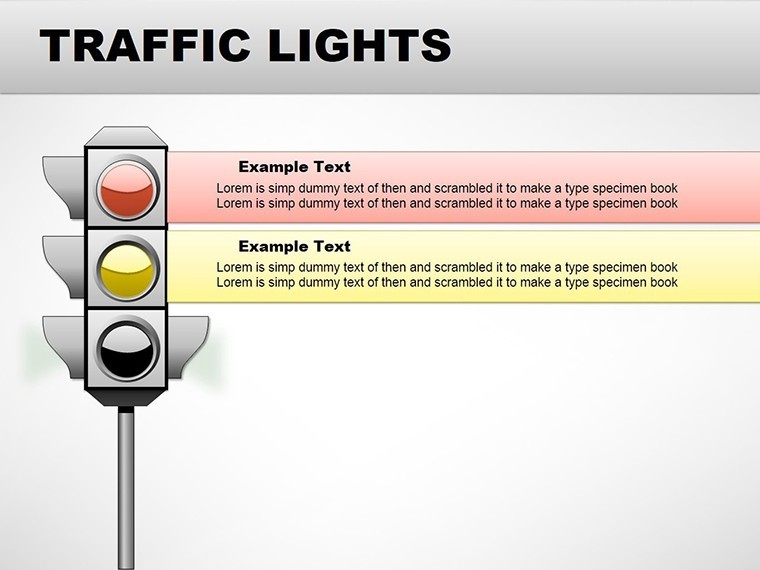
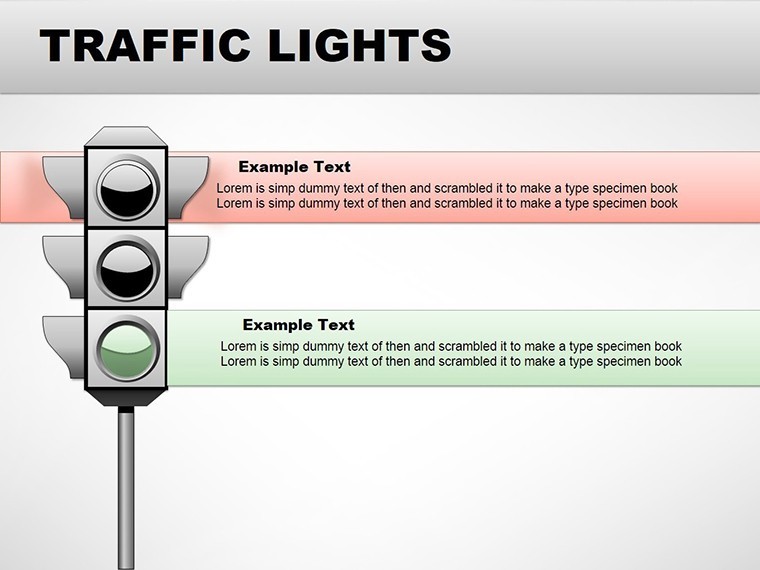
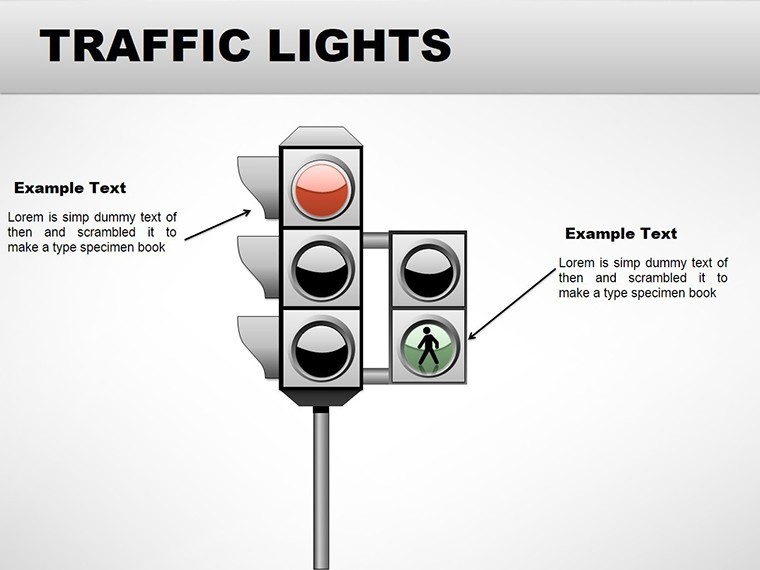
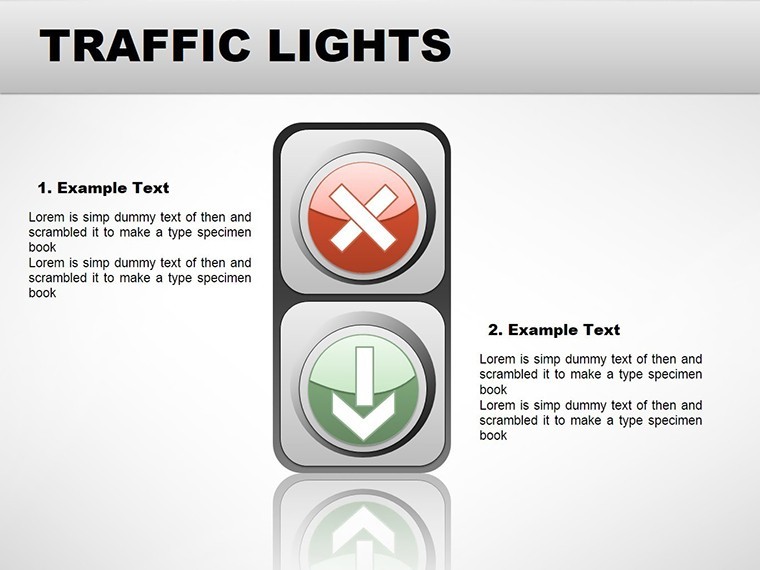
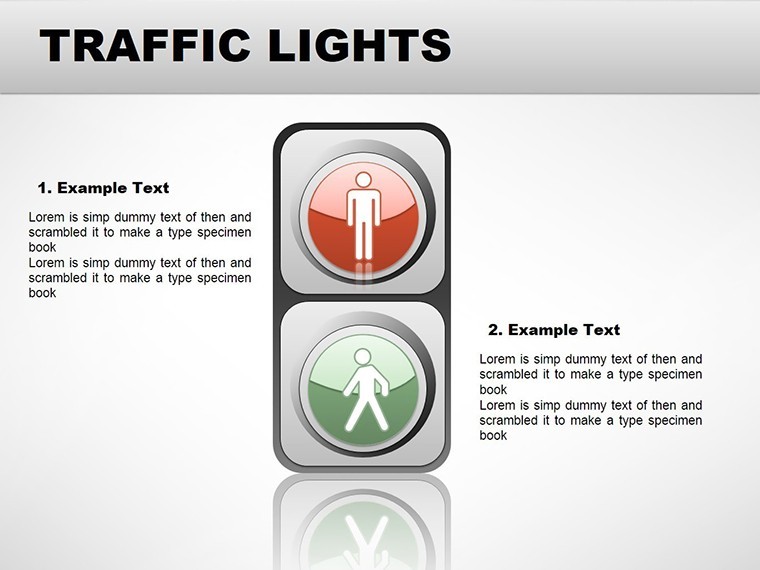
At the heart of this template are its 3D capabilities, setting it apart from flat, uninspiring alternatives. The 16 slides include lifelike traffic light models in various states - red for stop, green for go - integrated into illustrations of urban scenes. Categories like 3D and Illustrations mean you get depth: rotate views for multi-angle analysis or layer signals over street maps. Editable elements abound: tweak light phases to match local timings, adjust hues for thematic consistency, or insert metrics like average wait times. Drawing inspiration from urban design principles, such as those in the Urban Street Design Guide by NACTO, these charts build authority into your work. Forget generic Keynote tools; here, illustrations come with shadows and perspectives that make presentations pop, ideal for virtual meetings where visual fidelity matters. Plus, seamless integration with other software ensures your team can collaborate without hiccups.
In-Depth Look at the Slides: Building Blocks for Success
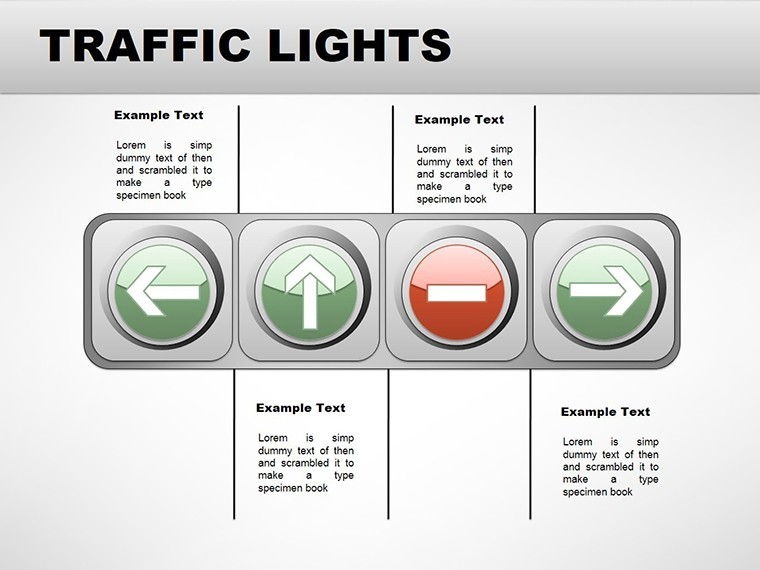
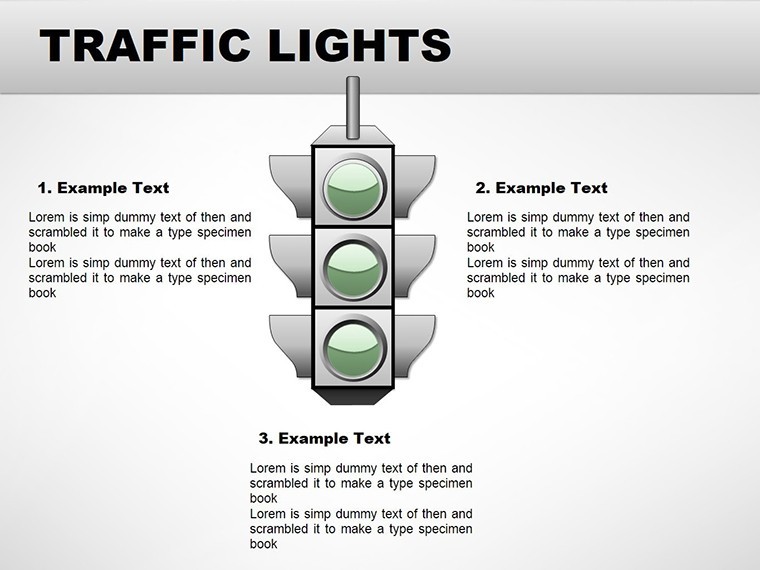
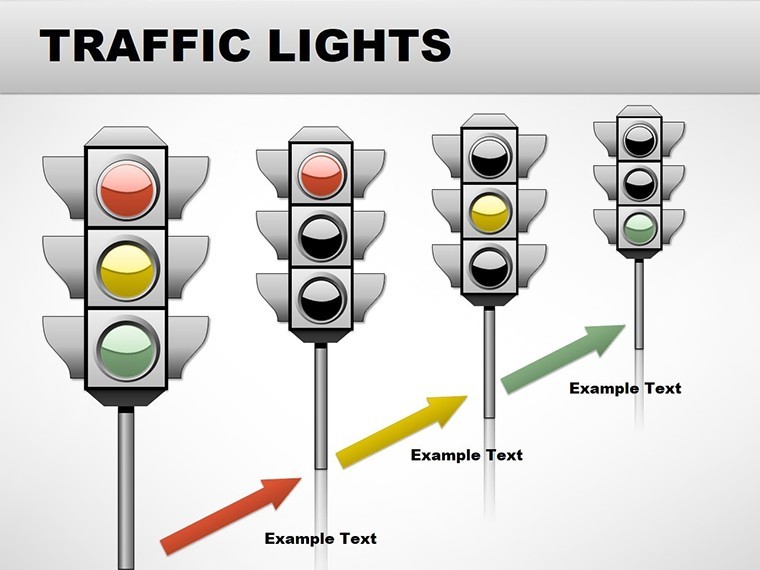
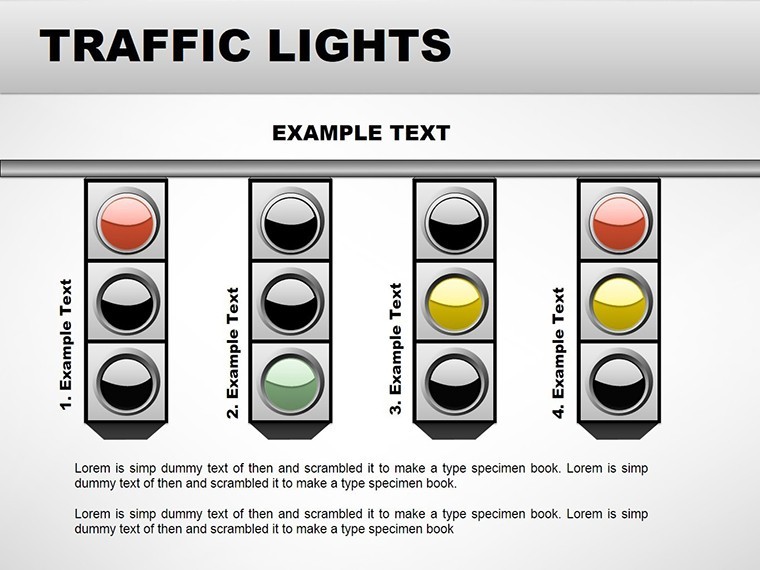
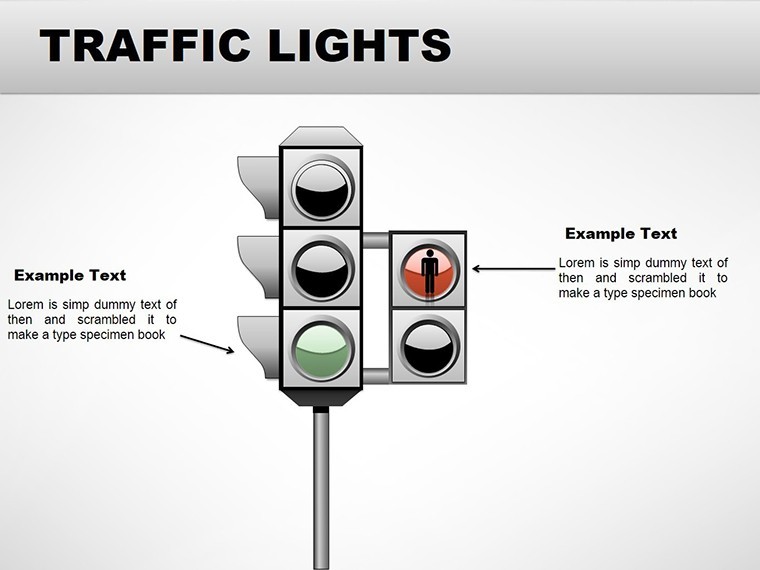
Diving into specifics, Slide 1 offers a 3D overview of a standard traffic light cycle, perfect for introductory explanations. Slides 2-4 delve into illustrations of phased sequences, with editable timelines showing synchronization across intersections. Midway, slides 5-8 feature 3D models in context - like lights at pedestrian crossings, complete with annotations for sensor tech. Slides 9-12 combine elements for scenario building: illustrate emergency vehicle preemption or adaptive signals responding to traffic volume. The closing slides, 13-16, provide blank canvases for custom integrations, such as embedding traffic flow data from tools like Synchro software. Each includes smart guides for alignment, ensuring professional polish even for design novices.
Practical Use Cases: From Planning to Implementation
Consider a urban development department pitching a smart traffic system upgrade. Using this template, they craft a narrative around 3D charts showing before-and-after congestion stats, citing successes like Singapore's intelligent transport systems that cut delays by 20%. Traffic police might use illustrations to train officers on signal violations, reducing errors through visual simulations. For municipal admins, slides help in budget justifications, visualizing ROI on LED upgrades per EPA energy savings data. Motorists and students benefit from educational decks breaking down rules - think interactive 3D views of flashing yellows versus solids. In one real-world example, a city council used similar visuals to gain approval for a new light installation, speeding up the process by weeks. This template addresses common pitfalls like overcomplicated diagrams by prioritizing clarity, making it indispensable for stakeholder engagements.
Pro Tips to Enhance Your Traffic Light Presentations
- 3D Optimization: Use Keynote's animation tools to simulate light changes, adding realism without complexity.
- Data Fusion: Import CSV files into editable fields for real-time updates on traffic metrics.
- Collaboration Hacks: Export to Google Slides for team edits, then re-import for final Keynote tweaks.
- Visual Storytelling: Layer illustrations over photos of actual sites for hyper-local relevance.
- Sustainability Angle: Highlight eco-friendly aspects, like solar-powered lights, with custom icons.
These insights, honed from urban planning expertise, ensure your presentations not only inform but inspire action.
Advantages Over Conventional Chart Tools
Why settle for 2D when 3D brings depth? Basic Keynote charts lack the immersion needed for traffic topics, often resulting in disengaged audiences. This template counters with volumetric models that convey scale - like towering signal poles in cityscapes - fostering better understanding. Versus competitors, it offers more editable layers, allowing for intricate customizations without starting over. Users in forums like Urban Planning Reddit praise such tools for halving prep time. Its trustworthiness shines through compatibility features, ensuring no format losses in cross-platform shares. Ultimately, it's about delivering value: authoritative, visually stunning slides that position you as a leader in traffic management.
With traffic demands evolving, equip yourself with tools that keep pace. This Traffic Lights Keynote charts template lights the way to superior presentations. Ignite your next project - download and customize now.
Frequently Asked Questions
What makes the 3D elements editable?
You can rotate, resize, and recolor 3D models directly in Keynote for tailored visualizations.
Does it support integration with urban planning software?
Yes, embed data from tools like GIS or Synchro into slides for enhanced accuracy.
Is export to other formats lossless?
Exports to PowerPoint or Google Slides preserve most elements, with minor adjustments possible.
Suitable for beginner users?
Absolutely, with intuitive placeholders and guides for easy editing.
Can I add animations to the lights?
Keynote's built-in animations let you simulate sequences effortlessly.
Good for
- Project roadmaps and sprint plans
- Product launch timelines
- Quarterly or annual review decks
- Company history and milestone summaries
Licence
reviews
The 3D traffic light models in different states were perfect for my urban planning presentation about intersection design.
Used the phased sequence slides for a transportation safety training and the signal timings were easy to edit.
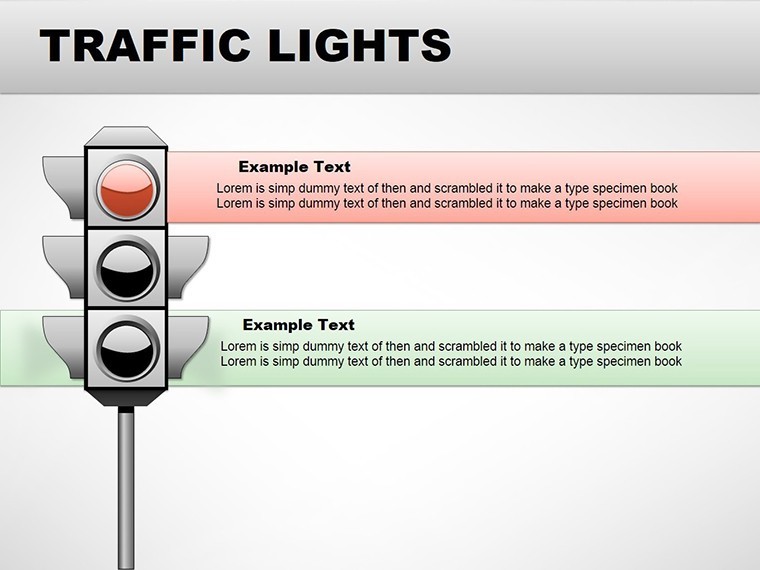
The red-yellow-green dashboards helped me show project status without writing long explanations.
The smart city integration slides worked well but some of the 3D views rotated awkwardly on export.
Good for traffic management presentations but the technical illustrations might be overkill for simple updates.
FAQ
Will it work in Google Slides?
Are fonts embedded?
Can I use this for client work?
What's the refund policy?
Do you update the template after purchase?
Similar templates
See all Keynote Charts →


All 16 slides