 Click to zoom
Supply Pipe Keynote Diagrams: 3D Visuals for Operational Flows
| Format | .pptx |
| Slides | 14 unique layouts |
| Aspect ratio | 16:9 |
| Compatibility | PowerPoint |
| Animated | No |
| Language | English |
| License | Commercial |
| File size | — |
| Version | v1.0 |
| Last updated | February 2026 |
What's inside
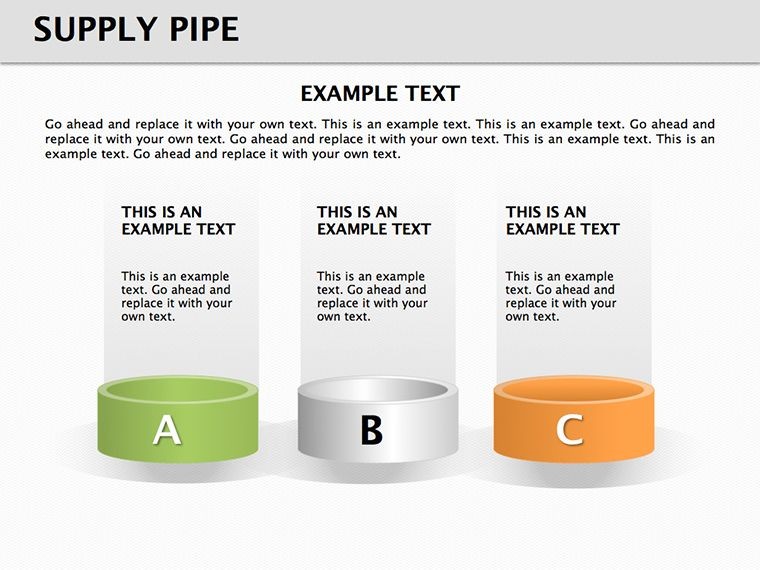
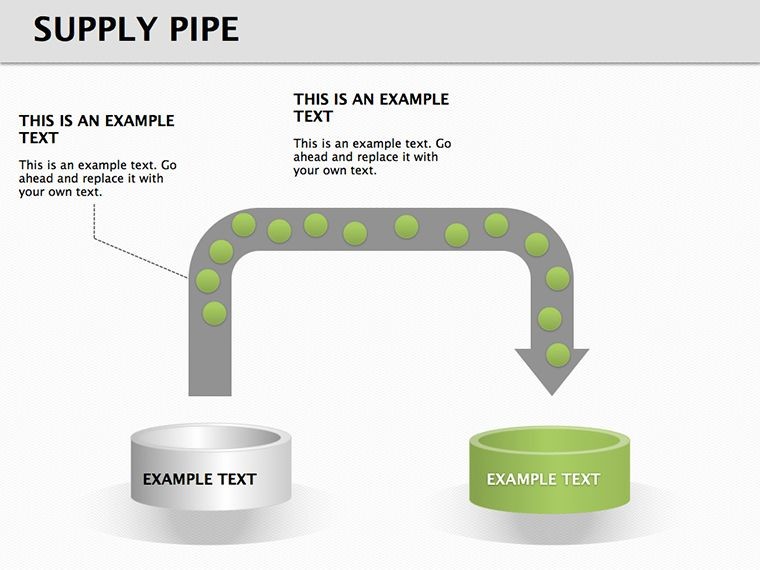
Amid the pipelines of industry, where data flows like resources through conduits, the Supply Pipe Keynote Diagrams template offers a robust framework. Featuring 14 editable 3D slides, it's designed for analysts, operations managers, and planners to depict supply chains and processes with vivid clarity. Visualize oil refinery flows or data pipelines in IT, using pipe metaphors to illustrate volumes and directions - this tool demystifies complexities. Grounded in supply chain methodologies from the Council of Supply Chain Management Professionals (CSCMP), it solves visualization gaps in traditional slides. For logistics experts presenting at conferences or internal teams optimizing workflows, it incorporates principles from lean six sigma, as explored in Quality Progress magazine. Turn convoluted data into streamlined stories, enhancing strategic planning and operational efficiency.
Key Features for Flow Optimization
Pipe structures in 3D allow for volume representations, with adjustable diameters symbolizing capacities. Keynote-native, it supports fluid animations and color coding for phases, exceeding basic diagrams in depth and interactivity.
Varied Pipe Diagram Configurations
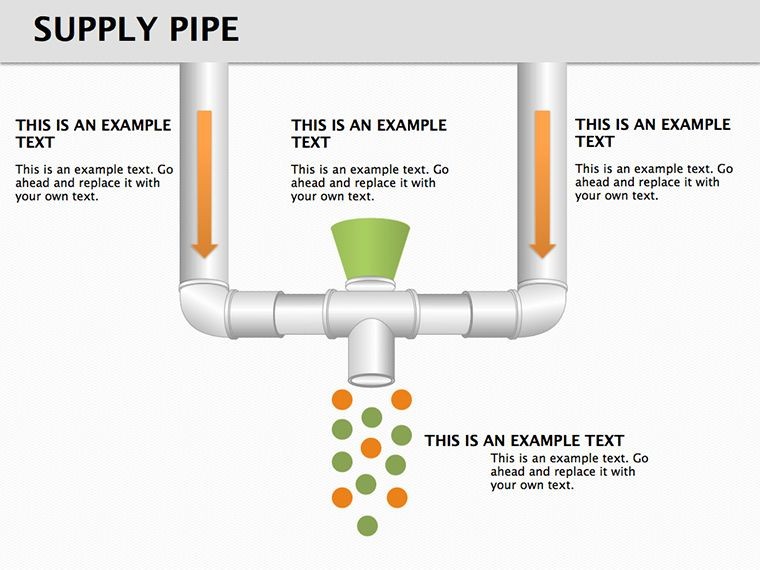
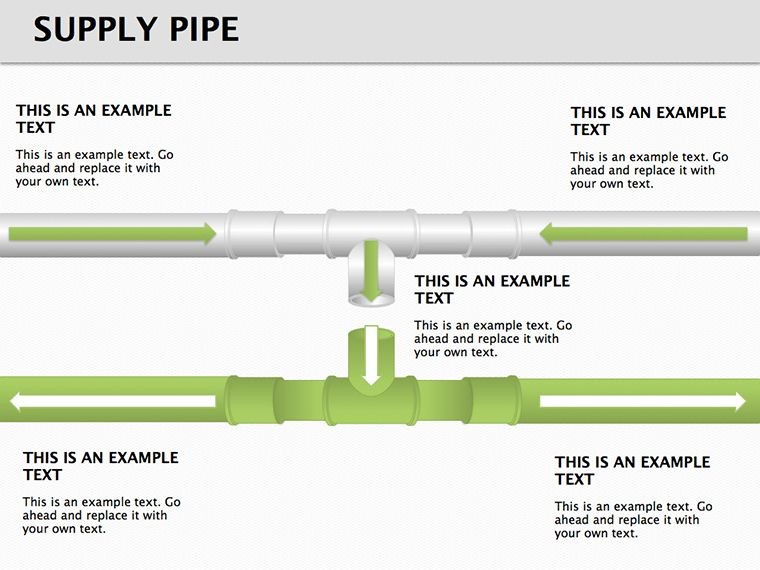
- Straight Supply Pipes: Linear flows for simple supply routes, like inventory from warehouse to retail.
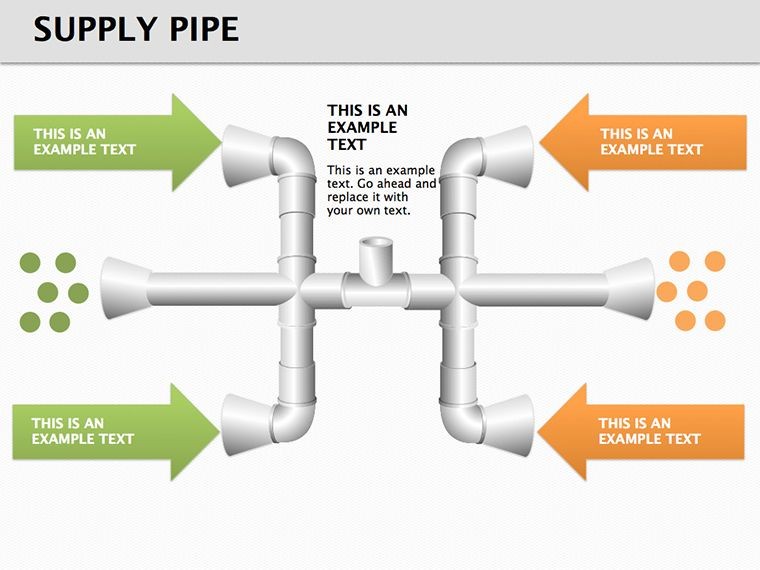
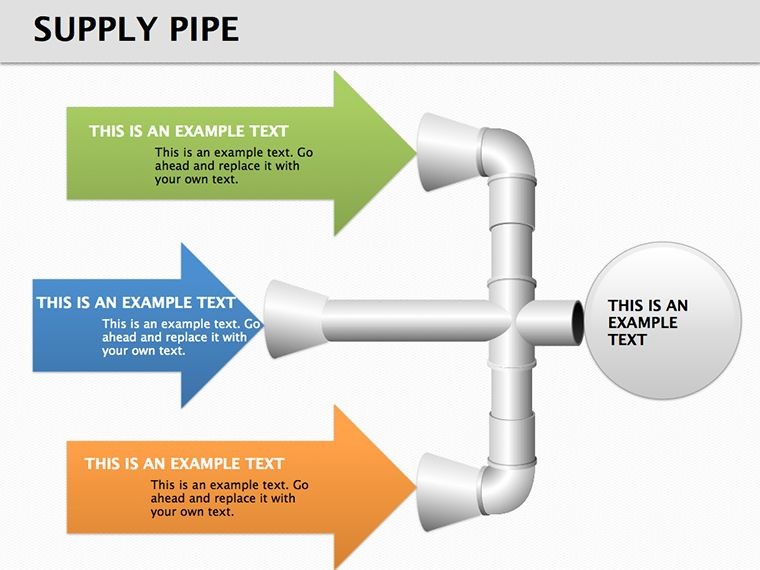
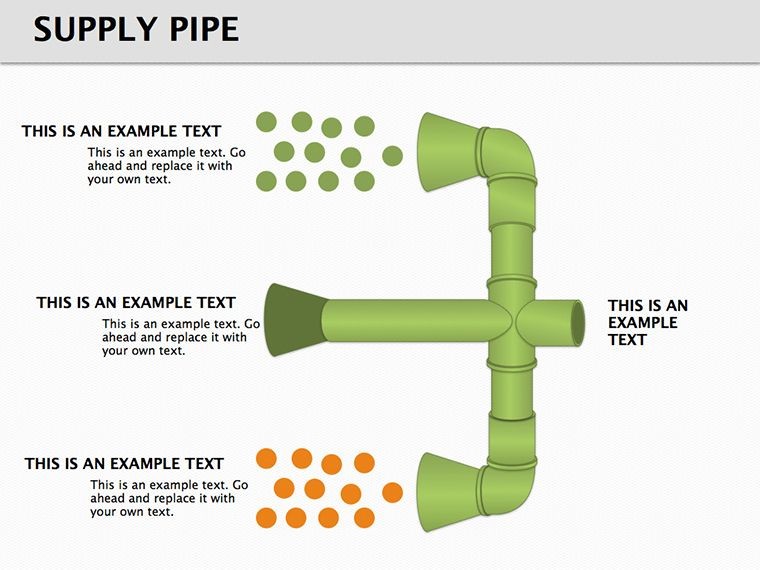
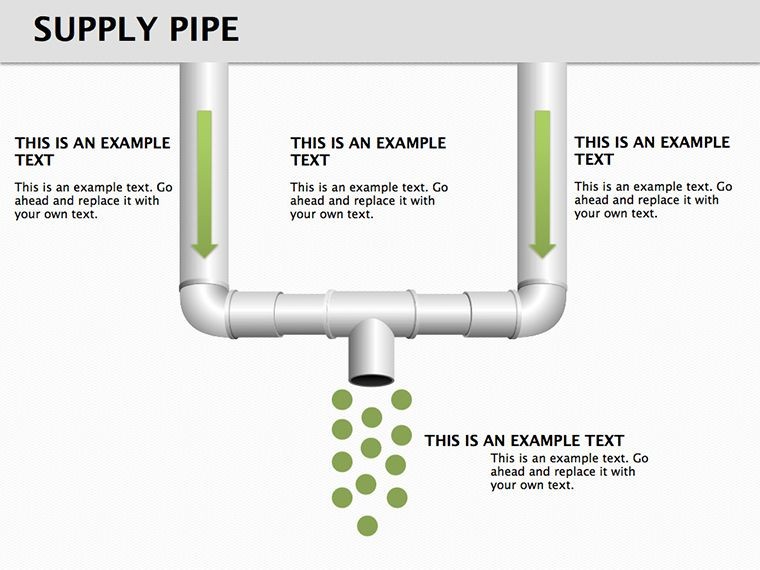
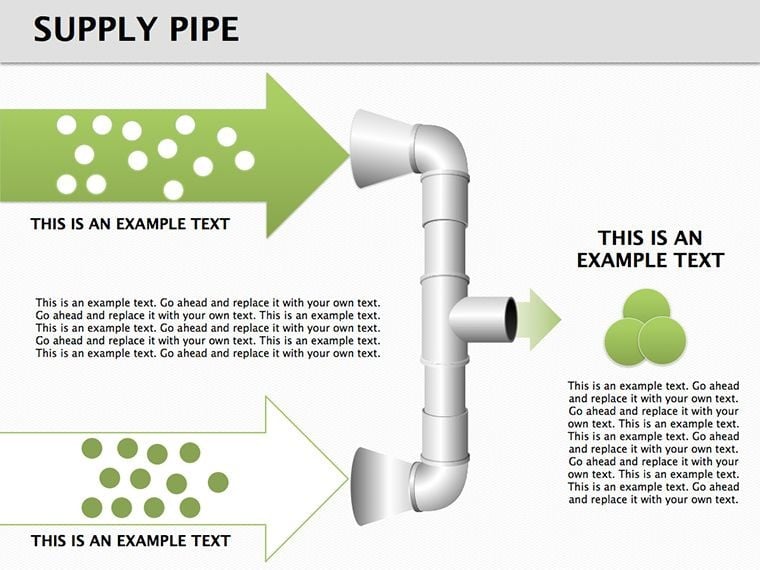
- Branching Networks: For divergent paths, such as distribution hubs in e-commerce.
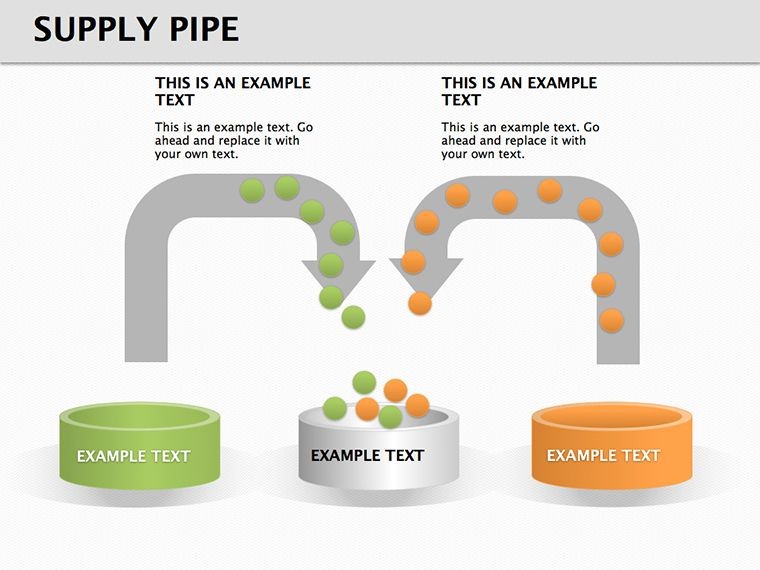
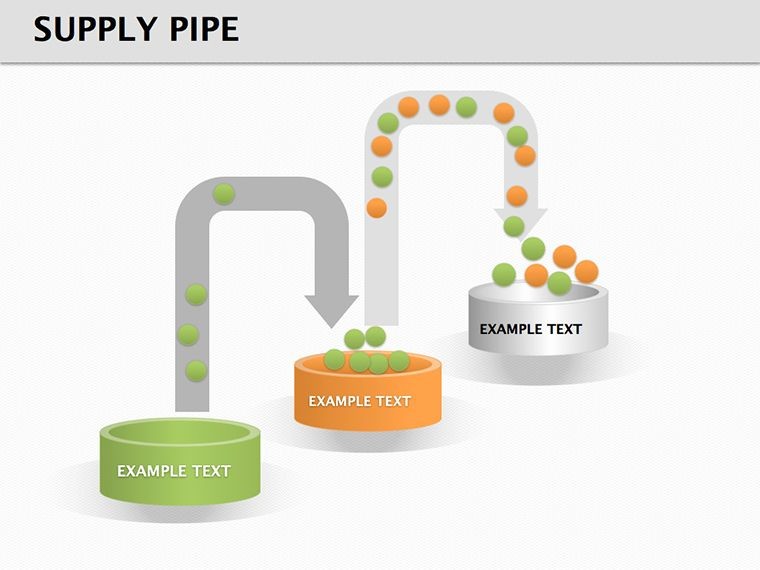
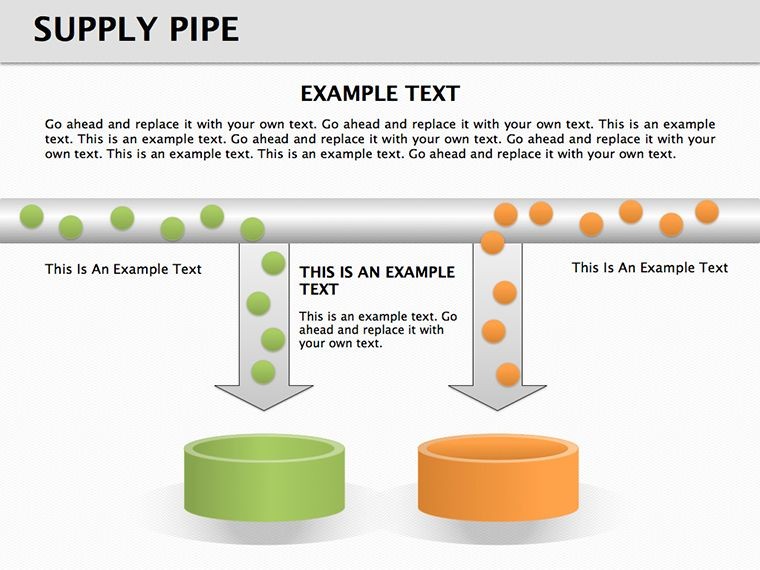
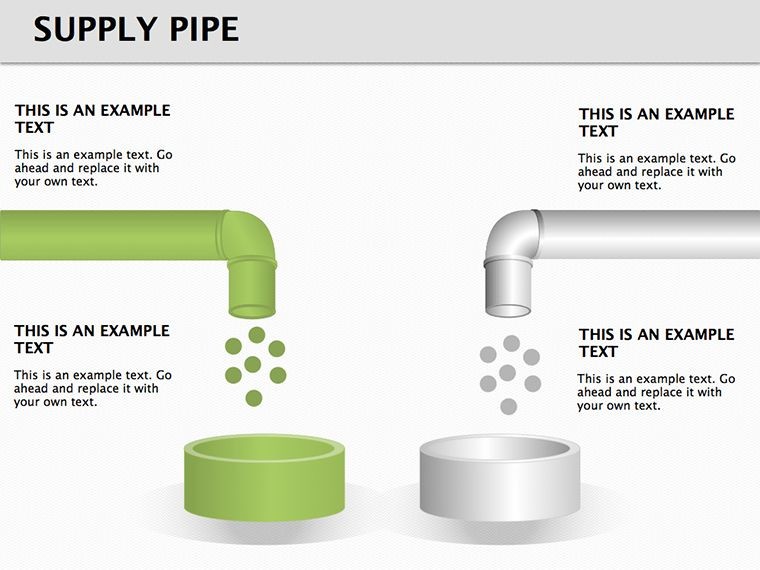
- Volume Indicators: Balls or fills representing quantities, customizable for metrics.
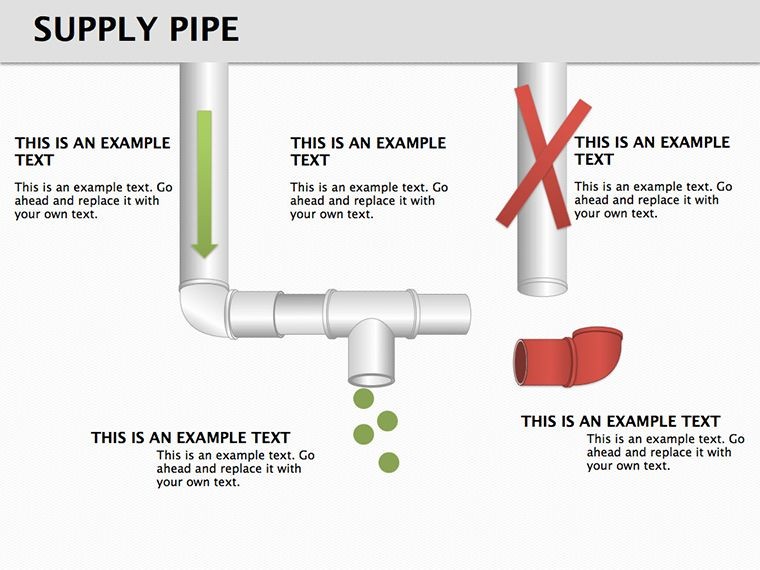
- Constraint Visuals: Narrowings for bottlenecks in production analysis.
- Integrated Analytics: Overlay charts on pipes for KPI tracking.
Informed by fluid mechanics analogies for intuitive grasp.
Real-Life Implementation Examples
An operations analyst at Amazon might map fulfillment pipelines, reducing delays by 20% via visualized insights, per Supply Chain Management Review. In energy sectors, it could detail gas supply networks, aiding regulatory presentations.
Workflow for Tailored Diagrams
- Pick Pipe Type: Based on flow complexity.
- Define Segments: Label with process steps.
- Scale Volumes: Adjust for accurate representations.
- Enhance with Data: Add real-time indicators.
- Test Dynamics: Animate for presentation impact.
Facilitates quick iterations.
Benefits in Analytical Depth
Promotes bottleneck identification, outperforming flat visuals with thematic elements like valve icons.
Channel efficiency into your slides - obtain this template and flow ahead.
FAQ
Why use pipe metaphors?
They intuitively represent flows and capacities in supply contexts.
Can I animate the flows?
Yes, built-in animations simulate movement.
Suitable for non-technical users?
Intuitive interface makes it user-friendly.
How to handle complex networks?
Layer multiple pipes for intricate visuals.
Export options available?
PDF, image, or video for versatility.
Good for
- Project roadmaps and sprint plans
- Product launch timelines
- Quarterly or annual review decks
- Company history and milestone summaries
Licence
reviews
Some of the arrows looked too big at first but after editing it was fine.
I used these slides for a marketing recap and it saved me from doing manual charts.
The template feels simple in a good way.
My coworker borrowed this after seeing the layout in our meeting.
I just needed something readable and these diagrams worked.
FAQ
Will it work in Google Slides?
Are fonts embedded?
Can I use this for client work?
What's the refund policy?
Do you update the template after purchase?
Similar templates
See all Keynote Diagrams →


All 14 slides