 Click to zoom
Streamline Insights: Tables Business Report PowerPoint Charts
| Format | .pptx |
| Slides | 19 unique layouts |
| Aspect ratio | 16:9 |
| Compatibility | PowerPoint |
| Animated | No |
| Language | English |
| License | Commercial |
| File size | — |
| Version | v1.0 |
| Last updated | March 2023 |
What's inside
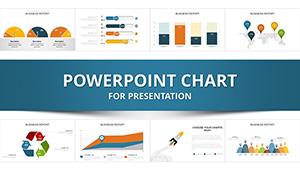
Envision boardrooms where data doesn't drown discussions but drives them - crisp tables that unpack sales surges or trend turns with surgical precision. This tables business report PowerPoint template delivers exactly that: 19 editable slides of structured sophistication, from pivot grids to cross-tabs, all primed for your quarterly deep dives. Aimed at analysts, managers, and execs battling spreadsheet sprawl, it reclaims presentation time, letting numbers narrate without the noise.
In the high-stakes arena of business reporting, where clarity equals currency, this template is your edge. Aligned with data viz tenets from Edward Tufte's canon, it confronts the chaos of raw exports, morphing them into scannable summaries that spotlight anomalies and opportunities. Whether auditing Q4 finances or benchmarking KPIs, it empowers storytellers to focus on strategy, not styling - turning reports from rote to revelatory.
Precision Building Blocks: Mastering Table Types and Tweaks
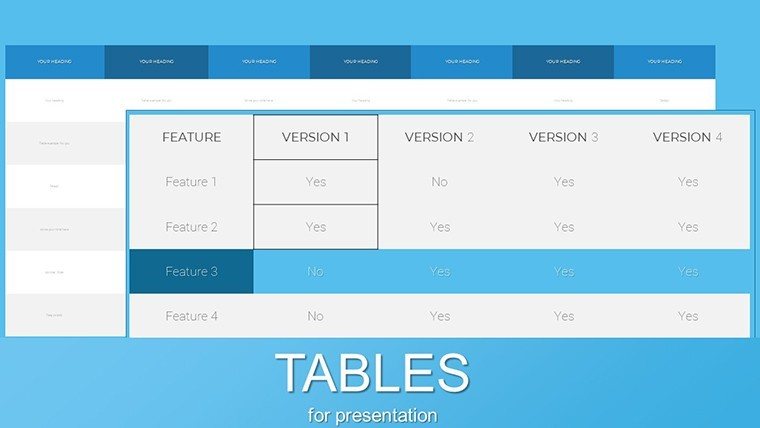
From elemental lists to analytical pivots, each slide is a scaffold for success. Simple formats suit snapshot views, while advanced cross-tabs dissect multidimensional data.
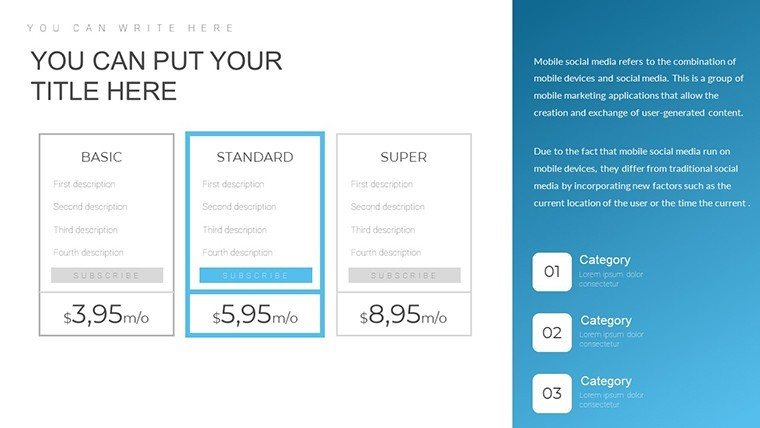
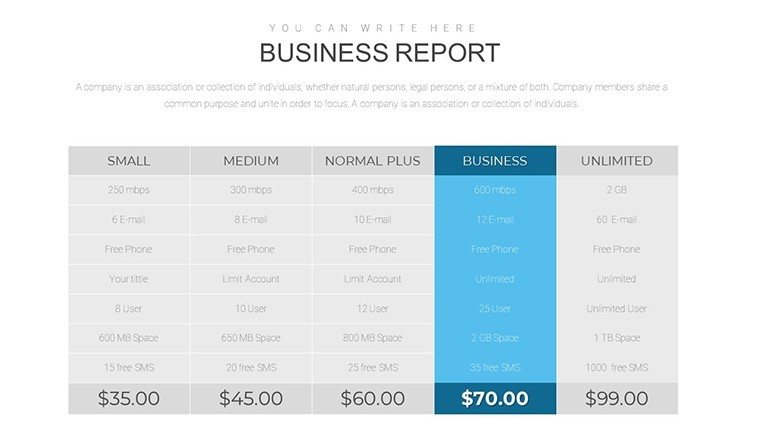
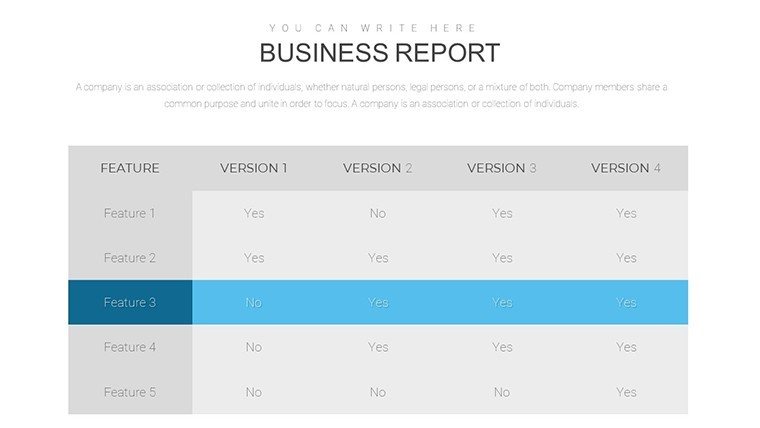
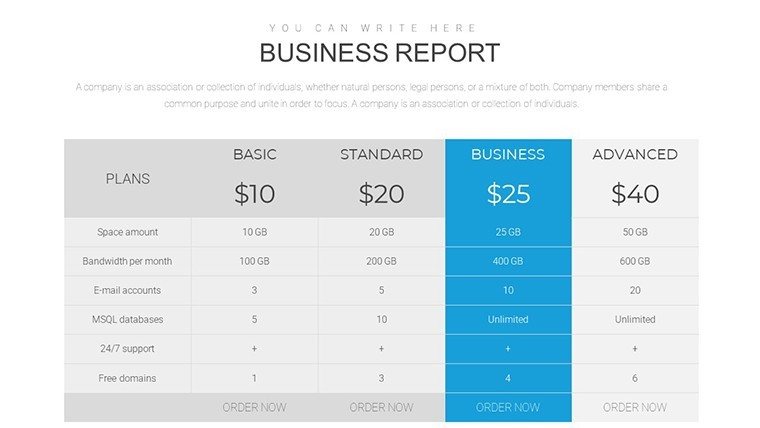
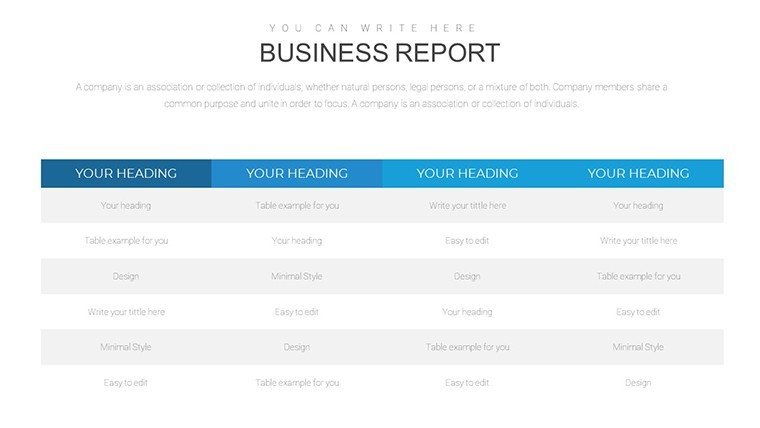
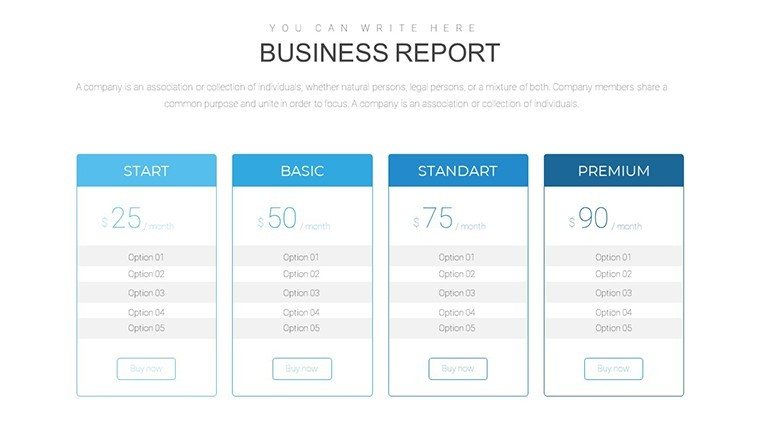
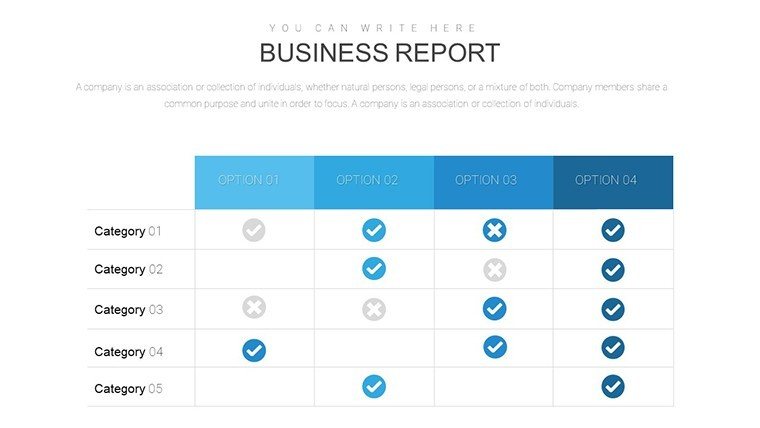
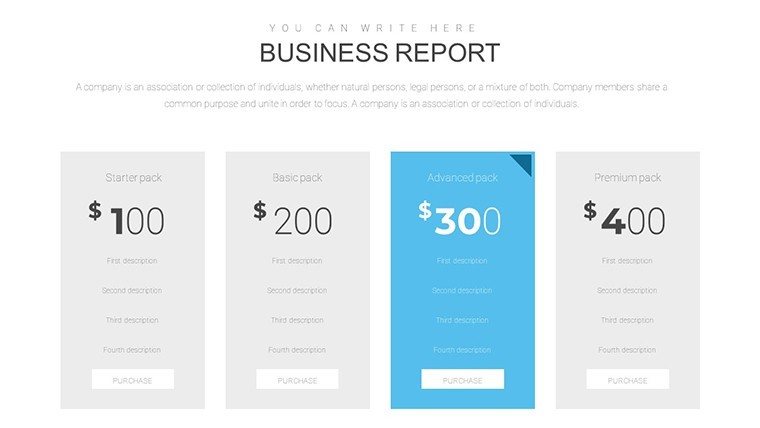
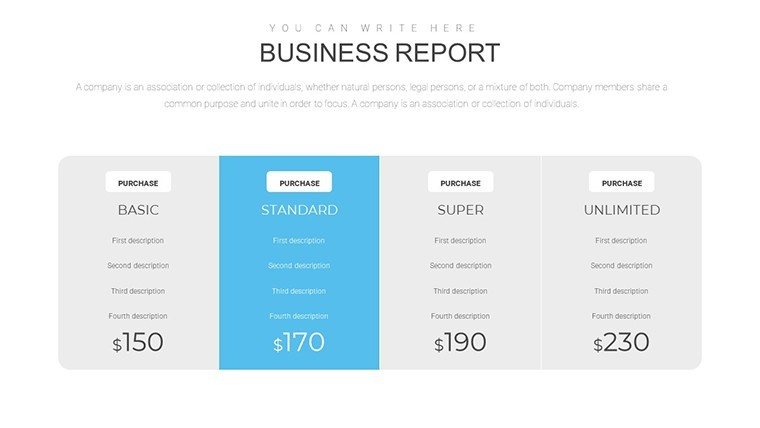
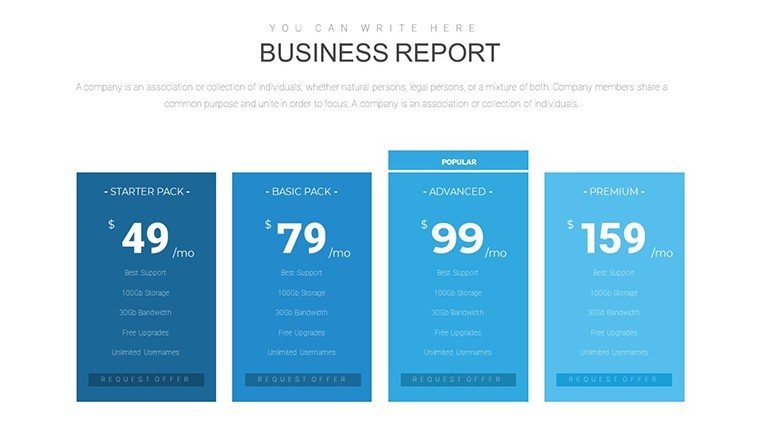
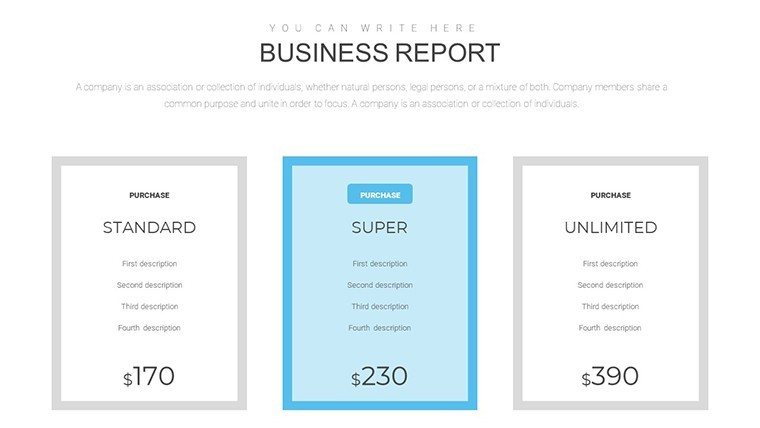
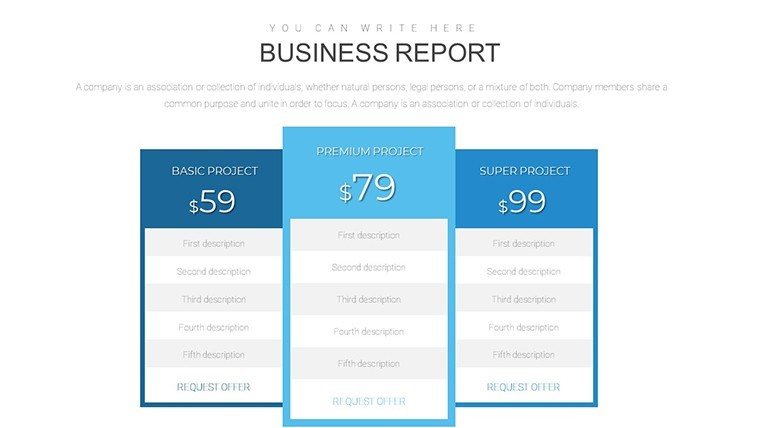
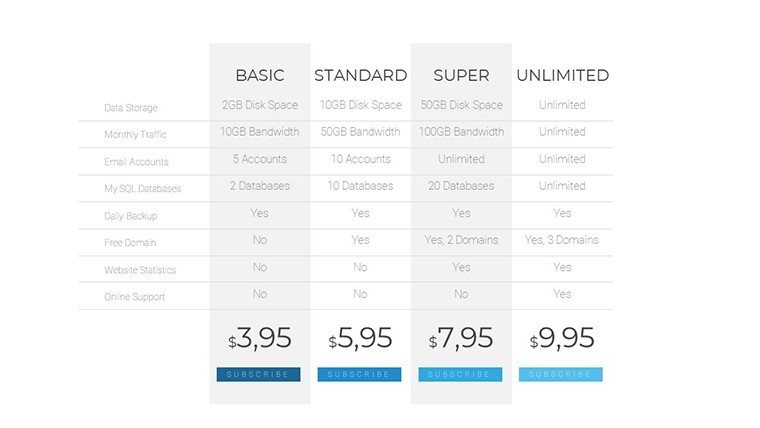
- Comparative Grids (Slides 1-5): Side-by-side columns for quarter-over-quarter sales, with conditional formatting for variances - echoing tools in Fortune 500 dashboards.
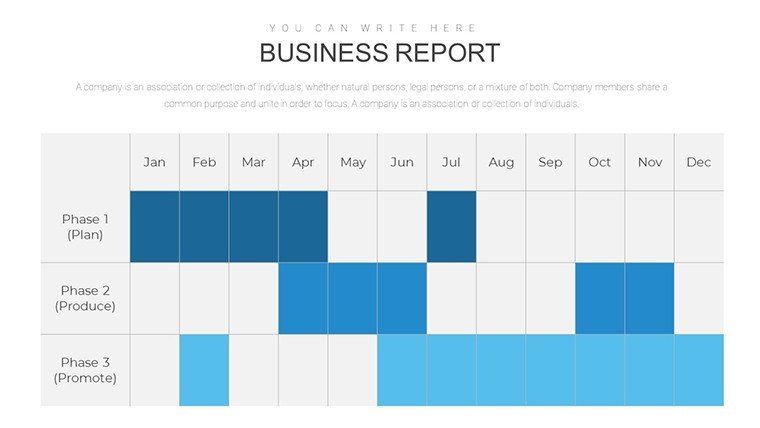
- Trend Trackers (Slides 6-10): Row-spanning timelines for metric evolutions, sortable for on-the-fly filters during earnings calls.
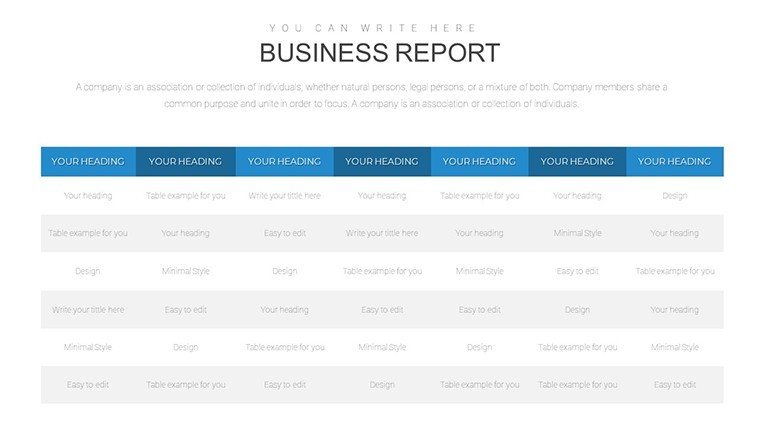
- Insight Matrices (Slides 11-15): Nested subtotals for departmental breakdowns, ideal for HR headcounts or marketing ROI.
- Summary Aggregates (Slides 16-19): Footer-calculated totals with sparklines, embedding mini-trends for at-a-glance depth.
PowerPoint 2019+ ready, with Google Slides sync for distributed reviews. Uniform styling - Arial bold headers, subtle borders - ensures cohesion, editable via theme overrides.
Case Studies in Clarity: Reports That Resonate
A fintech startup in Austin wielded the pivot slide to correlate transaction volumes with churn rates, averting a 15% dip per internal audits. "Tables became our truth serum," quips the CFO. In retail, a chain mapped inventory turns against seasonal spikes, optimizing stock per Nielsen analytics.
For consultants, it's briefing gold: Cross-tabs juxtapose client benchmarks, arming recommendations with visual punch. Non-profits use summary views to align donor impacts with goals, per Charity Navigator metrics.
- Define Objectives: Pinpoint report aims - e.g., variance analysis - then select fitting formats.
- Source & Scrub: Pull from CRM/ERP, validating accuracy before import.
- Format Fluidly: Align cells, merge for headers, and freeze panes for scroll-proof views.
- Validate Vision: Cross-check sums, seeking peer input for blind spots.
This cadence cuts prep by 60%, rivaling BI suites sans subscription.
Superior Structure: Why These Tables Triumph
Excel dumps? Clunky and cryptic. Here, responsive rows auto-fit content, with merged cells for hierarchy sans hassle. Embed formulas for live recalcs, future-proofing updates.
In compliance-heavy sectors like finance, audit trails via version history uphold SOX standards. For sales teams, sortable headers enable drill-downs, unearthing leads mid-meet.
Navigating Report Realities
Info avalanches? Limit rows to 20, prioritizing via heat maps - per cognitive science, reducing scan fatigue. Accessibility: Semantic headers for screen readers, meeting WCAG tiers.
Hybrid hybrids: Link to shared drives for collab, or export to PDFs for archival integrity. In global ops, currency converters in cells handle forex flux.
Refine & Report: Pro Polishes
Anchors away: Bold key cells, zebra-stripe alternates for readability. Narrate with footnotes, contextualizing outliers like market shocks.
Close strong: A grand total slide synthesizing themes, priming Q&A. It's reporting reimagined - data as ally, not adversary.
Fortify your fiscal fluency with this tables business report PowerPoint charts template. Download, deploy, dominate your data destiny.
Frequently Asked Questions
What makes these business report tables effective?
Structured for quick scans, with consistent formatting and meaningful headings to highlight trends and findings.
Can I customize table formats for specific data?
Yes - choose from simple, pivot, or cross-tab styles, all editable to fit your analytics needs.
Does it integrate with external data sources?
Seamlessly - link to Excel for dynamic updates, keeping reports current without manual re-entry.
How many slides are in the template?
19 versatile ones, covering comparisons, trends, and summaries for comprehensive reporting.
Is it suitable for non-finance business areas like marketing?
Absolutely - adapt for campaign metrics or audience segments with ease.
What about printing or sharing these tables?
Optimized for high-res print and PDF exports, ensuring clarity across formats.
Good for
- Project roadmaps and sprint plans
- Product launch timelines
- Quarterly or annual review decks
- Company history and milestone summaries
Licence
reviews
Not my favorite, the slide structure felt a bit messy but it's free so whatever.
Perfect for my team's Q3 review, especially the comparison charts section.
A bit too basic for what I needed, ended up modifying most of it.
The map graphics look nice but they're not very accurate for smaller regions.
Downloaded this, dropped in my data, and the pie charts updated easily.
FAQ
Will it work in Google Slides?
Are fonts embedded?
Can I use this for client work?
What's the refund policy?
Do you update the template after purchase?
Similar templates
See all PowerPoint Charts →

All 19 slides