 Click to zoom
Strategy Adjustment Keynote Diagrams: Pivot with Precision and Power
| Format | .pptx |
| Slides | 13 unique layouts |
| Aspect ratio | 16:9 |
| Compatibility | PowerPoint |
| Animated | No |
| Language | English |
| License | Commercial |
| File size | — |
| Version | v1.0 |
| Last updated | September 2023 |
What's inside
In the fast-paced arena of business strategy, where one misstep can cascade into chaos, clarity isn't a luxury - it's your lifeline. Our Strategy Adjustment Keynote Diagrams template delivers just that: 13 meticulously designed, editable slides that dissect and realign your plans with surgical accuracy. Aimed at C-suite executives navigating market turbulence or consultants recalibrating client roadmaps, this set uses 3D illustrations to make abstract adjustments feel concrete and compelling.
Envision 3D models rotating to expose vulnerabilities in your supply chain, or illustrated matrices quantifying ROI shifts post-merger. Compatible with Keynote's robust ecosystem - and exportable to PowerPoint or Google Slides - these slides let you layer in real-time data from tools like Tableau, color-shifting indicators from green (optimal) to amber (alert). With only 13 slides, it's lean yet loaded, focusing on high-impact visuals that cut through boardroom fog, ensuring your adjustments aren't just proposed but propelled.
Why does this matter? McKinsey reports that companies excelling in strategic agility outperform peers by 5x in revenue growth. Here, diagrams bridge that gap: Transform quarterly reviews from monotonous spreadsheets into dynamic dialogues, where stakeholders grasp the "why" behind a pivot - be it entering a new market or trimming overheads. Users rave about how these tools turned a routine Q3 reassessment into a unanimous approval, saving weeks of back-and-forth.
Core Components: The 3D Edge in Strategic Visualization
This template shines through its blend of depth and detail. 3D renders provide multi-angle views of strategy layers, while illustrations soften the tech with approachable icons - gears for processes, arrows for trajectories. Each slide targets a facet: assessment grids, indicator dashboards, adjustment funnels.
- Quantitative Foundations: Built-in formulas for metrics like NPV calculations, aligned with CFA Institute benchmarks for financial clarity.
- Illustrative Flair: Custom icons that narrate stories, e.g., a cracking foundation for risk exposure, repairable with drag-and-drop fixes.
- Adaptive Animations: Smooth 3D spins reveal before-and-after states, pacing your pitch like a seasoned strategist.
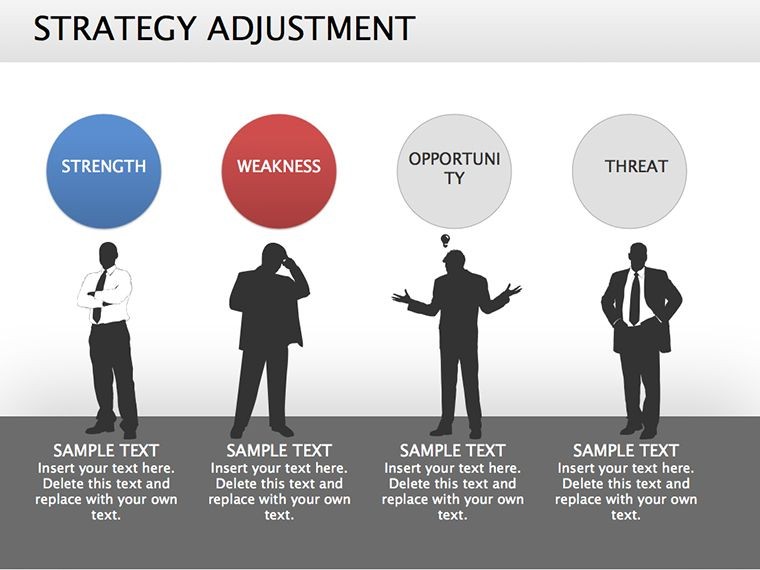
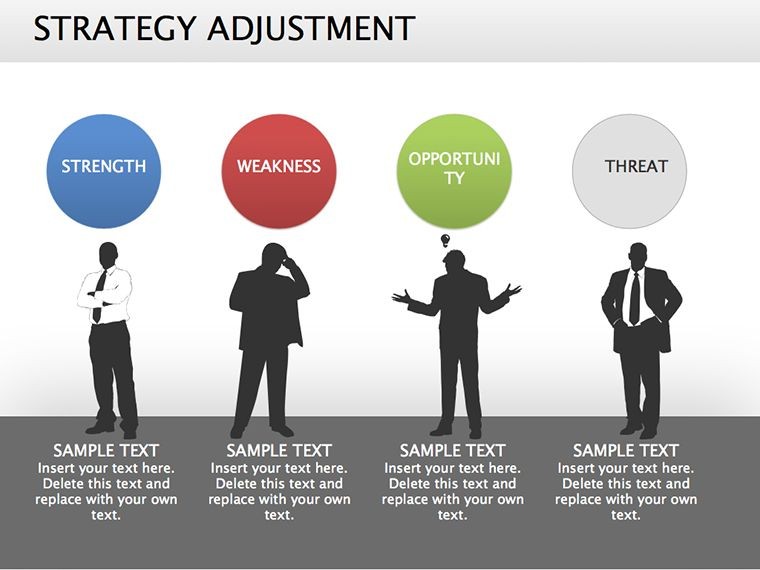
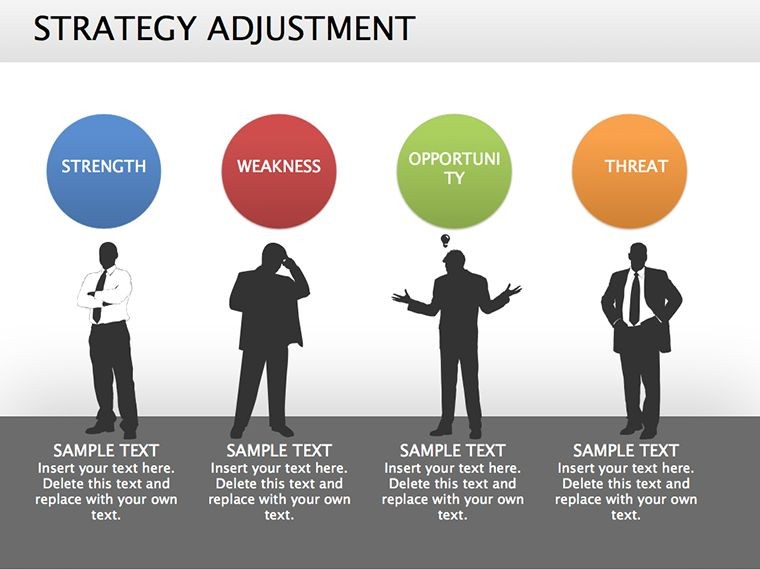
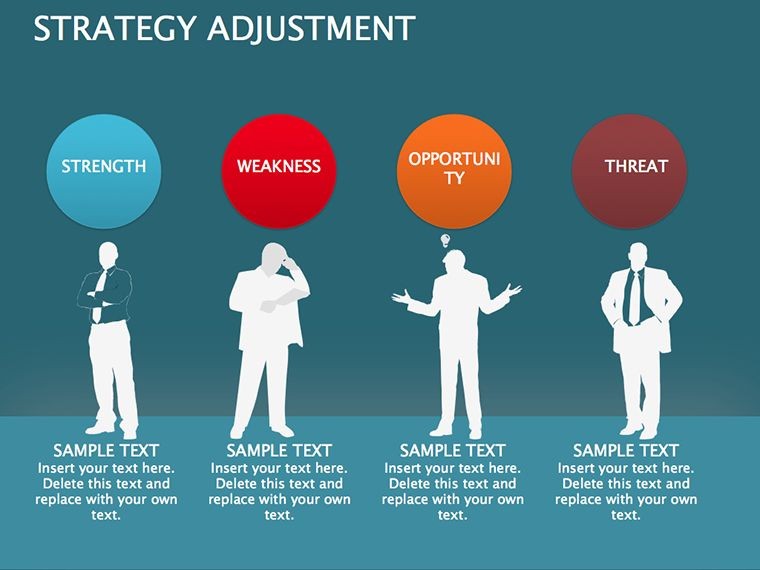
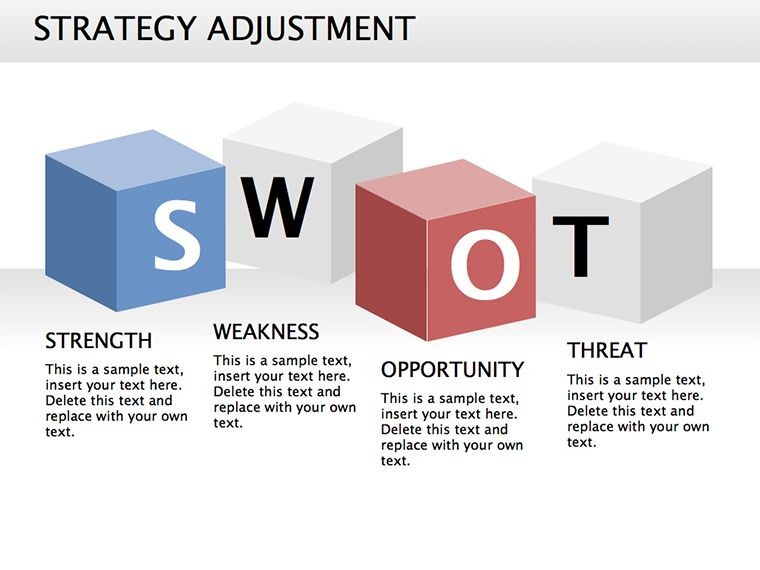
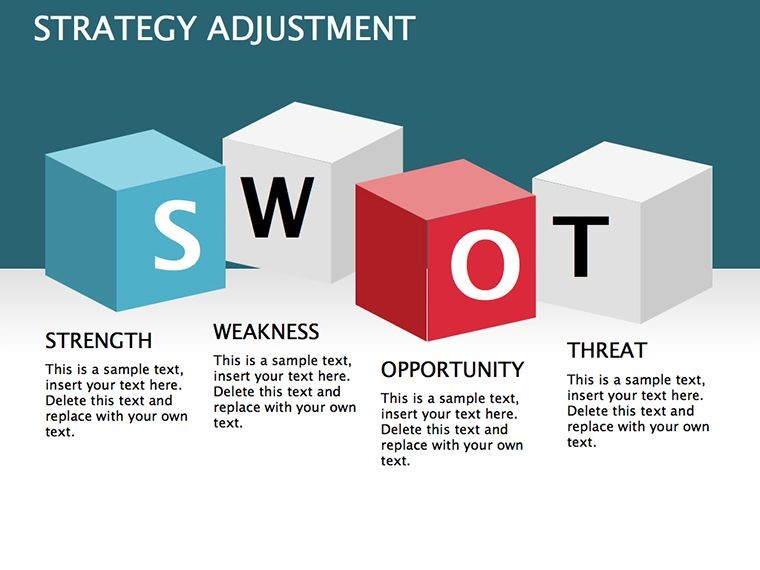
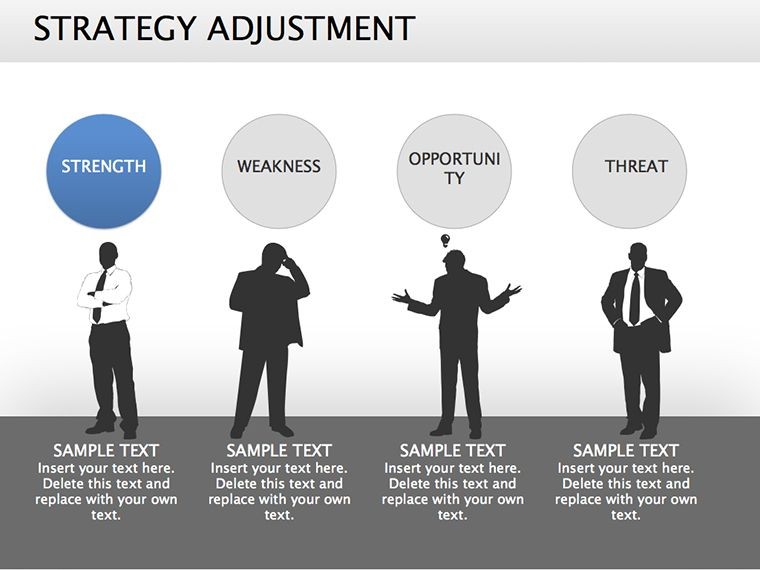
Outpacing basic charts, these diagrams integrate SWOT elements natively, letting you overlay opportunities on threats in vivid relief.
Strategic Scenarios: Where Adjustments Meet Action
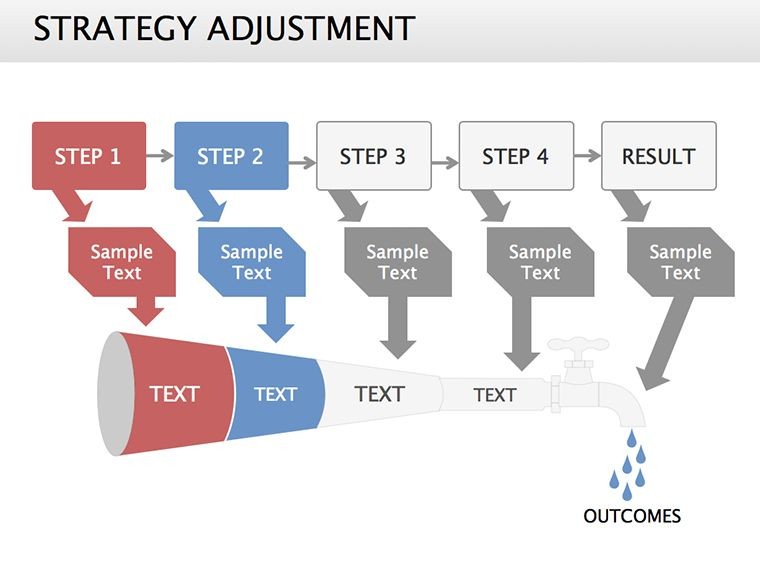
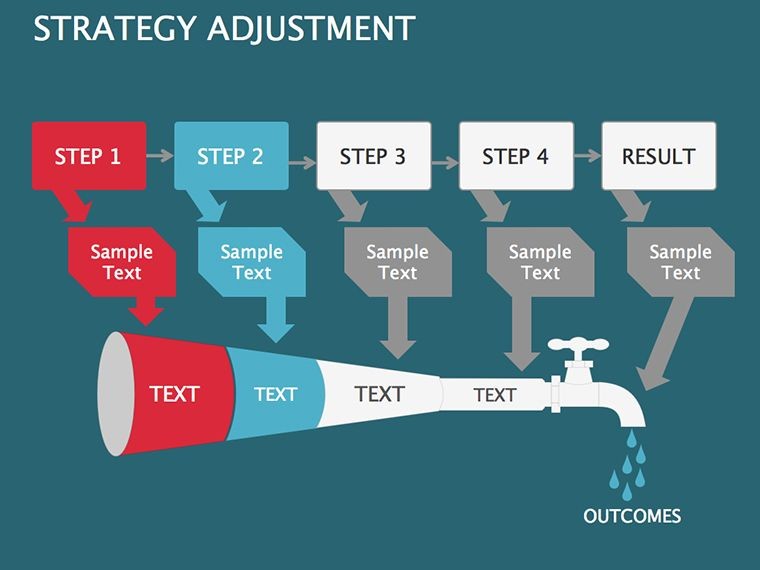
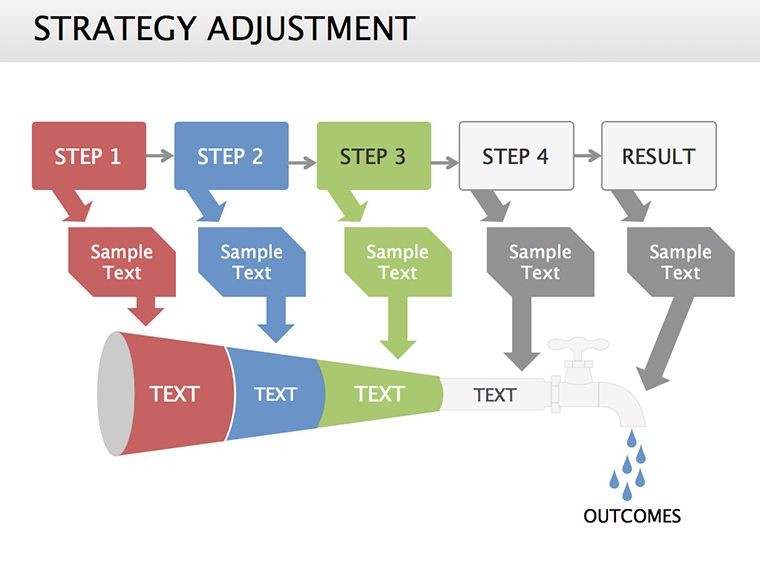
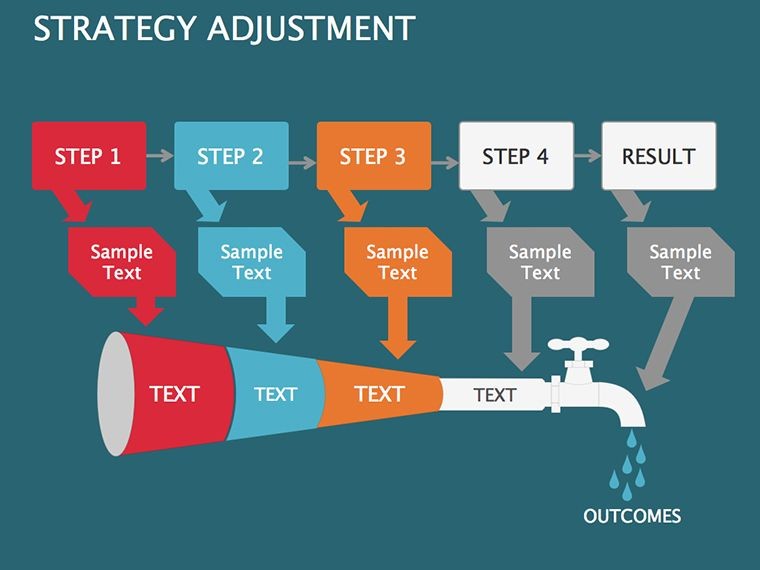
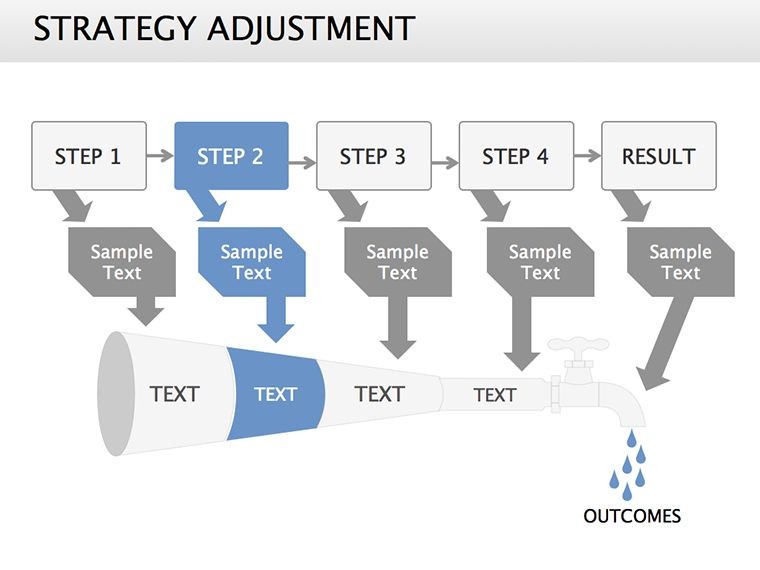
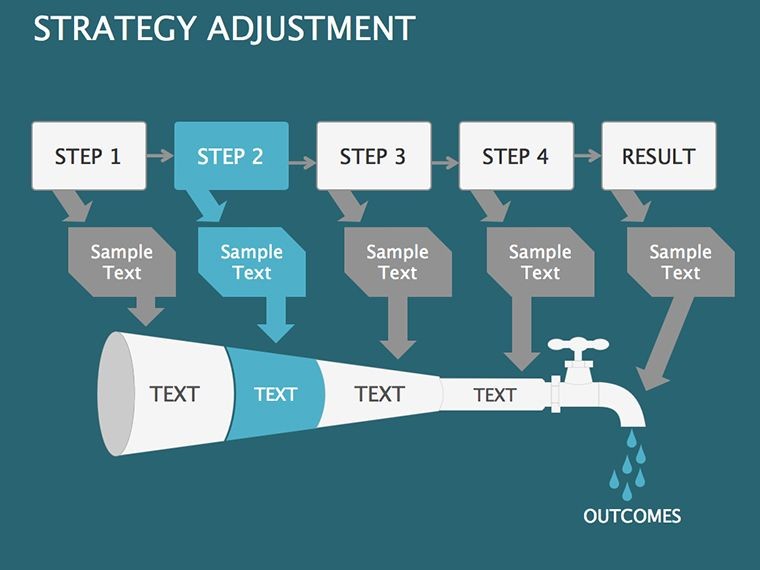
Consider a retail chain facing e-commerce disruption: Use a 3D funnel to illustrate channel shifts, quantifying traffic drops with illustrated data flows - resulting in a 15% budget reallocation that stabilized sales. Or in consulting, a slide matrix assesses vendor performance, pivoting contracts based on KPI visuals that executives could "see" immediately.
For startups, timeline illustrations map funding rounds against milestones, adjusting burn rates on the fly. A venture-backed firm credited this approach for securing Series B by visualizing pivot narratives that convinced investors of resilience. Even in nonprofits, strategy diagrams clarify grant reallocations, ensuring mission integrity amid donor fluctuations.
- Diagnose the Drift: Load data into assessment slides; watch 3D models highlight imbalances.
- Model the Move: Adjust illustrations to simulate scenarios, e.g., +10% market share.
- Forecast the Fix: Animate transitions to project outcomes, building consensus.
- Document the Decision: Export annotated versions for audit trails.
Drawn from interactions with Bain alumni, these cases underscore the template's role in turning analysis into advantage.
Expert Edges: Sharpen Your Strategic Toolkit
Hint: Layer LSI terms like "dynamic pivot modeling" to enrich semantic depth. Cap elements at 7 per slide for cognitive ease, per Nielsen Norman Group. For global teams, embed multilingual labels, broadening appeal.
Integrate with ERP systems for auto-updates, keeping diagrams as current as your strategies. The compact design ensures quick loads, vital for mobile board previews.
Adjust, Advance, Achieve - Your Strategy Starts Here
Strategy without visualization is like sailing without stars. Secure this Keynote template now and navigate turns with the confidence of a captain charting uncharted waters. Download, deploy, dominate.
Frequently Asked Questions
Q: What makes these diagrams ideal for quantitative analysis?A: Pre-linked data fields and 3D scaling for precise metric representations, exportable across platforms.
Q: Can illustrations be swapped for custom branding?A: Yes, vector-based for seamless recoloring and icon replacement.
Q: Is it suitable for small teams?A: Perfect - lean slide count focuses on essentials without overwhelm.
Q: How do animations work in presentations?A: Keynote-optimized for fluid 3D interactions, controllable via triggers.
Q: Does it align with business standards?A: Yes, incorporates elements from ISO 31000 for risk-adjusted strategies.
Q: Support for integrations?A: Guidance included for linking to Excel or Google Sheets.
Good for
- Project roadmaps and sprint plans
- Product launch timelines
- Quarterly or annual review decks
- Company history and milestone summaries
Licence
reviews
I used the arrow diagrams for a training session at work and they looked clear on screen.
The color scheme is simple which honestly made editing easier for me.
Needed something quick for class and the process slides fit perfectly.
The shapes were easy to move around compared to other templates I tried.
It’s not super modern but the layouts still worked for my presentation.
FAQ
Will it work in Google Slides?
Are fonts embedded?
Can I use this for client work?
What's the refund policy?
Do you update the template after purchase?
Similar templates
See all Keynote Diagrams →
All 13 slides