 Click to zoom
Stage Volume Cyclic PowerPoint Charts | Fully Editable Slides - Instant Download
| Format | .pptx |
| Slides | 26 unique layouts |
| Aspect ratio | 16:9 |
| Compatibility | PowerPoint |
| Animated | No |
| Language | English |
| License | Commercial |
| File size | — |
| Version | v1.0 |
| Last updated | February 2026 |
What's inside
Why Use Stage Volume Cyclic Charts
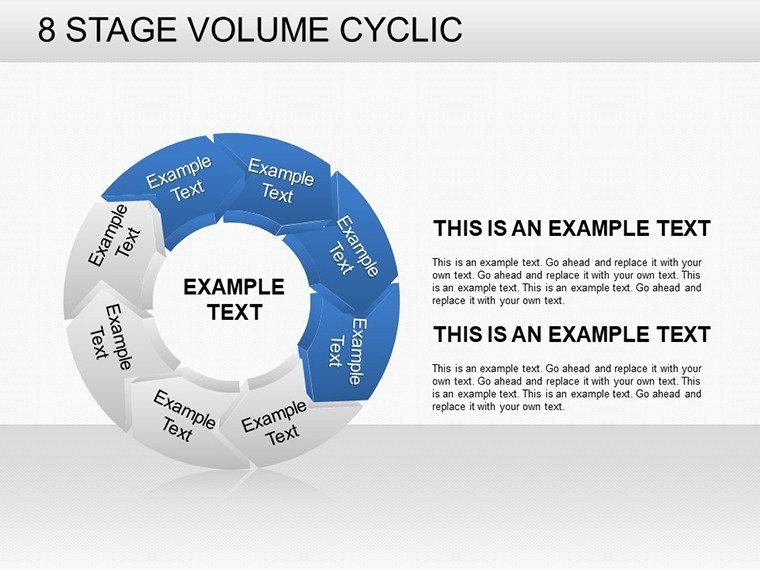
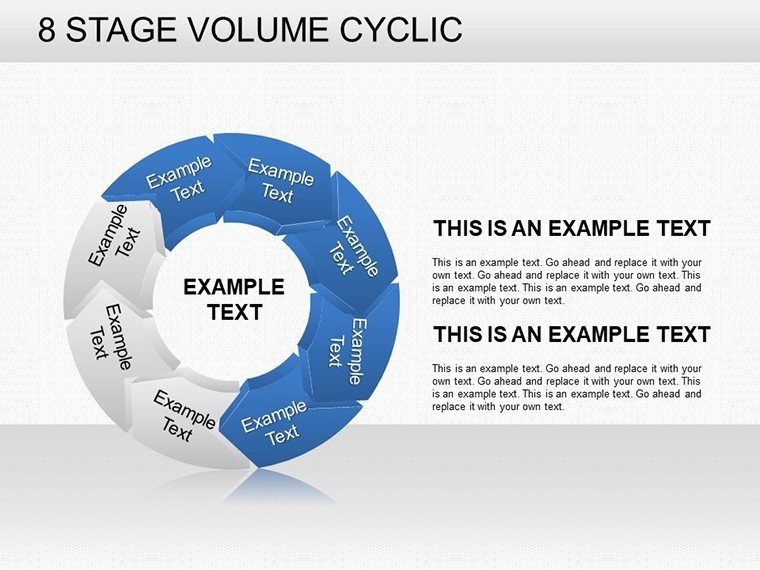
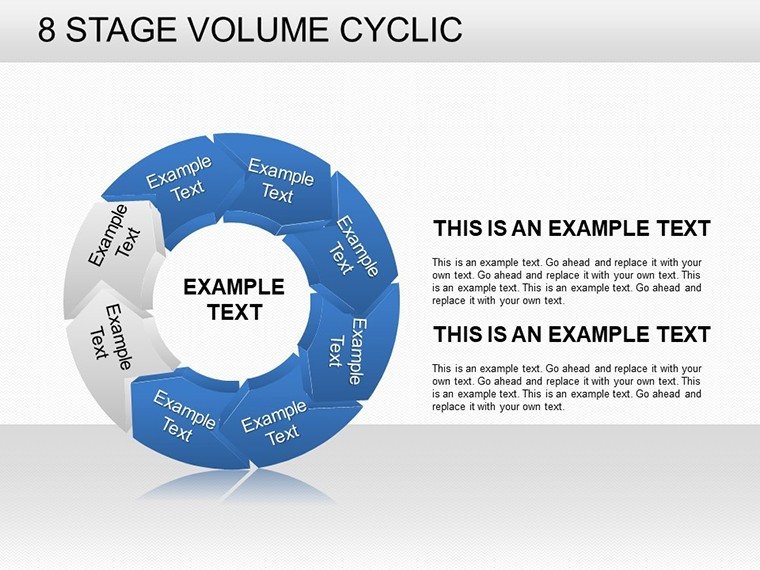
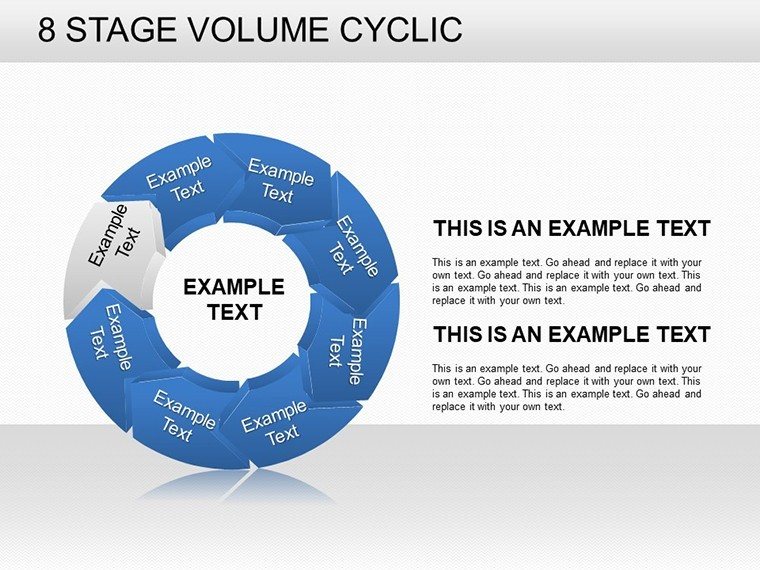
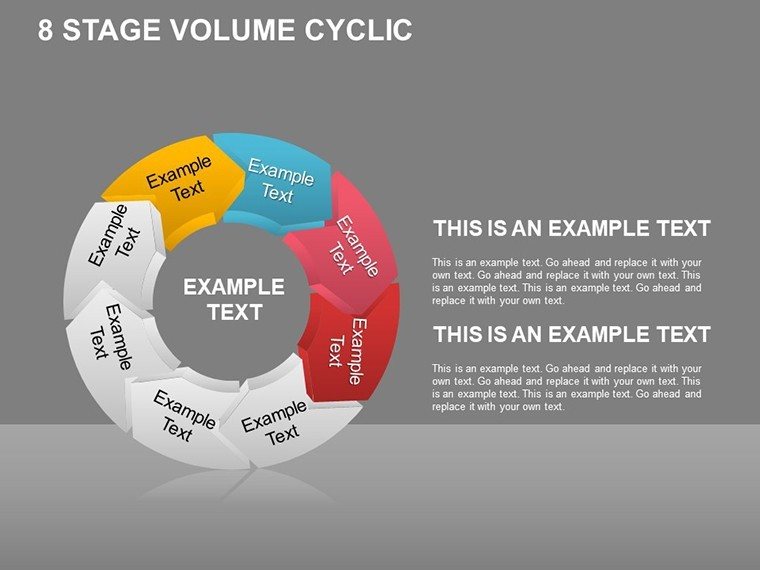
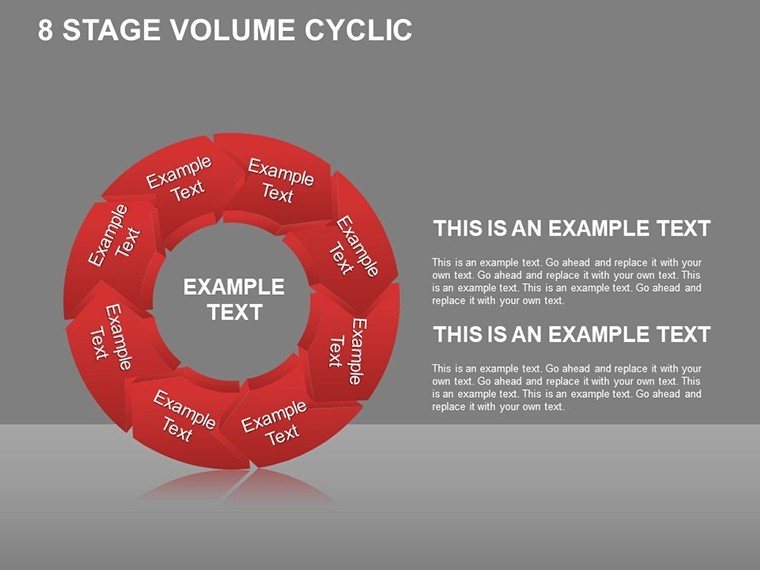
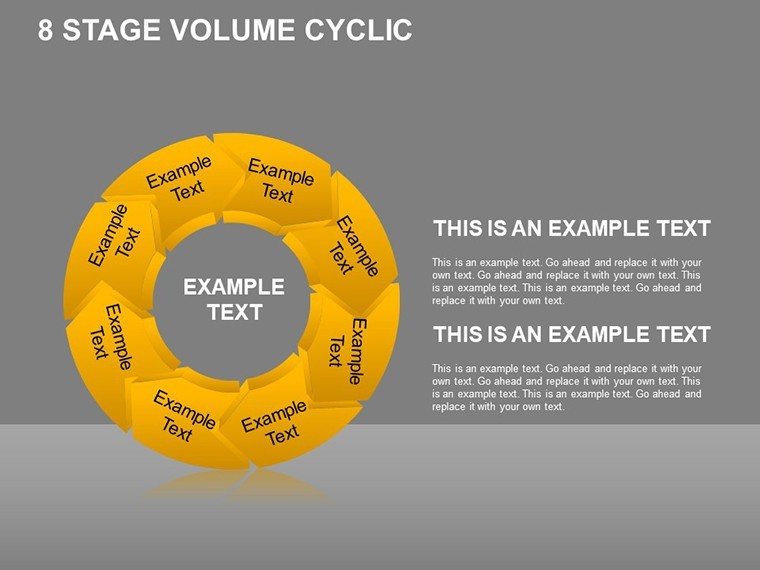
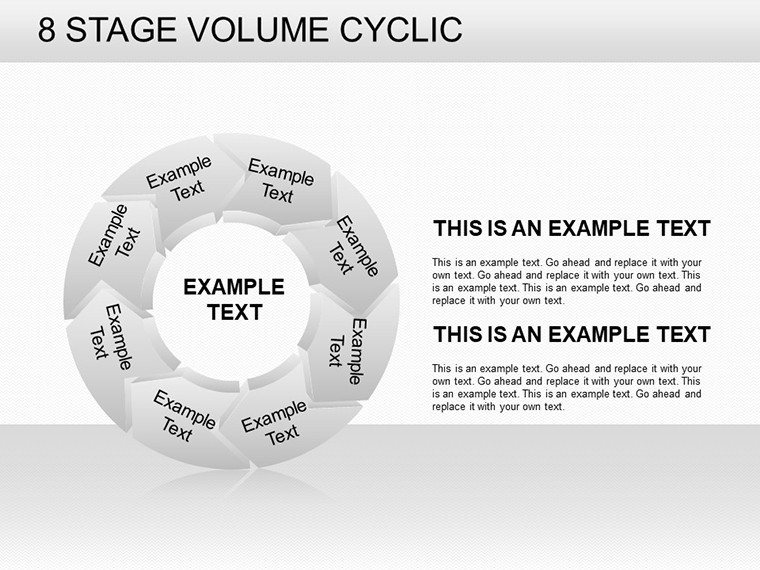
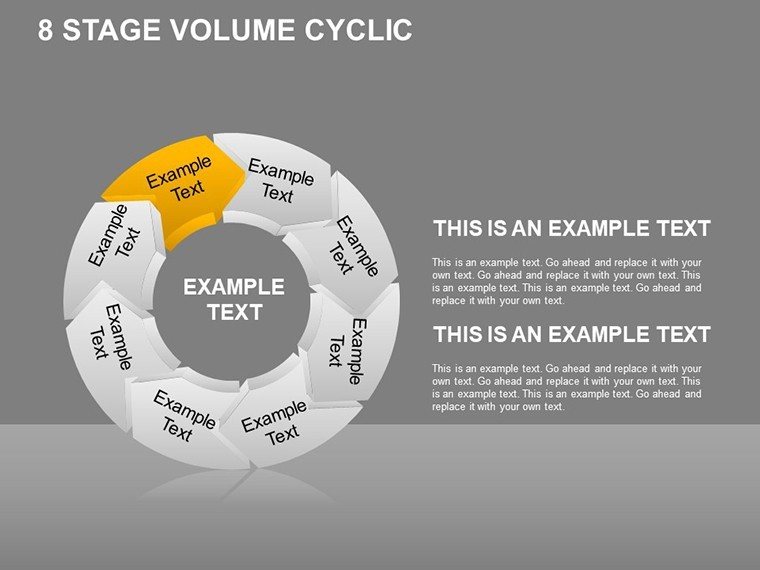
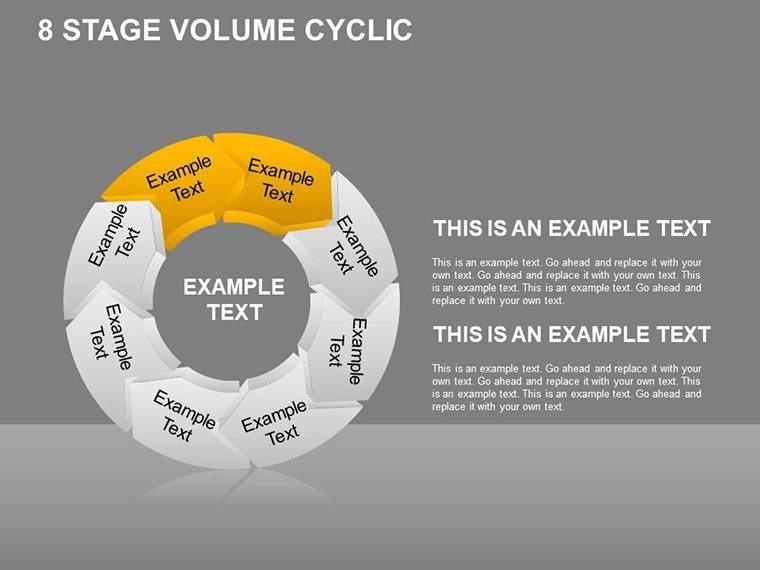
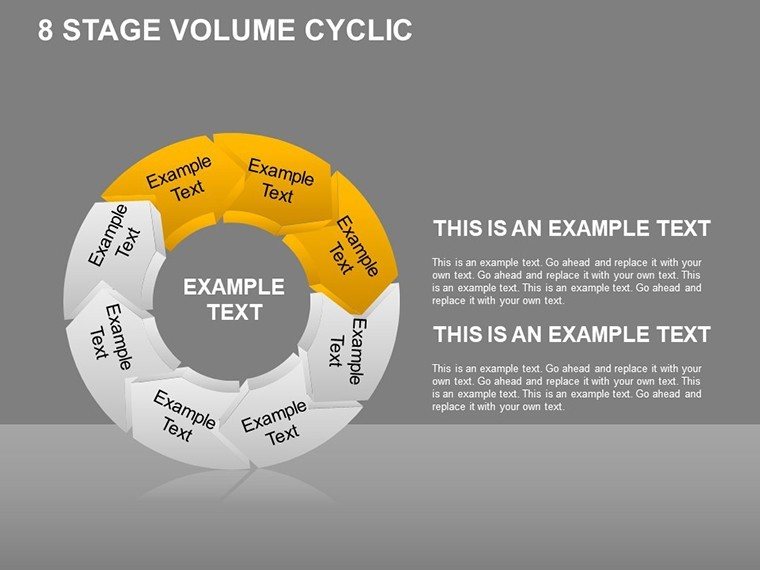
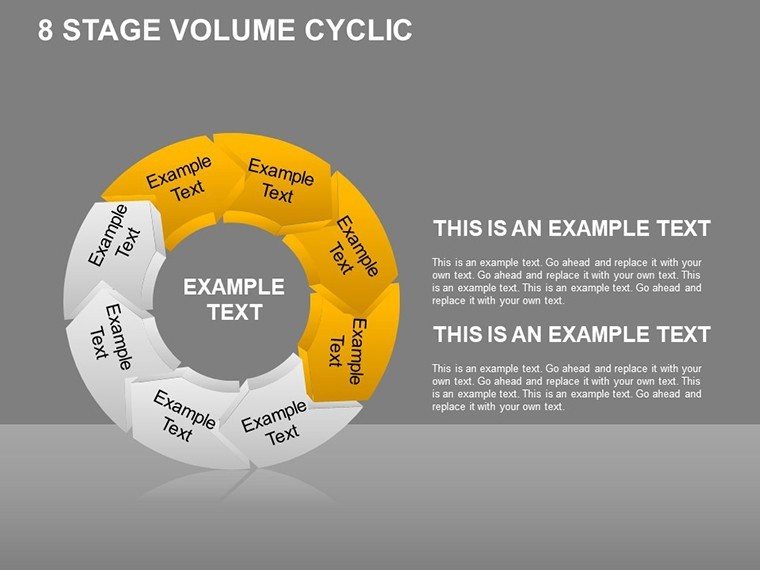
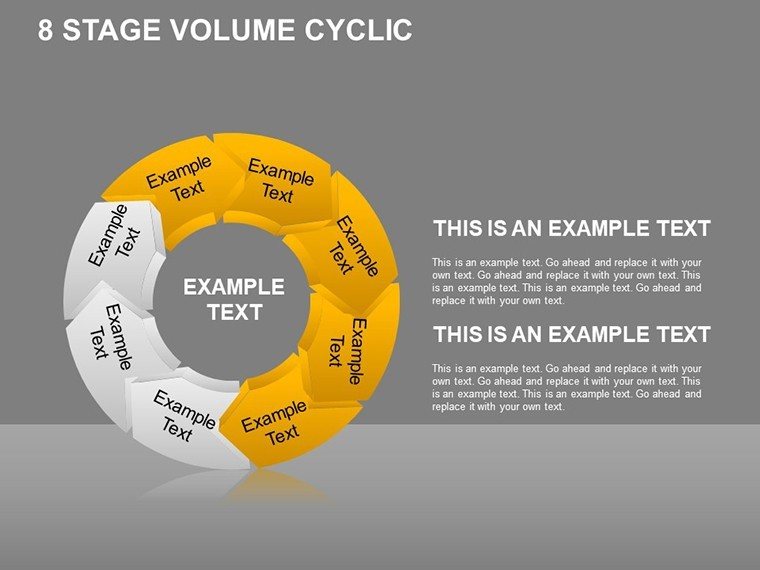
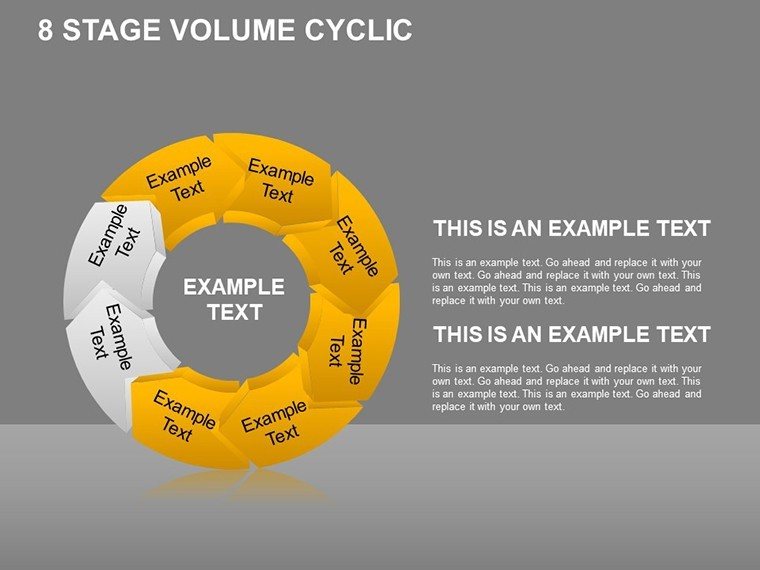
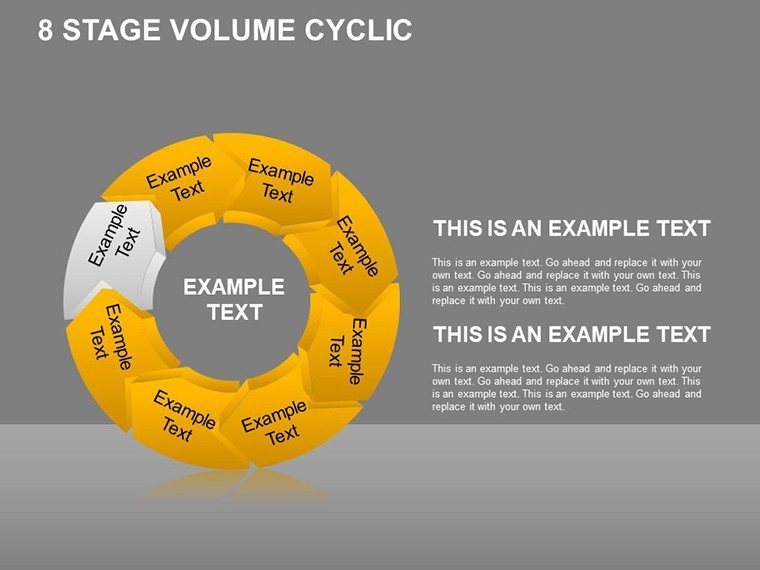
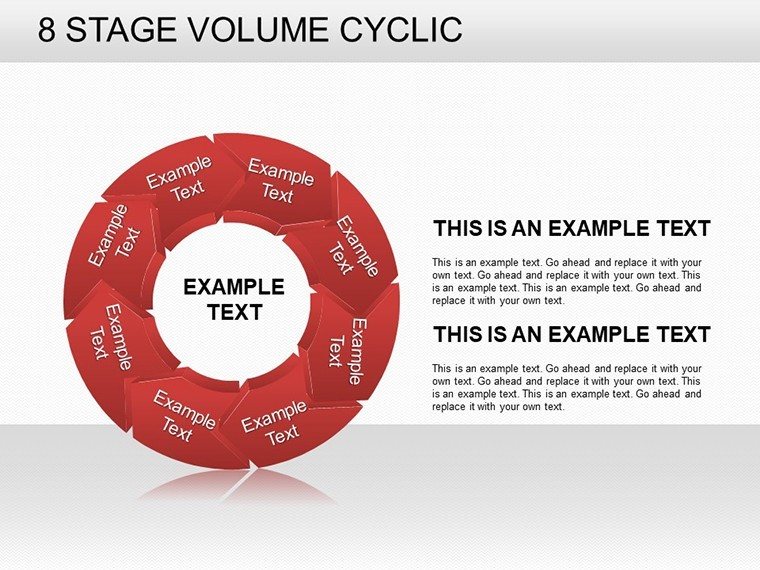
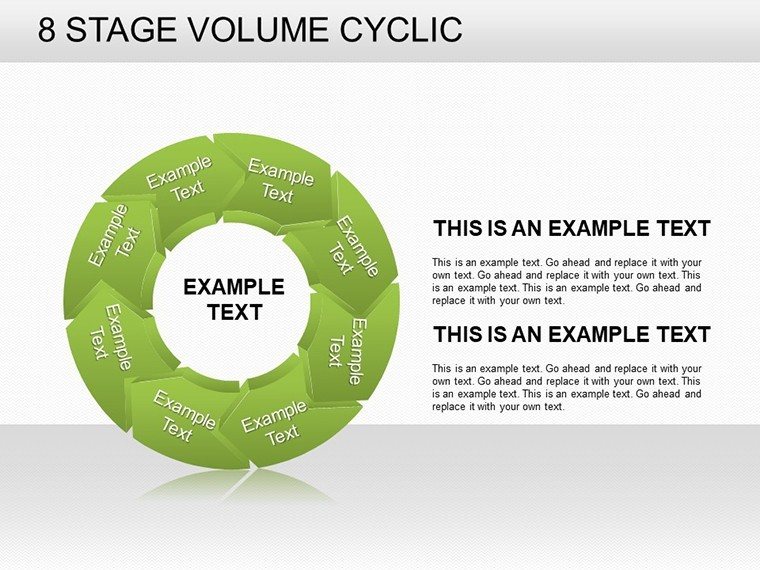
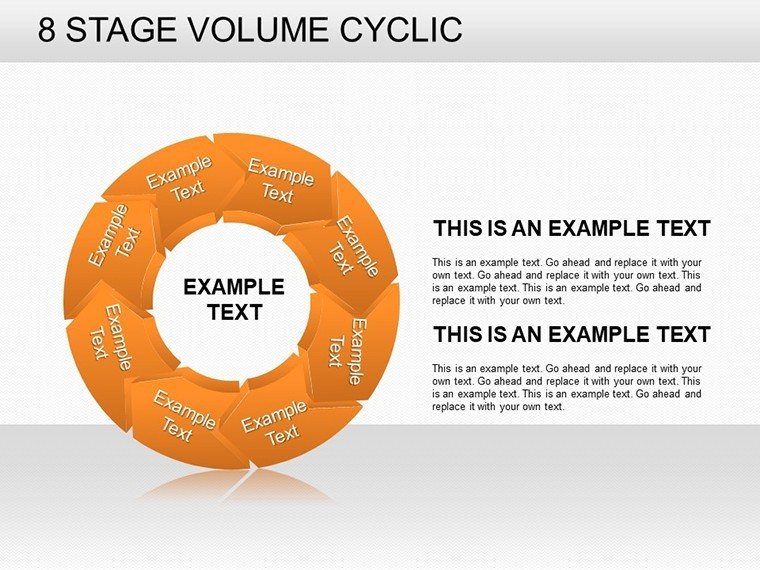
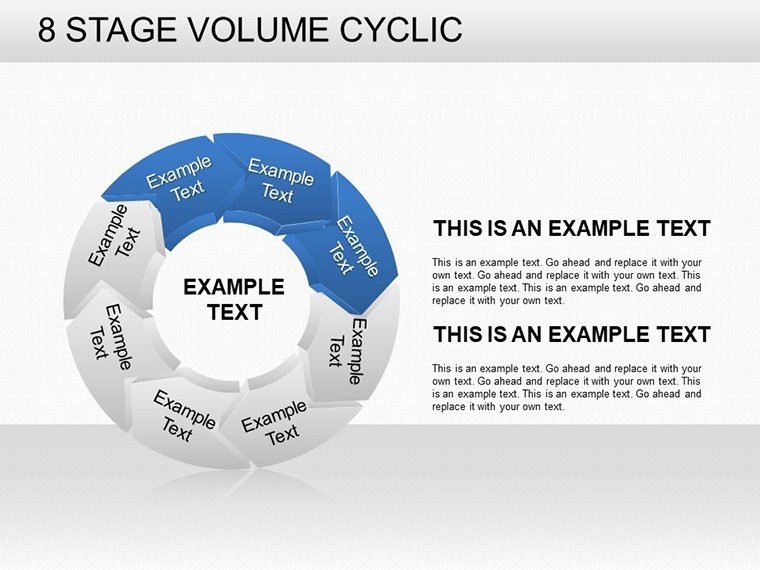
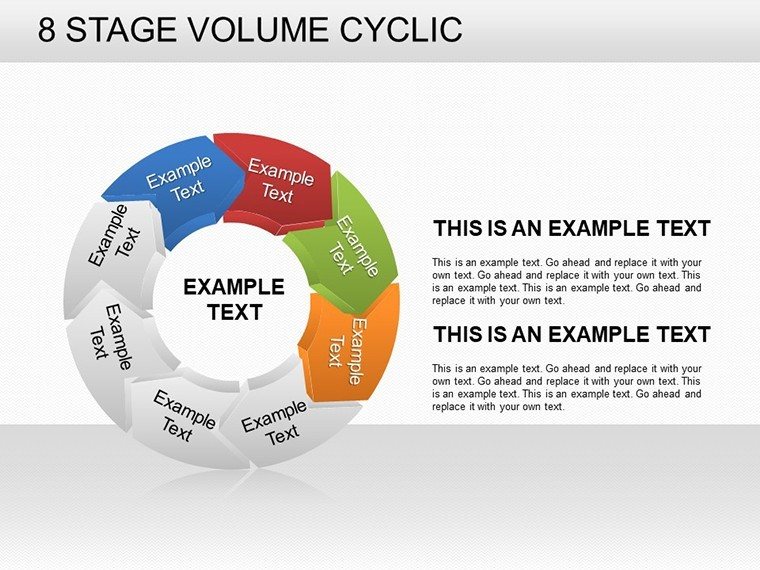
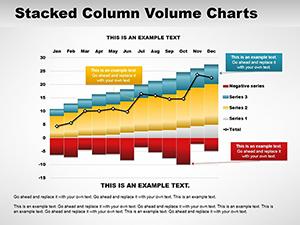
Stage-based and cyclical processes are difficult to explain using linear charts. This Stage Volume Cyclic PowerPoint Charts template is designed to visualize how quantities, workloads, or resources evolve across repeating phases without losing structure or clarity. It is especially effective when decision-makers need to understand patterns, peaks, and transitions rather than isolated data points.
Consultants, project managers, and strategy teams use these slides to communicate multi-phase plans, volume changes over cycles, and operational rhythms during reviews and approvals. Instead of building complex charts from scratch, you can focus on the narrative and the decisions behind the data.
Slide Structure & Visual Logic
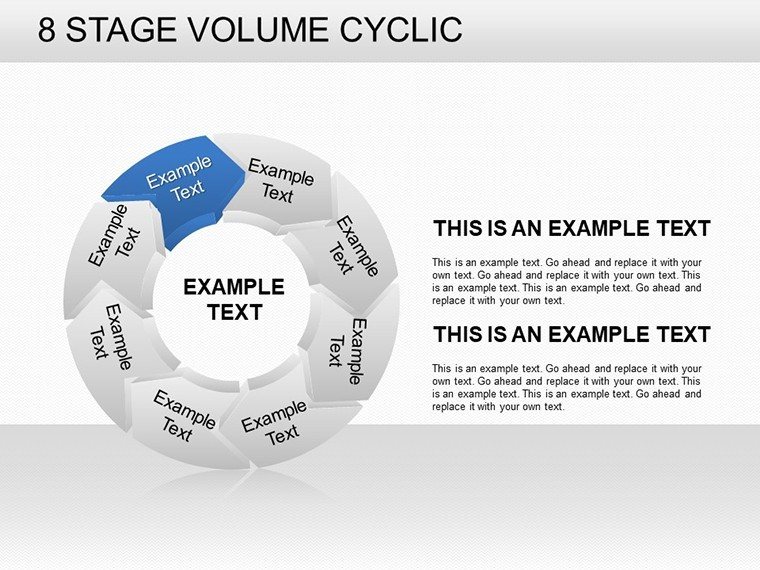
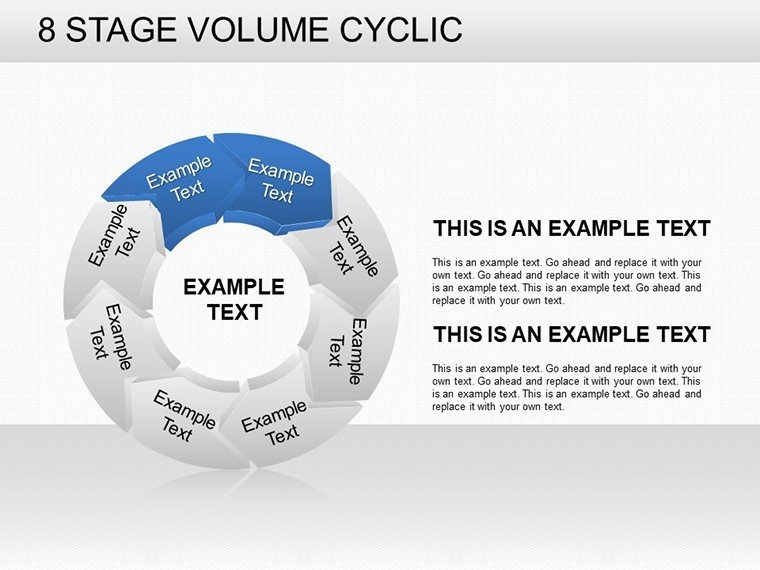
- Cycle-based layouts showing stage-to-stage volume progression
- Clear segmentation for phases, steps, or periods
- Editable shapes, colors, and data labels
- Consistent visual hierarchy for executive readability
Professional Use Cases
These charts are commonly used in board presentations, operational planning decks, budget cycle reviews, and strategy workshops. For example, a project lead can show how resource volumes rise and fall across delivery phases, or a finance team can explain budget allocation across recurring cycles.
Workflow Integration
Open the file in PowerPoint, replace the sample values with your data, and adjust stage labels to match your process. The slides are fully native to PowerPoint, making collaboration and last-minute edits straightforward. Start editing instantly and reuse the visuals across multiple reporting cycles.
Internal Slide Comparison
Slide TypeBest AudienceOutcomeStage volume cycleExecutivesClear understanding of phase impactMulti-step cyclic chartProject teamsAlignment on process flowIndustry Applications
Used in construction planning, operational management, finance cycles, training programs, and consulting engagements where recurring processes must be explained visually.
Frequently Asked Questions
When should I use this template?Use it when you need to explain volume changes across repeating stages or phases rather than a simple timeline.
Is it suitable for executive presentations?Yes. The layouts are designed for clarity, making complex cycles easy to understand in boardroom settings.
How much PowerPoint skill is required?Basic PowerPoint skills are enough. All elements are editable using standard tools.
Good for
- Project roadmaps and sprint plans
- Product launch timelines
- Quarterly or annual review decks
- Company history and milestone summaries
Licence
reviews
Needed quick charts for a client update and this worked fine.
The graph slides looked clean during screen share.
Didn’t spend much time editing honestly.
Some chart colors were a bit too pale.
Still way faster than making everything manually.
FAQ
Will it work in Google Slides?
Are fonts embedded?
Can I use this for client work?
What's the refund policy?
Do you update the template after purchase?
Similar templates
See all PowerPoint Charts →

All 26 slides