 Click to zoom
Social Media Keynote Charts Template: Visualize Connections Effortlessly
| Format | .pptx |
| Slides | 24 unique layouts |
| Aspect ratio | 16:9 |
| Compatibility | PowerPoint |
| Animated | No |
| Language | English |
| License | Commercial |
| File size | — |
| Version | v1.0 |
| Last updated | January 2022 |
What's inside
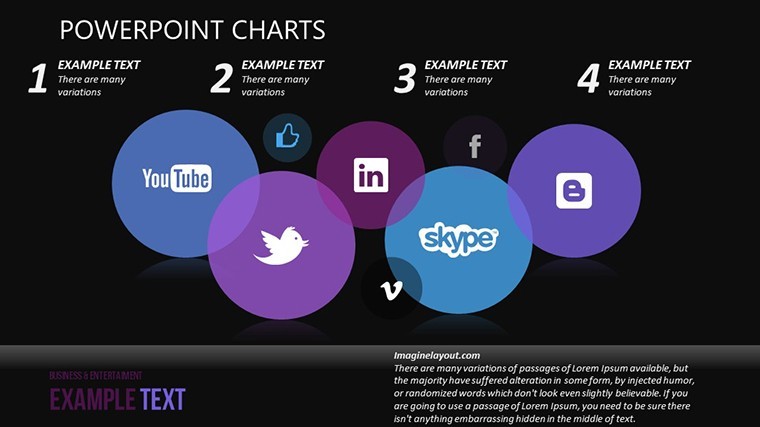
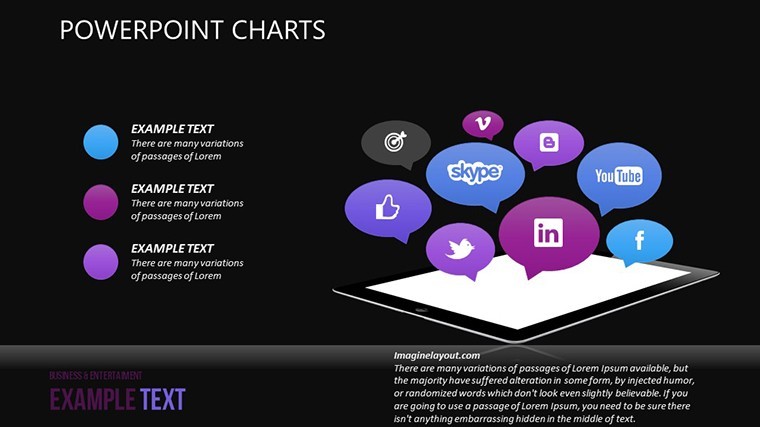
In an era where digital connections define success, the Social Media Keynote Charts Template emerges as an essential asset for anyone looking to present network dynamics with precision and appeal. Boasting 24 editable slides, this template is tailored for professionals in marketing, community management, education, and business development. It transforms abstract concepts like social interdependence into tangible visuals, helping you illustrate how platforms like Facebook and WhatsApp foster communication, sharing, and collaboration.
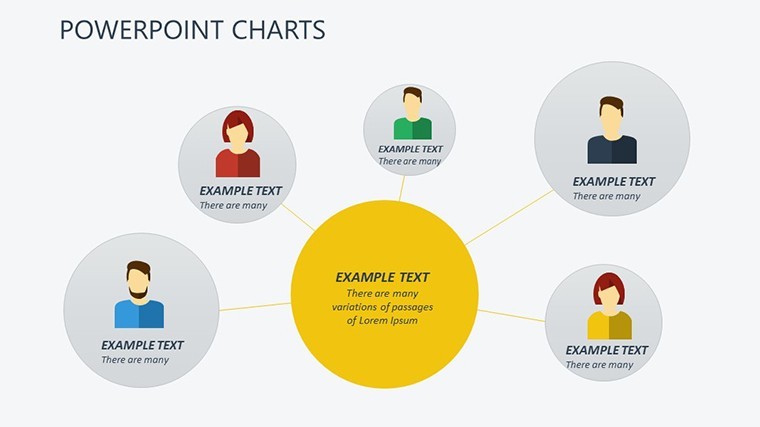
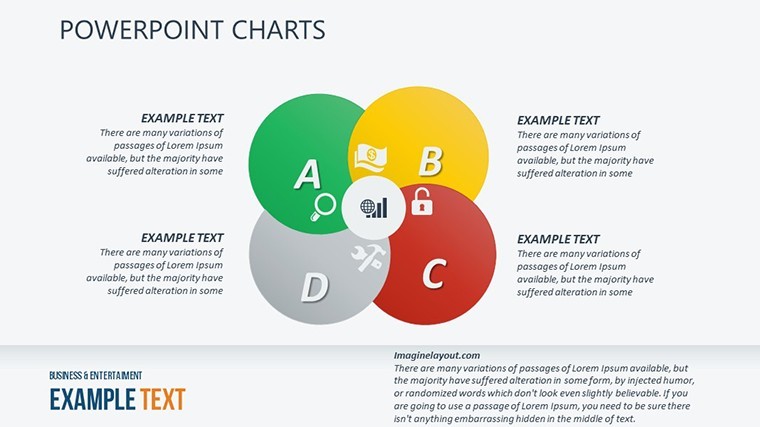
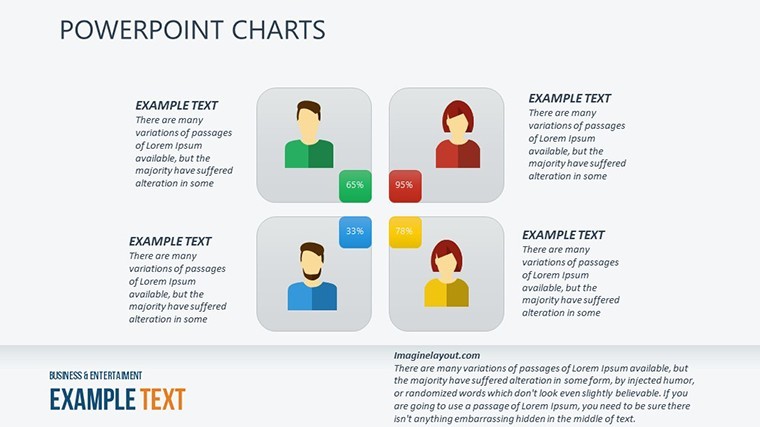
Picture this: You're preparing a workshop on expanding business networks. Instead of dense text, you use matrix charts to map relationships based on friendship, common interests, or financial ties. The benefits extend beyond visuals - save time on design, boost audience engagement, and convey complex social structures with ease. This template, categorized under Matrix and Organizational, excels in depicting hierarchies, interconnections, and group dynamics, making it a versatile tool for modern presenters.
Standout Features for Dynamic Presentations
This template isn't just a collection of slides; it's a comprehensive kit designed for impact. With full editability, you can reshape every chart to fit your narrative, from adjusting node sizes in organizational diagrams to recoloring matrices for brand alignment. The intuitive Keynote interface ensures smooth modifications, even for beginners.
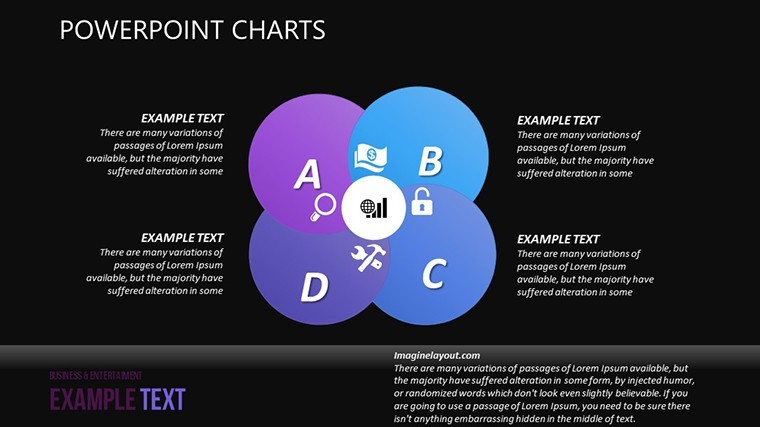
- Matrix Layouts: Perfect for showing multi-dimensional relationships, like user interactions across social platforms.
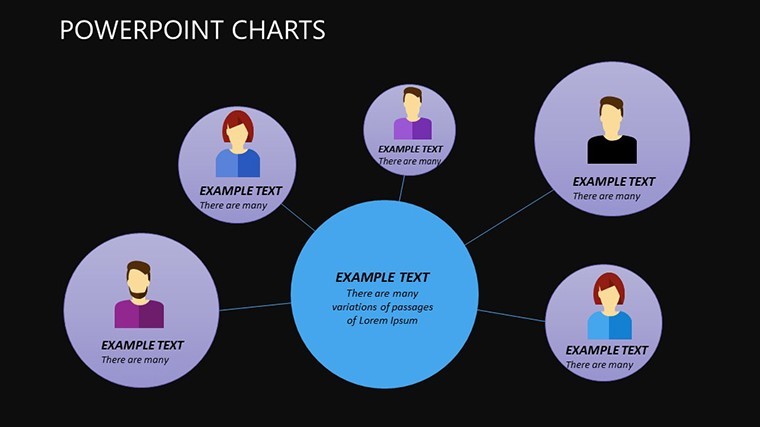
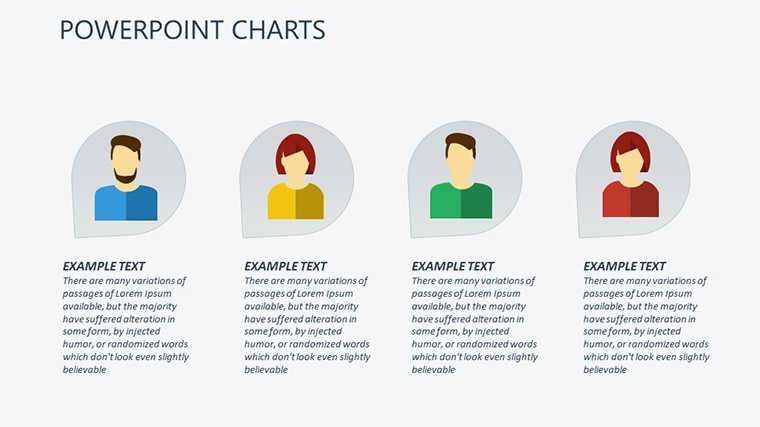
- Organizational Charts: Hierarchical structures to visualize teams, communities, or kinship networks.
- Customizable Elements: Change fonts, colors, and icons to reflect your unique style or corporate identity.
- Efficient Design: Pre-formatted slides reduce setup time, allowing focus on insightful content.
These features address common challenges in social media presentations, such as overwhelming data. For example, use a matrix to demonstrate how shared interests drive engagement, drawing from real-world insights like those in Pew Research Center studies on social media behaviors.
In-Depth Slide Overview
Explore the 24 slides, each crafted to build a compelling story about social networks.
- Slide 1-4: Introductory Matrices - Title pages and basic grids to outline social media landscapes.
- Slide 5-9: Relationship Diagrams - Organizational charts depicting friendships, kinships, and interest-based connections.
- Slide 10-14: Interaction Flows - Visuals for messaging, commenting, and sharing dynamics.
- Slide 15-19: Network Expansion Tools - Matrices showing growth in personal and business contacts.
- Slide 20-22: Belief and Exchange Models - Charts illustrating financial or ideological interdependencies.
- Slide 23-24: Summary and Action Plans - Recap visuals with calls to enhance social strategies.
This structure promotes logical progression, similar to how successful campaigns on platforms like LinkedIn build narratives. Case studies from marketing gurus like Gary Vaynerchuk highlight how such visuals amplify message reach.
Practical Applications in Social Spheres
The applications are vast. Marketers can use these charts to present audience segmentation, showing how matrix views reveal target demographics. Community managers benefit from organizational diagrams to map user groups, fostering better engagement strategies. Educators might employ them to teach digital sociology, using real examples like WhatsApp's role in global communication.
For business development, visualize partnership networks to pitch collaborations effectively. A notable example: A startup used similar organizational charts in an investor deck, securing funding by clearly showing market interconnections, as reported in Forbes articles on networking. Workflow integration is simple - import data from tools like Excel, customize in Keynote, and present confidently.
Pro Tips for Social Media Visuals
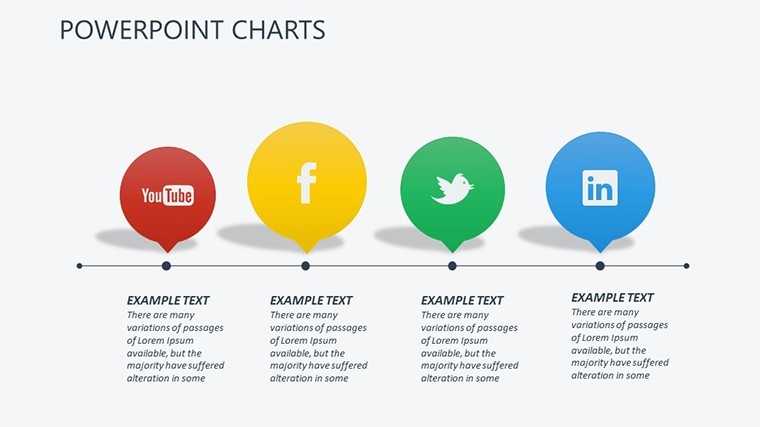
To maximize effectiveness, incorporate icons representing platforms (e.g., speech bubbles for chats). Keep matrices uncluttered by limiting to 5-7 nodes per slide. Animate connections to reveal insights step-by-step, enhancing storytelling. Unlike standard Keynote defaults, this template provides themed elements that align with social media aesthetics, avoiding amateur looks.
Elevate Your Network Narratives Today
Choosing this template means investing in authoritative, trustworthy visuals that resonate. It's inspired by communication theories from experts like Marshall McLuhan, ensuring your presentations are not just seen but felt. Don't miss out - grab the Social Media Keynote Charts Template and connect with your audience like never before.
Frequently Asked Questions
Are the slides fully customizable?
Yes, every chart and element can be edited to suit your needs.
Does it support different slide ratios?
Absolutely, including 16:9 and 4:3 formats.
Can I integrate real data?
Easily import from spreadsheets for accurate representations.
Is it suitable for beginners?
Yes, with drag-and-drop simplicity.
How does it handle large networks?
Use scalable matrices to manage complexity without losing clarity.
Good for
- Project roadmaps and sprint plans
- Product launch timelines
- Quarterly or annual review decks
- Company history and milestone summaries
Licence
reviews
The diagrams made process explanations less awkward.
Some spacing needed fixing after adding my text.
The color palette felt balanced and not too loud.
It did what I needed.
I used this for an operations update presentation at work.
FAQ
Will it work in Google Slides?
Are fonts embedded?
Can I use this for client work?
What's the refund policy?
Do you update the template after purchase?
Similar templates
See all Keynote Charts →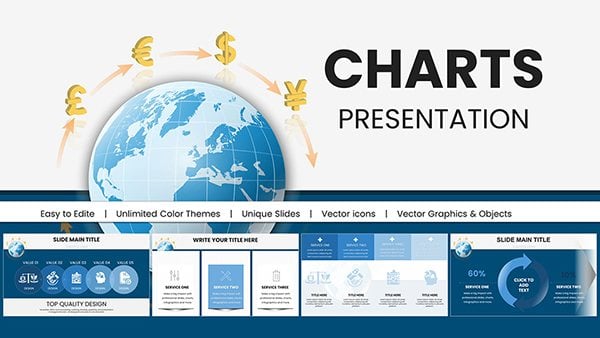

All 24 slides