 Click to zoom
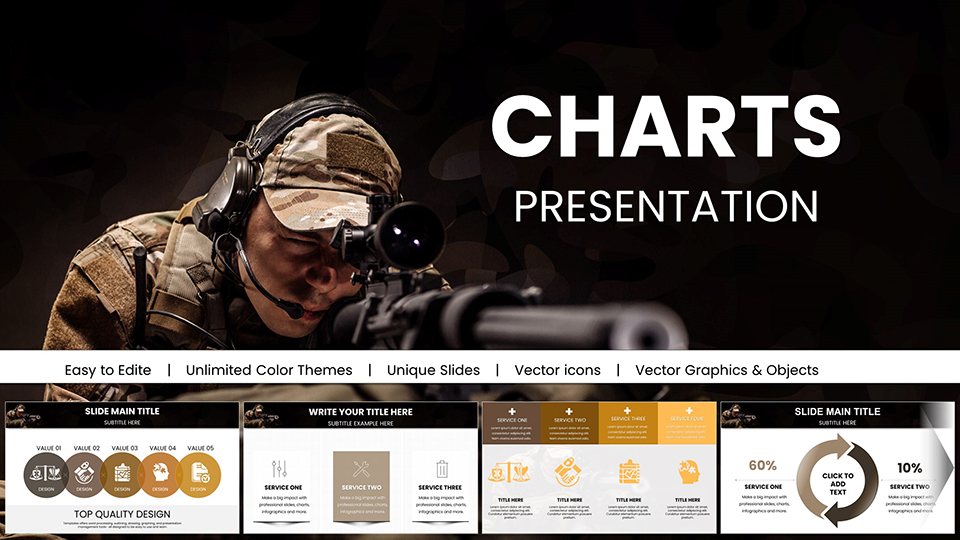
Sharpshooter PowerPoint Charts Template for Precision Presentations
| Format | .pptx |
| Slides | 57 unique layouts |
| Aspect ratio | 16:9 |
| Compatibility | PowerPoint |
| Animated | No |
| Language | English |
| License | Commercial |
| File size | — |
| Version | v1.0 |
| Last updated | June 2024 |
What's inside
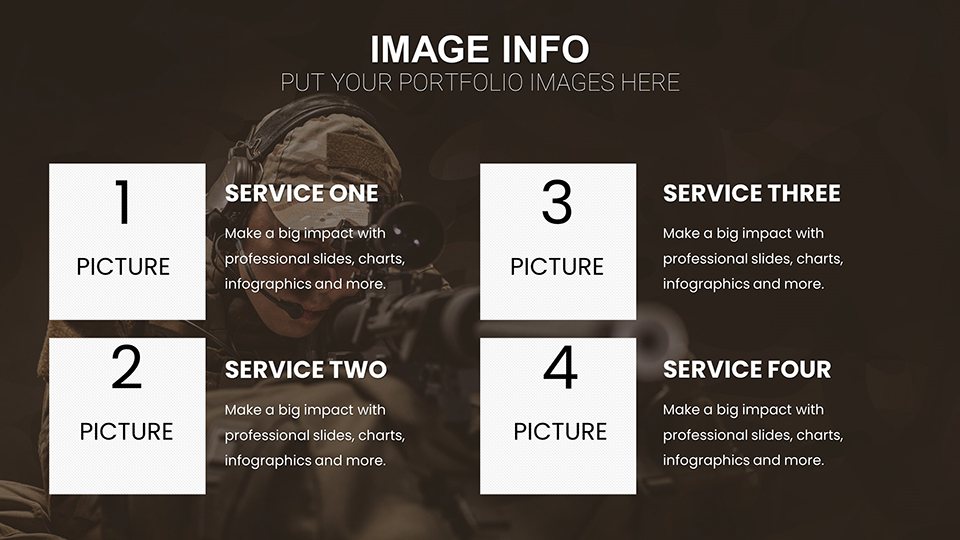
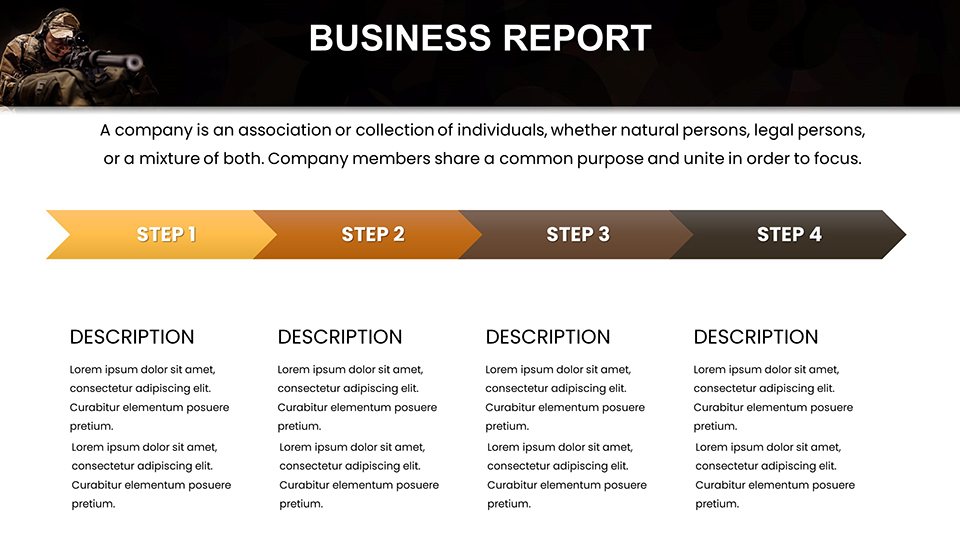
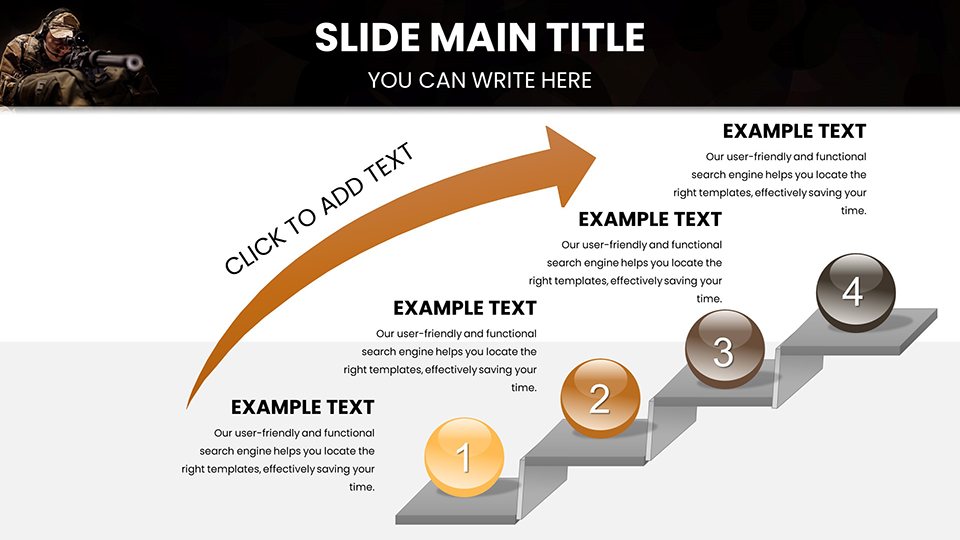
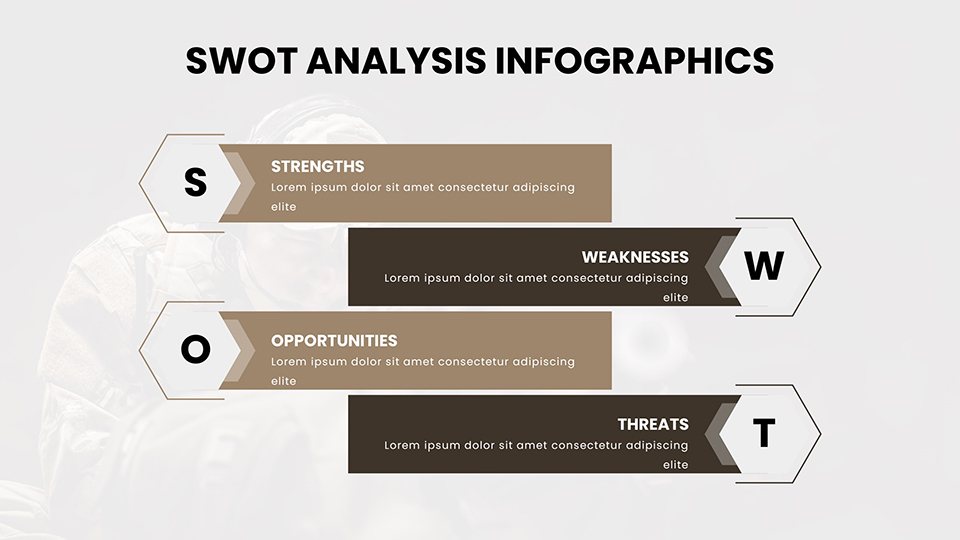
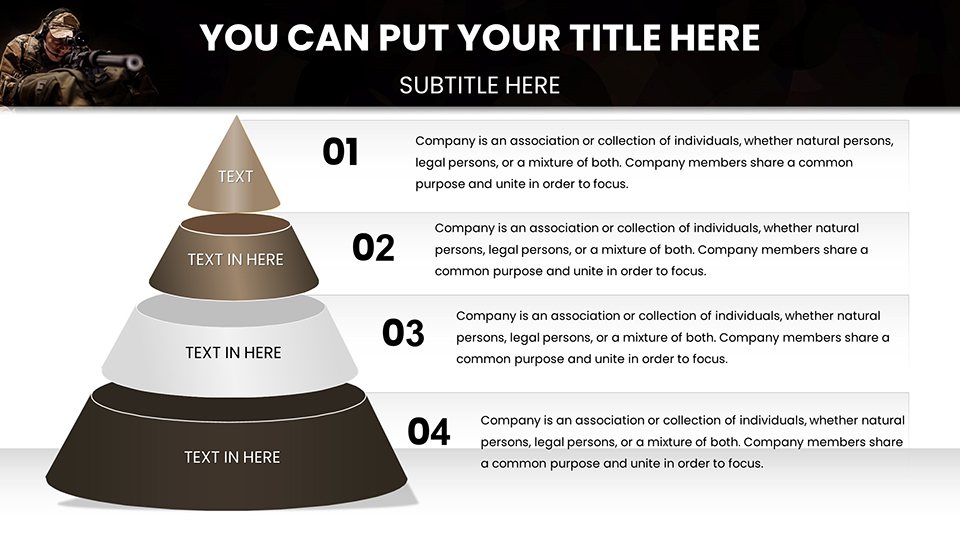
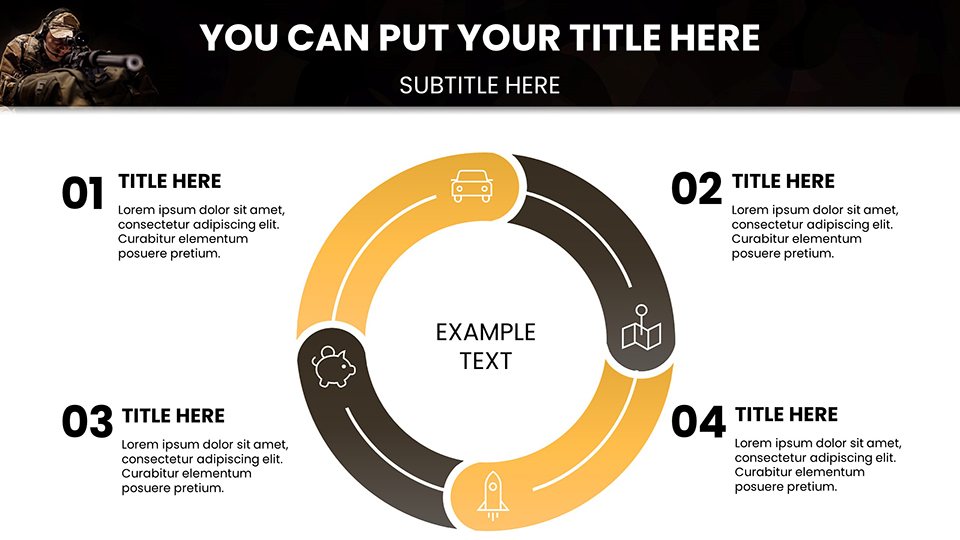
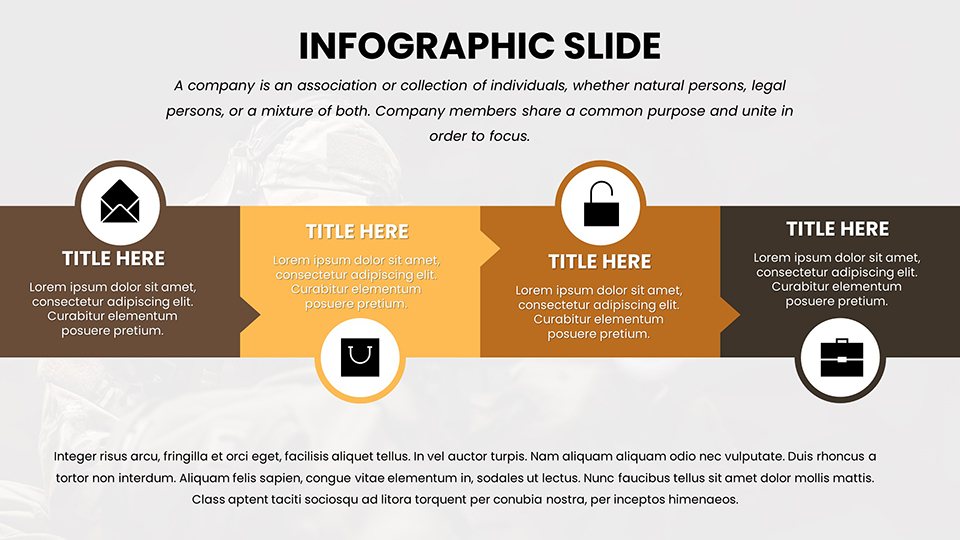
In a world where data drives decisions, presenting it with sharpshooter accuracy can set you apart. Our Sharpshooter PowerPoint Charts template offers 57 editable slides engineered for professionals who demand pinpoint clarity in their visuals. With a minimalist style emphasizing clean typography and focused graphics, this tool is perfect for business analysts, educators, and marketers aiming to hit their targets. Envision transforming quarterly sales figures into compelling bar graphs that spotlight growth trends, or simplifying project milestones with sleek timelines that keep teams aligned. This template tackles the frustration of bland defaults by providing pre-animated elements and customizable layouts, saving you time while amplifying impact. Whether in boardrooms or classrooms, its compatibility with PowerPoint and Google Slides ensures smooth delivery, making it a versatile ally for those who present to persuade.
Precision Engineering in Every Slide
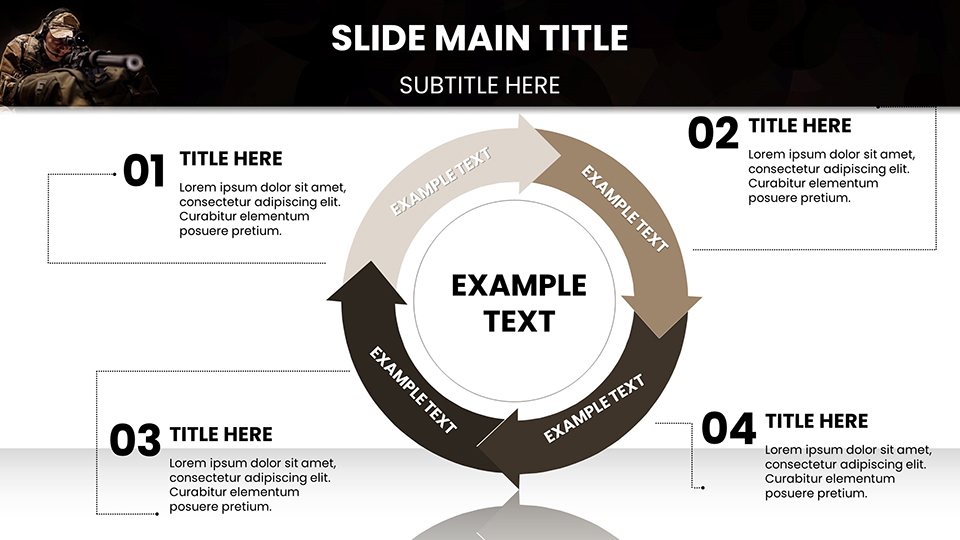
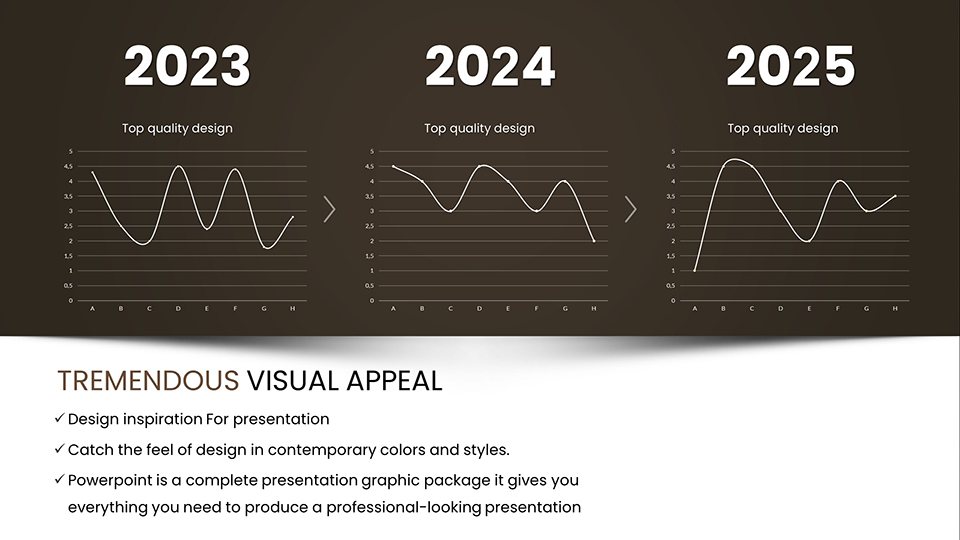
The hallmark of this template is its targeted design, where each chart serves a specific purpose without excess. Pie charts dissect market shares with surgical precision, while scatter plots reveal correlations in data sets like customer behavior patterns. Influenced by design gurus like Stephen Few, who advocate for perceptual accuracy in visuals, the slides use subtle color palettes to direct attention effectively. Marketers crafting campaign reports can insert metrics from tools like Google Analytics, customizing icons to represent KPIs for immediate comprehension. The editable framework allows for rapid iterations - resize elements, swap fonts, or layer in photos - to tailor content for diverse audiences, from executives to trainees. This not only streamlines workflow but also infuses presentations with an air of expertise, drawing on best practices from data visualization conferences.
Essential Features for Targeted Impact
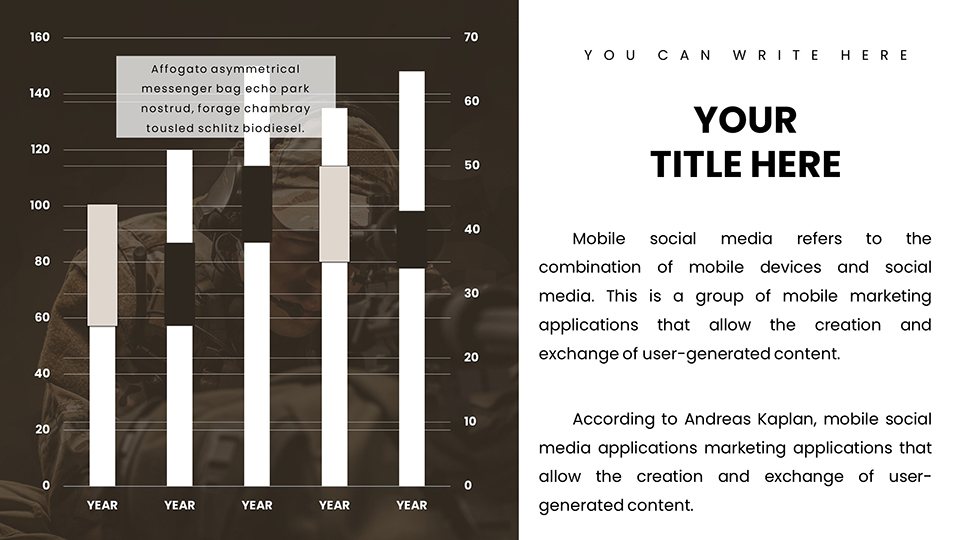
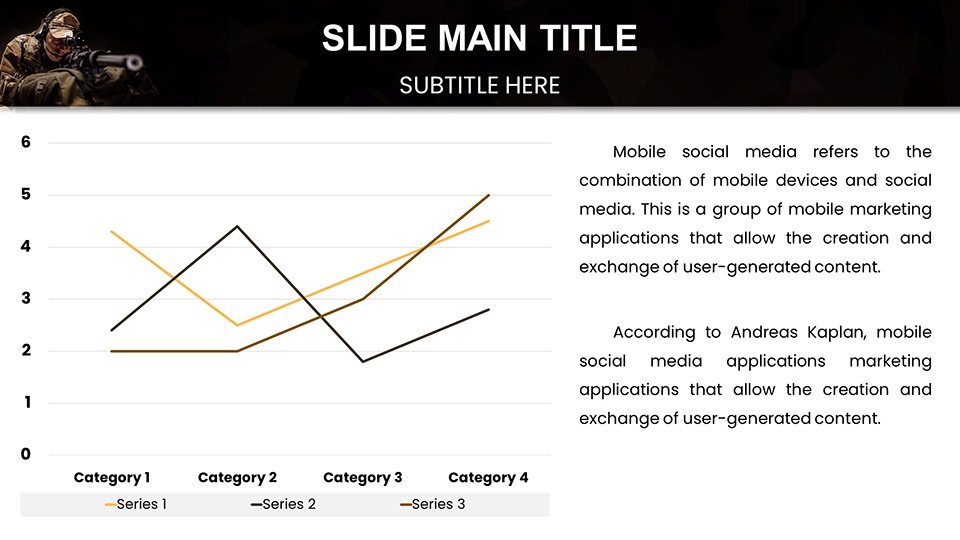
- Diverse Graph Options: Bar, line, area, and radar charts for multifaceted data stories.
- Minimalist Aesthetics: Clean lines and ample white space to focus on insights, not distractions.
- Animation Precision: Controlled reveals that build suspense without overwhelming.
- Layout Flexibility: Modular designs for easy rearrangement to fit narrative flow.
- User-Centric Edits: Intuitive interface for non-designers to achieve pro results.
These components ensure your presentations hit the mark, embodying trustworthiness through refined, data-driven visuals.
Targeted Applications Across Industries
Picture a consultant unveiling a turnaround strategy: begin with a funnel chart illustrating sales pipelines, then transition to heat maps showing regional performance hotspots. Modeled after successful case studies from firms like McKinsey, this method adds authoritative weight. Educators can adapt for lectures, using doughnut charts to break down syllabus components, encouraging student interaction via embedded quizzes. In project management, Gantt charts track deliverables against deadlines, integrating with software like Microsoft Project for seamless data flow. By naturally including phrases like data dashboards, visual analytics, and performance metrics, the content gains SEO traction while solving real user needs in dynamic settings.
Guided Path to Presentation Mastery
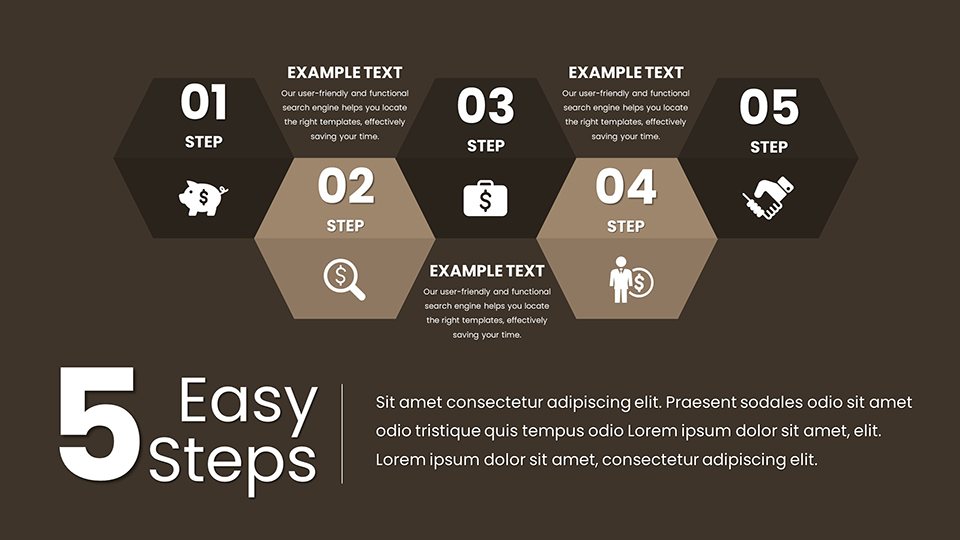
- Acquire and Launch: Download .pptx and open in your preferred platform.
- Data Integration: Populate charts with your figures, verifying against sources like industry benchmarks.
- Design Refinement: Adjust visuals for audience - bold for emphasis, subtle for detail.
- Enhance Interactivity: Add hyperlinks or notes for deeper dives.
- Practice Delivery: Rehearse timing to ensure smooth, targeted messaging.
- Execute and Iterate: Gather feedback post-presentation for future sharpens.
This process demystifies creation, turning novices into sharpshooters of communication.
Pro Tips for Hitting the Bullseye
Elevate your game by layering narratives: use charts to tell a story arc, from problem identification to solution triumph. Dodge overload by adhering to the 'one idea per slide' rule, letting visuals breathe. In collaborative environments, Google Slides' features allow for pinpoint comments, refining collectively. Bolster credibility with citations from Harvard Business Review articles on effective presenting. Versus stock options, this template's themed precision reduces rework, delivering value in high-pressure scenarios like pitch decks.
Aim high with presentations that precisely convey your vision. Grab this template now and strike at the heart of your audience's needs.
Frequently Asked Questions
How many slides does this template include?
57 fully editable slides, covering a wide range of chart types for versatile use.
Is animation customizable?
Yes, adjust animations to suit your pacing and emphasis needs.
Can educators use this effectively?
Definitely - simplify complex topics with clear visuals for engaging lessons.
What about compatibility issues?
None; works flawlessly with PowerPoint and Google Slides.
Are there layout examples?
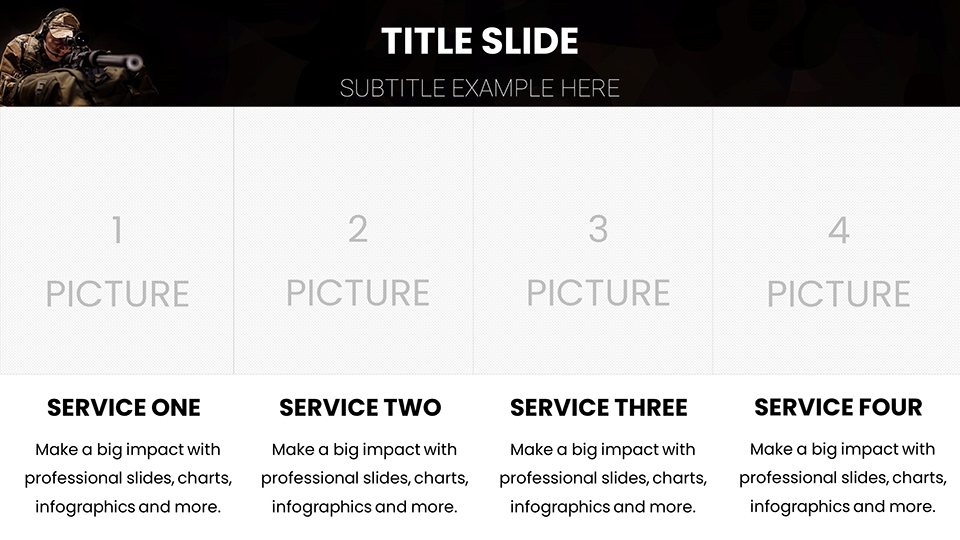
Yes, pre-designed options for quick starts on sales or project slides.
How to add personal branding?
Easily incorporate logos and colors via the edit tools.
Good for
- Project roadmaps and sprint plans
- Product launch timelines
- Quarterly or annual review decks
- Company history and milestone summaries
Licence
reviews
Business analyst praising the clean minimalist bars and scatter plots. White space focus keeps attention on data like KPIs. Perfect for quarterly reviews without distraction.
Educator here - doughnut charts simplified syllabus breakdowns for students. Controlled animations build nicely. Sharpshooter precision in layouts is accurate but lacks bold colors for some lectures.
Used funnel charts for sales pipelines in consulting. Typography is sharp and editable fonts fit brand. Hit the mark for executive audiences.
Practical but slightly basic icons. Radar charts for performance were useful after customization. Fast Google Slides collaboration. Good for data-heavy presentations.
Pressed professional: timelines for milestones kept teams aligned under deadline. Subtle design avoids overload. Reliable for persuasive pitches.
Mixed: excellent for precision but wished for more thematic variety. Still, modular layouts made rearrangement easy and professional.**
FAQ
Will it work in Google Slides?
Are fonts embedded?
Can I use this for client work?
What's the refund policy?
Do you update the template after purchase?
Similar templates
See all PowerPoint Charts →
All 57 slides