 Click to zoom
Relationships Charts Template for Architectural Collaborations
| Format | .pptx |
| Slides | 18 unique layouts |
| Aspect ratio | 16:9 |
| Compatibility | PowerPoint |
| Animated | No |
| Language | English |
| License | Commercial |
| File size | — |
| Version | v1.0 |
| Last updated | August 2023 |
What's inside
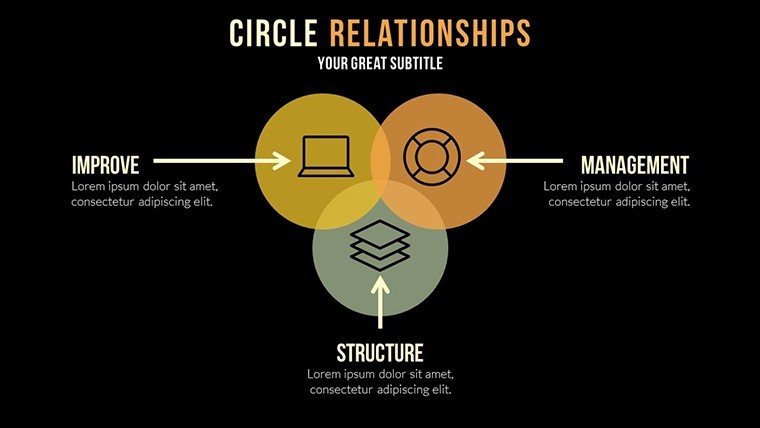
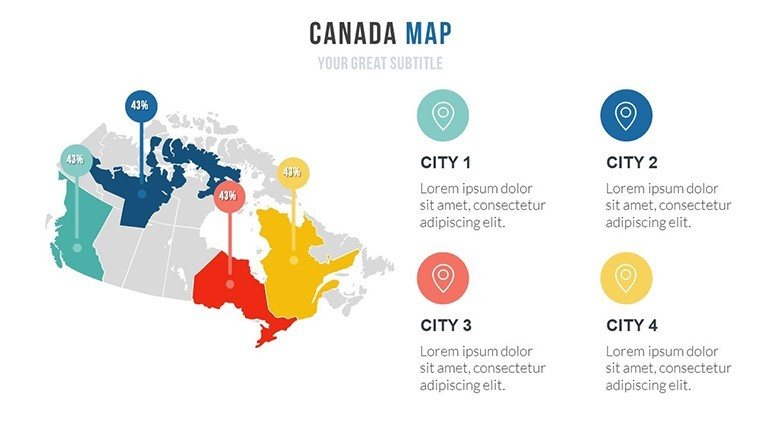
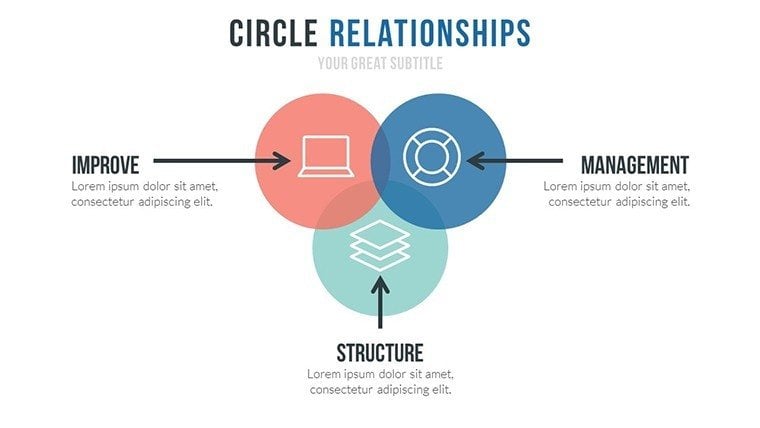
In architecture, success hinges on relationships - between teams, clients, and stakeholders. Our Relationships PowerPoint Charts Template, with 18 editable slides, visualizes these connections masterfully. Crafted for architects, project managers, and consultants, it helps map org structures in firm hierarchies or partnership networks for joint ventures. Imagine diagramming the interplay in a mixed-use development, from developers to contractors, aligned with AIA collaboration guidelines for smoother executions.
The template's sleek design uses intuitive layouts to demystify complexities, fostering better understanding. Fully compatible with PowerPoint and Google Slides, it's ideal for remote brainstorming or on-site reviews. Architects face relational challenges; this tool addresses them by providing clear, adaptable visuals that enhance communication and reduce misunderstandings.
Standout Features for Relational Mapping
Customization is key here, allowing you to tailor charts to your project's ecosystem.
- Chart Diversity: Hierarchical trees for team structures, matrices for vendor relations, and networks for stakeholder influences.
- Edit Flexibility: Modify colors for role differentiation, fonts for hierarchy emphasis, and layouts for scalability.
- Animation Integration: Reveal connections progressively to build narratives during discussions.
- Professional Polish: High-res elements that maintain integrity across formats.
Surpassing standard tools, it includes pre-set animations for efficiency. Example: A studio mapped client-architect-engineer ties for a bridge project, clarifying roles and speeding approvals. This builds trust and demonstrates your relational expertise.
Deploying in Architectural Relationship Scenarios
Apply this to real challenges, like stakeholder alignments in urban projects.
- Step-by-Step: Partnership Pitches - Introduce with a cover slide. Use matrices to show synergies, add networks for benefits, end with action steps.
- Team Onboarding: Tree charts outline roles, easing integrations in large firms.
- Conflict Resolution: Visualize overlaps to identify and resolve issues preemptively.
Tip: Incorporate icons for visual cues, like links for partnerships. Keep designs minimal - focus on 4-6 nodes per slide for clarity. Feedback from users highlights improved collaboration, with fewer emails needed post-presentation.
Your Gateway to Stronger Architectural Bonds
This template transcends slides; it's a catalyst for stronger ties in your practice. In an interconnected industry, clear visualizations are essential for thriving partnerships. Educators use it for teaching collaborative design, students for portfolio networking maps.
Forge better relationships - download this essential template and connect with impact.
Frequently Asked Questions
How do I customize relationship nodes?Easily add, remove, or label nodes to fit your specific connections.Compatible with collaborative platforms?Yes, seamless in Google Slides for group edits.Animations for complex networks?Included, with paths to trace relationships dynamically.Can I export to other formats?Yes, save as PDF or images for broader sharing.Suitable for large-scale projects?Scalable designs handle extensive stakeholder maps.Any templates for specific industries?While general, it's adaptable for architecture-focused relations.Good for
- Project roadmaps and sprint plans
- Product launch timelines
- Quarterly or annual review decks
- Company history and milestone summaries
Licence
reviews
Downloaded this for a sales chart presentation and it did the job.
The graphs were easy to replace with my own numbers during work.
I’m not really into design stuff but the slide layout looked organized.
Some icons felt random but the chart pages were useful.
Finished my finance homework faster because most of the tables were already there.
FAQ
Will it work in Google Slides?
Are fonts embedded?
Can I use this for client work?
What's the refund policy?
Do you update the template after purchase?
Similar templates
See all PowerPoint Charts →
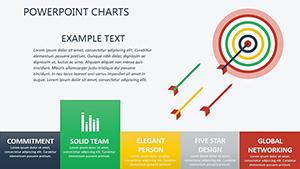
All 18 slides