 Click to zoom
Propel Finance Keynote Charts: Growth Drives
| Format | .pptx |
| Slides | 34 unique layouts |
| Aspect ratio | 16:9 |
| Compatibility | PowerPoint |
| Animated | No |
| Language | English |
| License | Commercial |
| File size | — |
| Version | v1.0 |
| Last updated | November 2021 |
What's inside
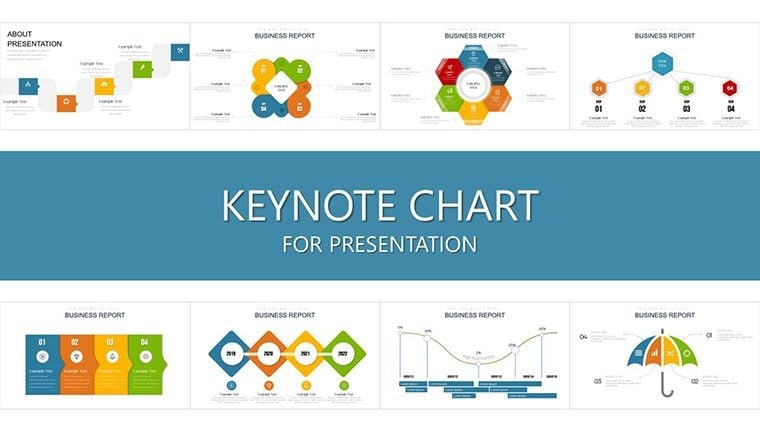
Architecture thrives on momentum, yet funding fluxes can stall even the boldest visions. The Propel Finance Keynote Chart Presentation template ignites that drive with 34 slides engineered to chart cyclical financial journeys - from seed capital surges to revenue reinvestments. Aimed at visionary principals steering firms through expansion ebbs, it visualizes not just numbers, but narratives of scalable success, infused with design-sector savvy like capex on custom facades.
Amid rising material costs (up 18% YoY, per Dodge Data), this template arms you to anticipate and accelerate. It reframes finances as fluid cycles, where each chart pulses with potential, turning quarterly quagmires into quarterly conquests.
Drive Dynamics: Features Fueling Forward
Keynote-core with PowerPoint portability, these 34 editable gems flex with your fiscal fingerprint: Recast colors for brand-aligned cycles (vibrant for venture phases), embed projections via linked cells, and resize for dashboard digs.
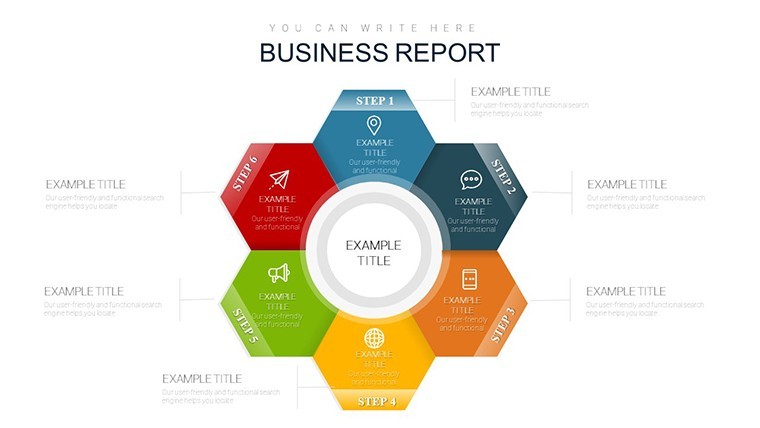
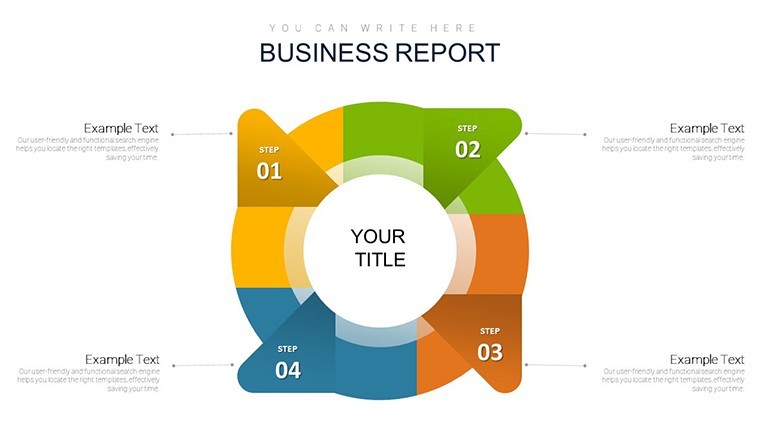
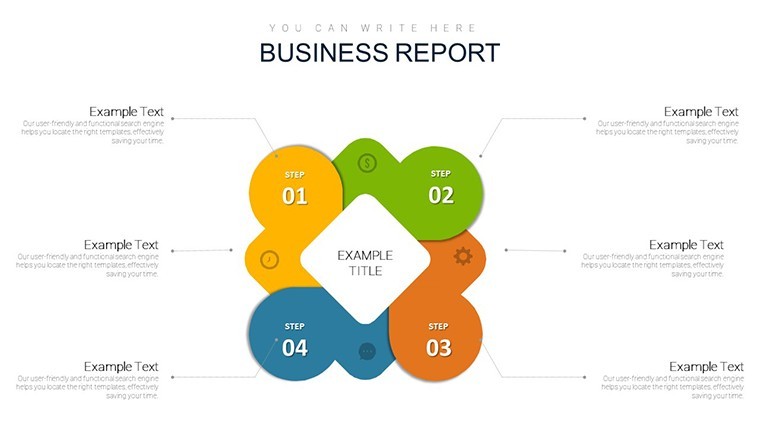
- Cycle Catalysts: Vortex charts vortexing cash inflows to outflows, spotlighting growth gears.
- Resource Rockets: Funnel visuals funneling funds through project pipelines.
- Opportunity Orbits: Radar plots orbiting ROI horizons, with archi-icons like crane silhouettes.
Signature spark: Cyclical motifs mirroring build phases - looping arches for recurring revenues - infuse fiscal talks with familiar flair.
Gearing into Growth Workflows
Mesh it masterfully: Sync with Xero for live ledger pulls, animate orbits to orbit opportunities. Team tunes? Cloud collab keeps cycles synced across studios.
From Funding to Flourish: Propelling Cases
Spotlight a Portland practice scaling to multifamily: Propel’s cycle cascades traced venture debt loops, identifying a 22% leverage lift via phased financing - pivotal in a 20-slide lender lure that landed lines of credit.
Training turf: Mentor on fiscal fitness? Cycle through expansion eddies, letting associates adjust variables for venture viability. Mirroring AIA fiscal forums, adopters note 32% refined reinvestment rates.
- Capital Cycles: Ring charts ringing initial infusions.
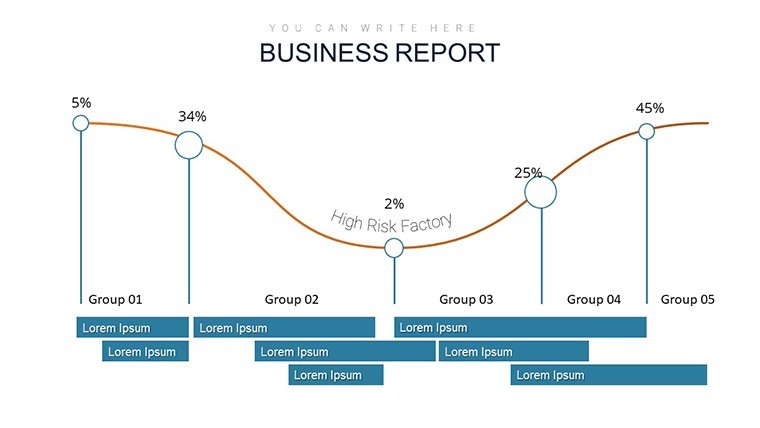
- Growth Gyrations: Wave forms waving through workload waves.
- Reinvestment Rounds: Bullseye targets for tactical turnarounds.
Such stories scaffold sustainable strides.
Surpassing Standard Spreadsheets
Plain PowerPoint plots? Static as stalled scaffolds. Propel's propulsion - tunable tori for tempo tweaks - prophesies patterns, priming preemptive plays. Perks: Note-nuggets for nuanced navigations.
Payoffs: Halve horizon scanning, per Building Design+Construction buzz; galvanize governance with graphical gravitas.
Hacks for High-Octane Handling
Turbocharge tailoring: Template to your ticker, typeface in futuristic Futura. Blend with Bluebeam bids for blended bids. Animate advances to advance audiences, captivating capital circles.
It propels in pioneering pursuits, from pop-ups to paragons.
Launch Your Financial Flight
Finance fuels flights of fancy into form. Propel with the Propel Finance Keynote Chart Presentation to pilot yours. Snap it up now and soar strategically. Momentum beckons.
Frequently Asked Questions
Adaptable for architecture funding cycles?
Ideally - tune for bespoke builds, from grants to green bonds.
Custom colors and sizes?
Effortless - vectors vibe with your vision, scalable sans snag.
Built-in animations for dynamics?
Affirmative, orbiting elements that energize engagements.
Slide tally and cross-tool use?
34; glides to Google Slides for global teams.
Track project resource propulsion?
Precisely, via tailored tori for task-to-treasury traces.
Good for
- Project roadmaps and sprint plans
- Product launch timelines
- Quarterly or annual review decks
- Company history and milestone summaries
Licence
reviews
Used this for uni slides, graphs were useful.
Layout is simple and not confusing.
Didn’t care much about visuals honestly.
Some spacing felt off but manageable.
It’s okay for quick use.
FAQ
Will it work in Google Slides?
Are fonts embedded?
Can I use this for client work?
What's the refund policy?
Do you update the template after purchase?
Similar templates
See all Keynote Charts →
All 34 slides