 Click to zoom
Profit Forecast PowerPoint Template - Editable PPTX | ImagineLayout
| Format | .pptx |
| Slides | 27 unique layouts |
| Aspect ratio | 130/73 |
| Compatibility | PowerPoint |
| Animated | No |
| Language | English |
| License | Commercial |
| File size | — |
| Version | v1.0 |
| Last updated | May 2026 |
What's inside
Profit Forecast PowerPoint Template - Real Usage Notes
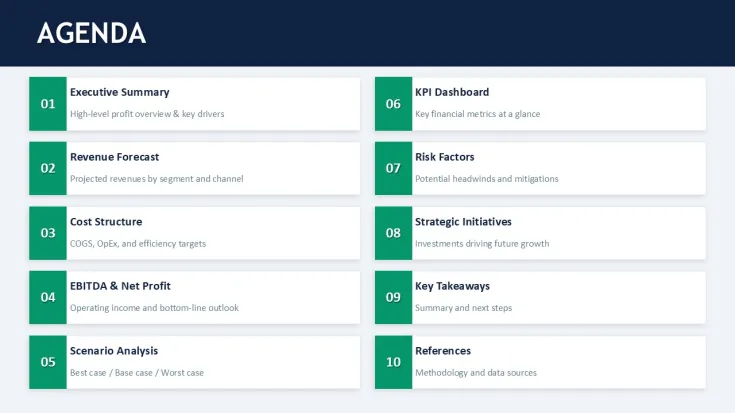
This template is built around a full annual profit forecast structure - about 10 slides covering everything from executive summary through scenario analysis and KPI dashboards. It`s not just a random set of charts. The sequence actually follows how a finance team would present projections internally: revenue → costs → EBITDA → scenarios → risks. That structure matters more than people think.
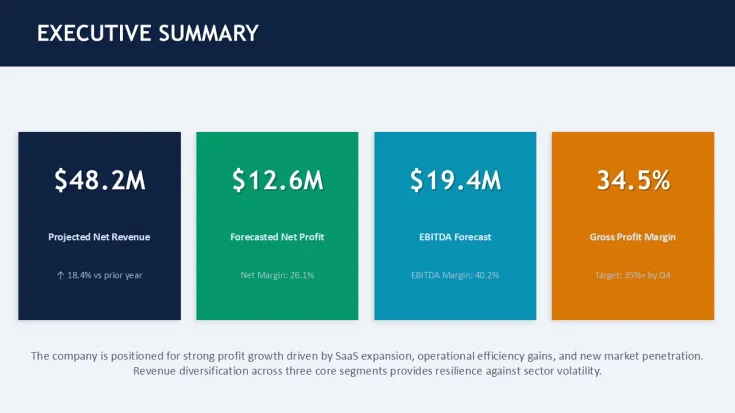
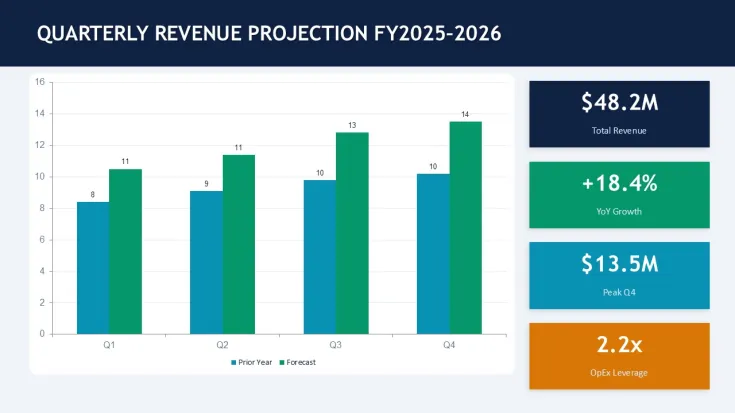
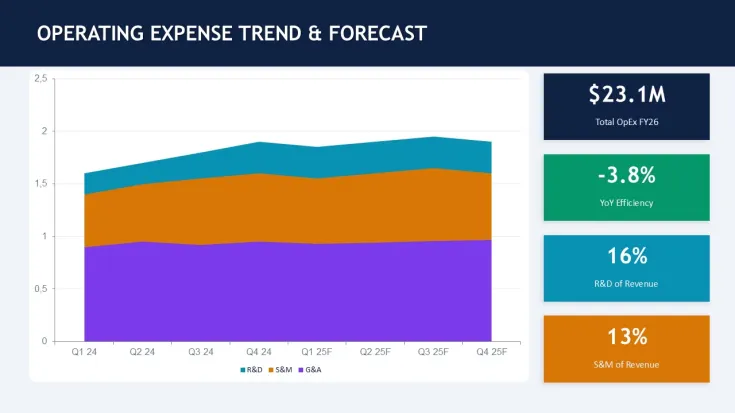
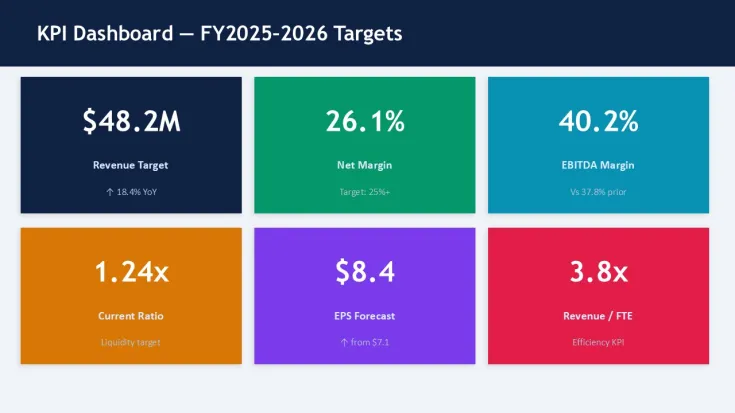
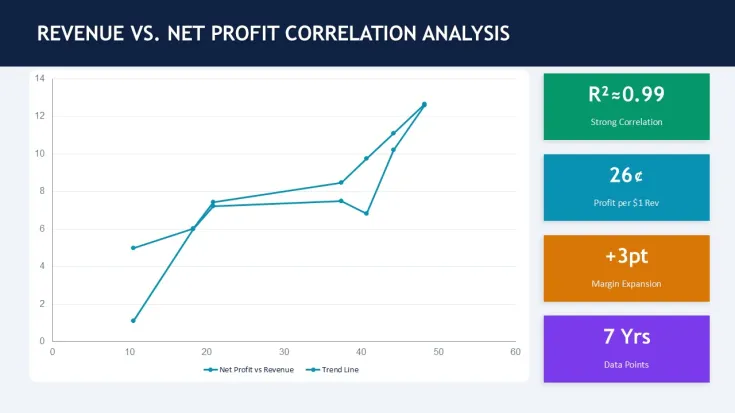
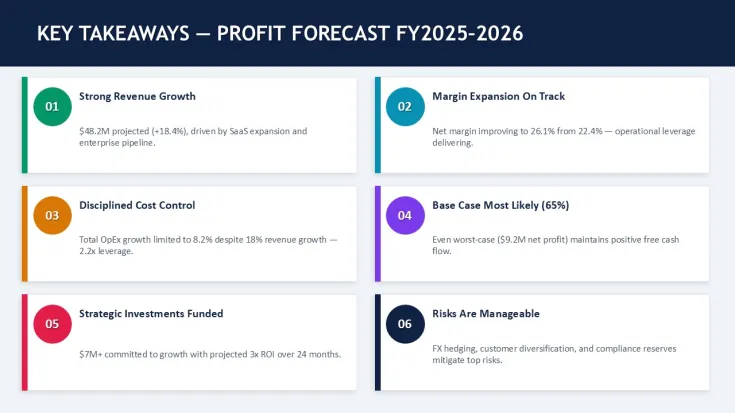
When I opened the file, the first thing I noticed was how the numbers blocks behave. You can drop in fairly long financial figures or add extra annotations, and the spacing doesn`t collapse. The headline metrics (like revenue, EBITDA, margin) sit in large numeric blocks with small captions underneath, and they scale cleanly. I tested this by replacing values with longer text labels - still held alignment, which is not always the case in cheaper templates.
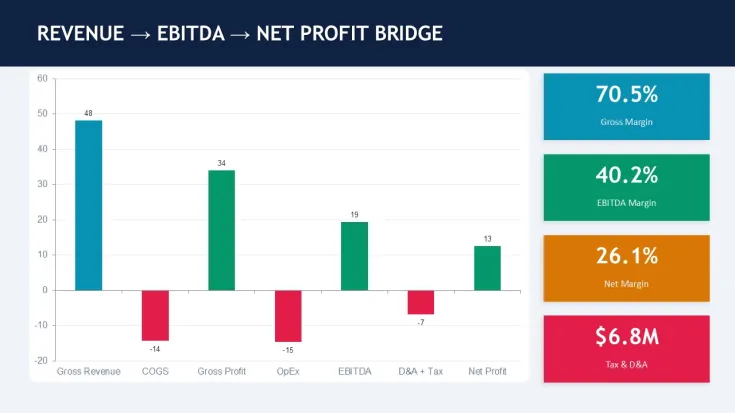
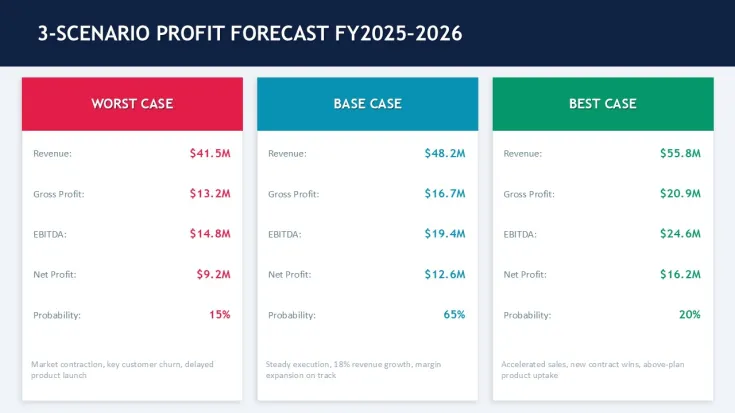
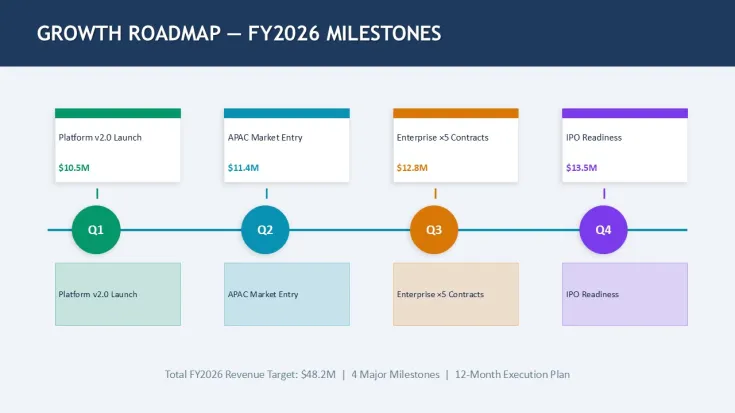
The horizontal flow layouts are genuinely well-structured - especially the revenue-to-profit bridge slide. Each stage (revenue → EBITDA → net profit) is spaced evenly, and there`s enough room to explain adjustments like taxes or depreciation without cramming text. That`s something many free templates mess up. Also, the scenario analysis slide uses three vertical blocks with probability labels and narrative text underneath. Simple idea, but the spacing is actually usable.
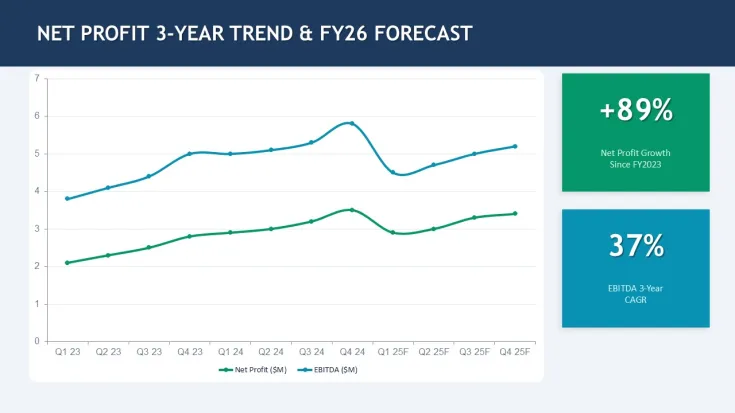
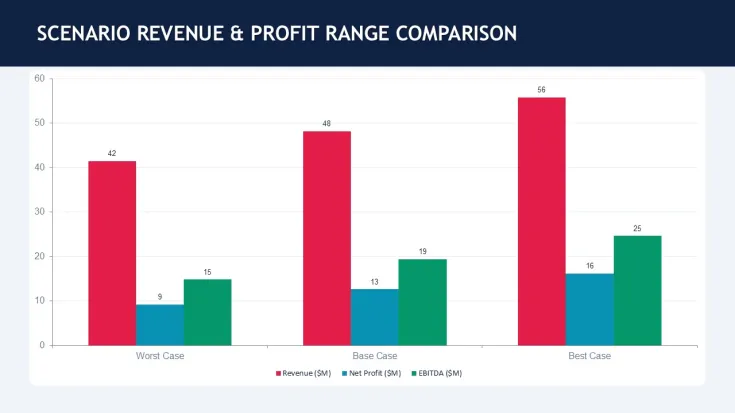
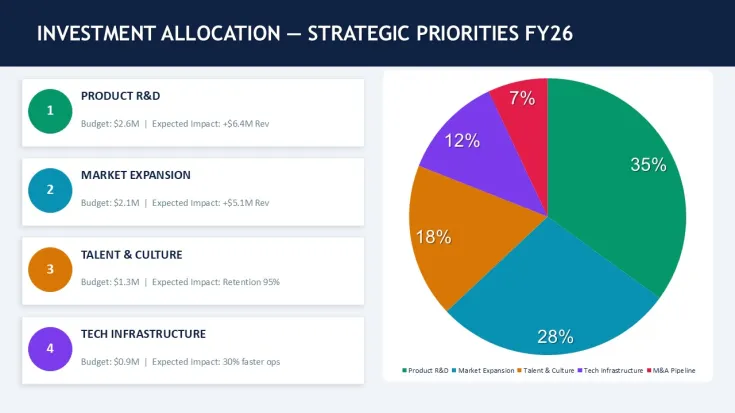
Visually, most diagrams are grid-based. KPI dashboards are arranged in a 2x3 or 3x2 metric grid, with each cell containing one number and a small descriptor. Icons are minimal and mostly solid shapes - no outlines, no decorative clutter. Charts are more like placeholders rather than data-driven Excel charts, so you`re mostly editing shapes and text rather than linking datasets. Works fine if you`re presenting summarized numbers. Not ideal if you need dynamic charts. That`s the trade-off here.
Honestly, I just opened it, changed the colors in the master, and it looked fine. Took maybe five minutes. The color system is one of the better-built parts - one change in the master and the whole deck updates consistently. Slightly confusing at first because some accents are tied to secondary theme colors, but once you see it, it`s quick.
But here`s the limitation. This isn`t a template for heavy data modeling or detailed financial tables. If you need multi-sheet breakdowns or complex Excel-linked visuals, you`ll end up rebuilding parts of it. In practice, this works best for summary-level presentations - board meetings, investor previews, internal strategy reviews. That`s where it fits.
You know that situation when the deck is due tomorrow and you just need a clean forecast structure? This is exactly that. You drop in your numbers, adjust a few labels, and move on. No extras. Works as-is.
The scenario comparison slide is probably the most useful one. Three clear columns, each with revenue, EBITDA, net profit, and a short explanation. I liked how the probability percentages are built into the layout - you don`t need to add them manually. Small detail, but it saves time. Also works for internal team updates, not just client decks.
For analysts, finance managers, or founders preparing investor decks, this gives you a solid base. Not flashy. But structured in a way that matches real financial storytelling. That`s actually the point here.
Download and start editing immediately
Specifications
FeatureDetailsSlides/diagrams10 slides including KPI dashboards, scenario blocks, revenue breakdownsFile format.pptx editable with standard PowerPoint toolsSoftware versionPowerPoint 2016+ fully supportedColor schemesMultiple theme colors editable via slide masterEditable elementsAll text blocks, metric cards, and diagrams resize independentlyAspect ratio16:9 widescreen layoutFree vs PaidFree version limited slides, paid includes full forecast structureMasters/BackgroundsCentralized master with global color and font controlFAQ
How do I change colors in this template?Go to View → Slide Master and look at the theme colors panel. That`s where most of the accents are controlled. Some elements use secondary tones, so you might need to tweak 2-3 colors instead of just one. After that, everything updates automatically across slides.
Can I use this template for client work?It`s the same license most marketplaces use - one buyer, one project, commercial use is fine. You can present it to clients, export it, share results. Just don`t redistribute the template file itself. That`s basically it.
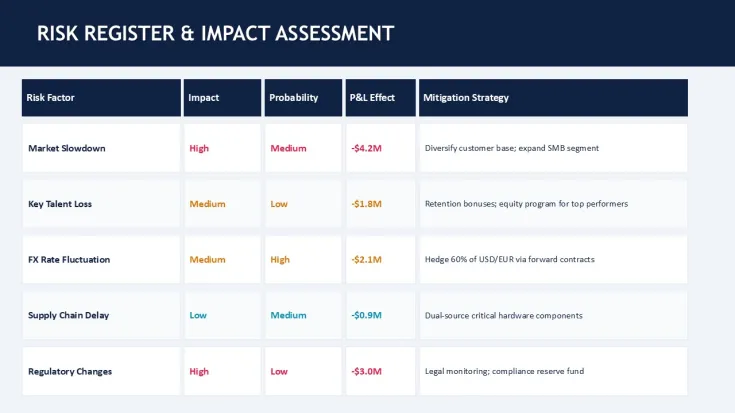
What`s the difference between free and paid versions?The short answer is: free gives you a small sample, paid unlocks the full set. The paid version includes all slides like scenario analysis, KPI dashboards, and risk sections. If you`re building a full forecast deck, you`ll need the paid one. Otherwise, the free version is more of a preview.
Are refunds available after purchase?Depends a bit on the marketplace policy. Usually, digital downloads aren`t refundable once accessed. In most cases, you`d need to contact support if there`s a technical issue. Not really designed for returns.
Can I export this presentation to PDF or video?So basically, yes - standard PowerPoint export works fine. You can save as PDF, video, or even share online. No special setup needed. Oh, and you can also export to PDF directly from the file menu.
Good for
- Project roadmaps and sprint plans
- Product launch timelines
- Quarterly or annual review decks
- Company history and milestone summaries
Licence
reviews
The revenue bridge chart is the best part of this pack because it clearly shows the gap.
I used the three scenario columns to present optimistic
The KPI metric blocks are large and bold so the board could read them from the back of the room.
The EBITDA flow diagram saved me from drawing it by hand for the third time this month.
Its a solid finance pack for the end of quarter crunch.
FAQ
Will it work in Google Slides?
Are fonts embedded?
Can I use this for client work?
What's the refund policy?
Do you update the template after purchase?
Similar templates
See all PowerPoint Charts →
All 27 slides