 Click to zoom
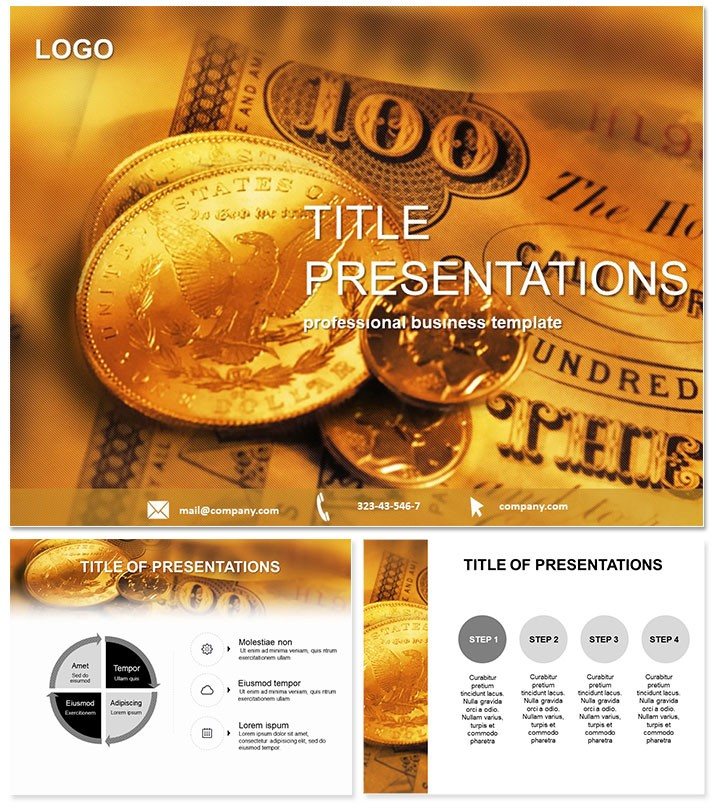
Money USA PowerPoint Template for Finance
| Format | .pptx |
| Slides | 3 unique layouts |
| Aspect ratio | 16:9 |
| Compatibility | PowerPoint |
| Animated | No |
| Language | English |
| License | Commercial |
| File size | — |
| Version | v1.0 |
| Last updated | October 2021 |
What's inside
Feel the pulse of markets in your palm - dollar signs scaling skyscrapers, trends tracing economic horizons, slides that bank on bold visuals to balance books and sway stakeholders. This Money USA PowerPoint Template is the vault for finance pros, economists, and bankers crafting credible capital tales. PowerPoint 2016-ready, $22 one-time for lifetime fiscal freedom.
Leverage Visuals for Fiscal Fluency
Finance flourishes on figures that flow, and this template invests 28 slides in that equity. From balance sheets to bull runs, diagrams dividend detail without dilution. Portfolio your points pronto - rebalance bars or forecast futures - and your forecasts fund futures.
Financial Features That Accrue Value
- Three Fiscal Masters: Ledgers for audits, charts for forecasts, icons for overviews.
- Three Economic Backgrounds: Wall Street grids, currency weaves, or bullish blues.
- 28 Monetary Diagrams: Pie portfolios, line ledgers, and waterfall wealth flows.
- Seven Bullish Schemes: Greens for growth, reds for risks, golds for gains.
- Dynamic Data Links: Pull from QuickBooks or Excel for live ledger updates.
Audited by accountants, these assets appreciate accuracy and allure.
Portfolio of Slide Investments
Stake your claim with Slide 1`s eagle-emblazoned banner. Slide 5`s area chart accumulates asset growth, shaded by sectors. Trade tales on Slide 12 - a candlestick chronicle of trades, wicks whispering volatility.
Policy plays in Slides 19-23: a stacked column (Slide 21) segments GDP drivers. Harvest on Slide 28 with a treasury timeline, compounding key events.
This bull market of builds brokers belief from base to boom.
Monetary Missions: From Markets to Main Streets
A Fed briefing bonds as yield curves yield insights, influencing interest. Startup pitches parlay projections, procuring partners. A CFO shared how revenue radars radar rivals, refining routes to record returns.
From crypto crashes to credit crunches, it monetizes messages, minting mastery.
Compounds Over Common Currency
Plain pennies pale; these profiles profit with precision gradients. Basics bear bare bones; here, hover highlights harvest hidden trends. It`s compounded confidence, crediting clarity over clutter.
Invest in impact. Claim the Money USA PowerPoint Template now and currency your command.
Frequently Asked Questions
US-specific financial icons?
Yes, from IRS forms to NYSE bells, all vectorized.
Integrate with finance tools?
Seamless with Tableau exports or API-fed charts.
Risk visualization strengths?
Monte Carlo sims via scatter plots, VaR via funnels.
Print-ready for reports?
High-fidelity vectors ensure crisp boardroom binders.
Global currency support?
Editable symbols for USD, EUR, and beyond.
Compliance notes?
Neutral designs aid SEC-friendly disclosures.
Good for
- Project roadmaps and sprint plans
- Product launch timelines
- Quarterly or annual review decks
- Company history and milestone summaries
Licence
reviews
My econ professor wanted a presentation on market trends and this template had all these cool area charts and risk radars already set up. Made my project look like I actually knew what i was talking about
Pulled an all-nighter for a startup pitch and the ledgers and balance sheets in here were a lifesaver. The red risk and green growth color schemes are exactly what you need when you're trying to show investors the potential. Worth the money for the time it saved me.
Wasn't a fan of the default fonts but the vector icons are solid
especially those money bag and trend arrow ones. The Wall Street grid background is a bit much for my taste but the plain blues work fine for a standard report.
Had to put together a quarterly earnings deck for the board last night and these Money USA slides saved me. The candlestick charts and dollar-sign icons made the financial data look way more legit without me fiddling with graphs for hours. Just swapped out the numbers and was done.
Not bad for finance stuff
i used the cash flow waterfall diagram for a client meeting and they actually understood where the money was going. Some of the color schemes are a bit aggressive but you can tone them down.
FAQ
Will it work in Google Slides?
Are fonts embedded?
Can I use this for client work?
What's the refund policy?
Do you update the template after purchase?
Similar templates
See all PowerPoint Templates →


All 1 slides