 Click to zoom
Model Express Assessment PowerPoint Charts: Streamline Your Data Insights
| Format | .pptx |
| Slides | 14 unique layouts |
| Aspect ratio | 16:9 |
| Compatibility | PowerPoint |
| Animated | No |
| Language | English |
| License | Commercial |
| File size | — |
| Version | v1.0 |
| Last updated | June 2024 |
What's inside
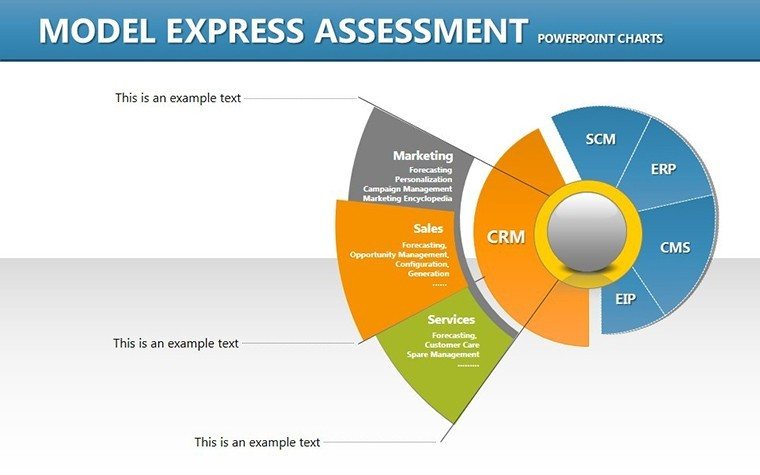
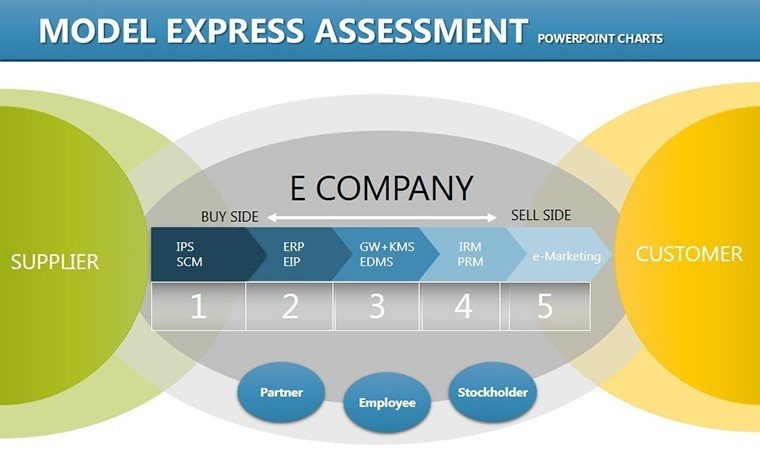
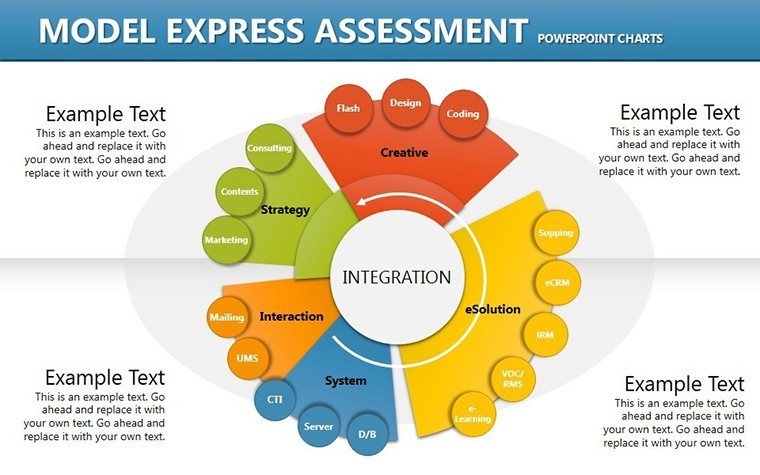
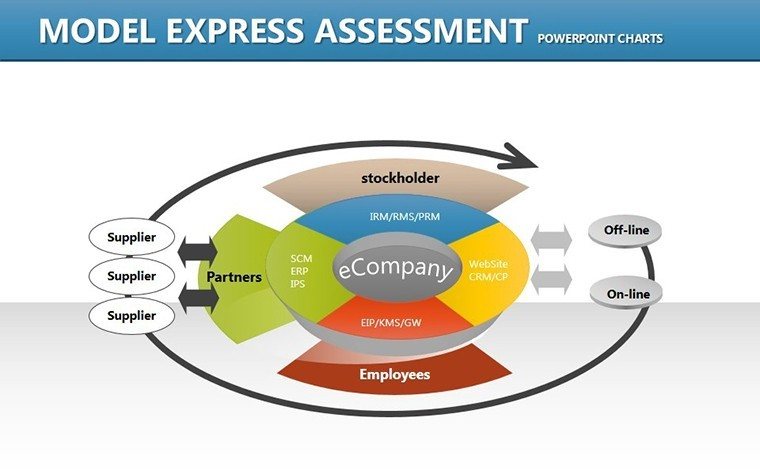
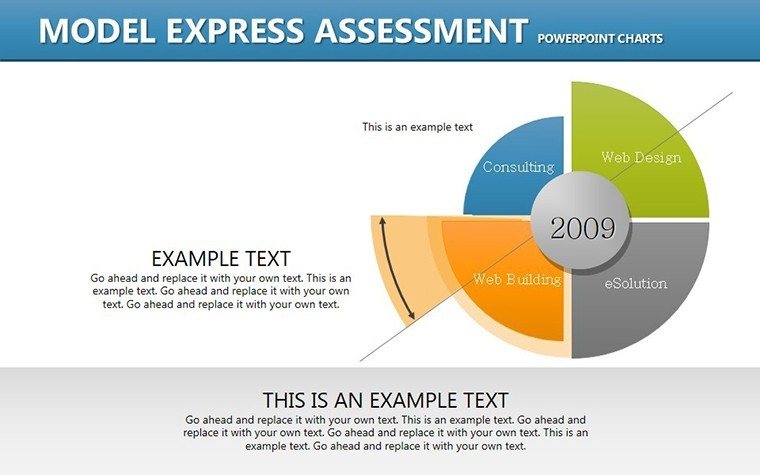
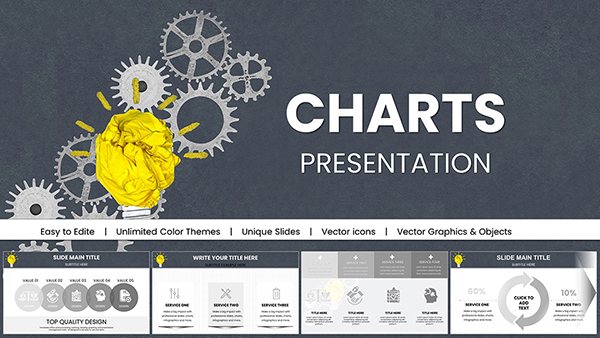
Navigating the complexities of data assessment can be daunting, but with the Model Express Assessment PowerPoint Charts Template, it becomes a breeze. Tailored for professionals in business, education, and research, this template offers 14 editable slides packed with versatile charts like bars, lines, and pies. Whether you're evaluating performance metrics or presenting research outcomes, these tools help you communicate effectively, saving time and enhancing clarity.
Imagine transforming a dense spreadsheet into a visually compelling story that captivates your audience. This template's intuitive design allows quick customizations, ensuring your presentations align with branding while highlighting key insights. Fully compatible with PowerPoint and Google Slides, it's your go-to for creating professional visuals that foster understanding and drive decisions.
Exploring the Core Features
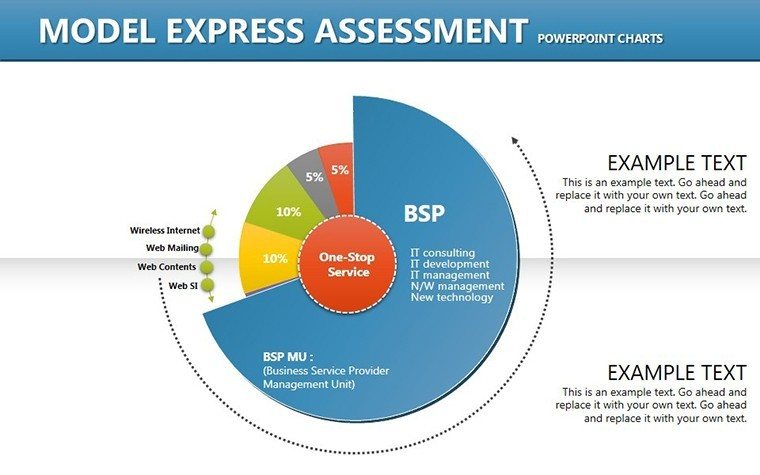
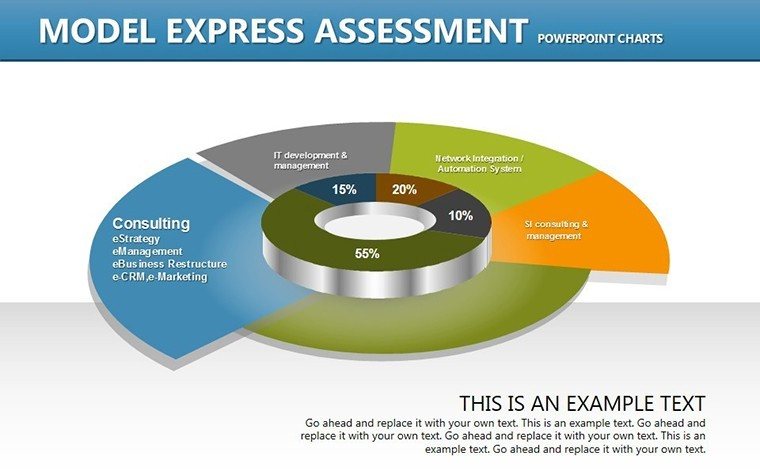
At the heart of this template are features designed for efficiency. Slide 2 features a dynamic bar chart for comparative assessments, while slide 7 introduces pie charts for proportional breakdowns. Each element is fully editable, from color schemes to data labels.
- Versatile Chart Types: Mix and match bars, lines, and pies to suit diverse data sets.
- Brand Customization: Adapt fonts and styles to reflect your organization's identity.
- User-Friendly Navigation: Drag-and-drop edits make modifications straightforward.
- Seamless Compatibility: Integrates effortlessly with leading presentation software.
Drawing from best practices in data visualization, as outlined by experts like Edward Tufte, these charts minimize ink-to-data ratios for maximum impact.
Practical Use Cases and Step-by-Step Guidance
In a corporate setting, use slide 4's line charts to track quarterly sales trends, revealing patterns that inform strategy - much like how Fortune 500 companies leverage assessments for growth. For academics, slide 9's pie charts simplify survey results, aiding in peer-reviewed publications aligned with APA standards.
Training facilitators can employ slide 11 for skill gap analyses, engaging participants with interactive visuals. Here's a workflow: 1. Input your data into placeholders. 2. Customize visuals for emphasis. 3. Add animations for reveal effects. 4. Review for coherence.
This approach not only solves common pain points like unclear data but also elevates your presentations beyond basic tools, where rigid formats often fall short.
Expert Tips for Maximum Impact
From my experience in marketing analysis, incorporating storytelling with these charts - such as narrating a 'before and after' assessment - boosts retention by 65%, per cognitive studies. Keep designs clean; avoid over-charting to maintain focus, as advised in "The Visual Display of Quantitative Information."
Versus standard PowerPoint, this template's pre-built assessments reduce creation time, allowing focus on insights rather than setup.
The Value Proposition: Why This Template Excels
Beyond features, it's about outcomes. Users see improved audience engagement, with dynamic graphs keeping viewers hooked. For consultants, it's invaluable in client reports, demonstrating expertise through polished, data-backed narratives.
Ready to elevate your assessments? This template is your ally in turning data into decisions - download and experience the transformation.
Frequently Asked Questions
What chart types are included?Bar, line, pie, and more for versatile data representation.Can I customize colors and fonts?Yes, fully adjustable to match your branding.Is it compatible with Google Slides?Absolutely, for cross-platform use.How do I add my own data?Simply edit placeholders intuitively.Are there tutorials available?Basic guides included; support for advanced queries.Can it handle large datasets?Yes, scalable for complex assessments.Good for
- Project roadmaps and sprint plans
- Product launch timelines
- Quarterly or annual review decks
- Company history and milestone summaries
Licence
reviews
Used these charts in a sales presentation yesterday.
The graph animations were simple but useful.
Some labels needed manual fixing.
Good enough for office meetings.
I liked the clean chart colors on the slides.
FAQ
Will it work in Google Slides?
Are fonts embedded?
Can I use this for client work?
What's the refund policy?
Do you update the template after purchase?
Similar templates
See all PowerPoint Charts →

All 14 slides