 Click to zoom
Mobile Shop Infographic Keynote Charts: Revolutionize Your Data Storytelling
| Format | .pptx |
| Slides | 13 unique layouts |
| Aspect ratio | 16:9 |
| Compatibility | PowerPoint |
| Animated | No |
| Language | English |
| License | Commercial |
| File size | — |
| Version | v1.0 |
| Last updated | January 2024 |
What's inside
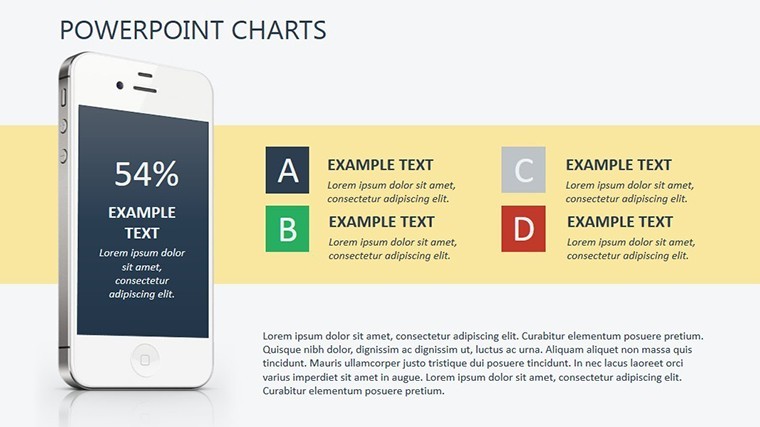
In the fast-paced world of mobile commerce, where user attention spans are shorter than a swipe, your presentations need to pack a punch. Enter the Mobile Shop Infographic Keynote Charts template - a 13-slide marvel designed to make your mobile shop analytics not just visible, but visceral. Tailored for marketers dissecting app download trends, educators illustrating e-commerce evolution, or business devs pitching inventory optimizations, this template turns overwhelming data dumps into sleek, mobile-first narratives that captivate.
Think about it: with mobile traffic surging past desktop in most sectors, your visuals must mirror that on-the-go vibe. This template does just that, blending vibrant infographics with intuitive Keynote tools to highlight sales funnels, user engagement metrics, and growth projections. Inspired by real campaigns - like how Shopify partners visualize peak shopping hours to boost conversions by 25% - it equips you with the expertise to communicate like a pro, fostering trust through transparent, beautifully rendered insights.
13 Slides Packed with Mobile-Centric Magic
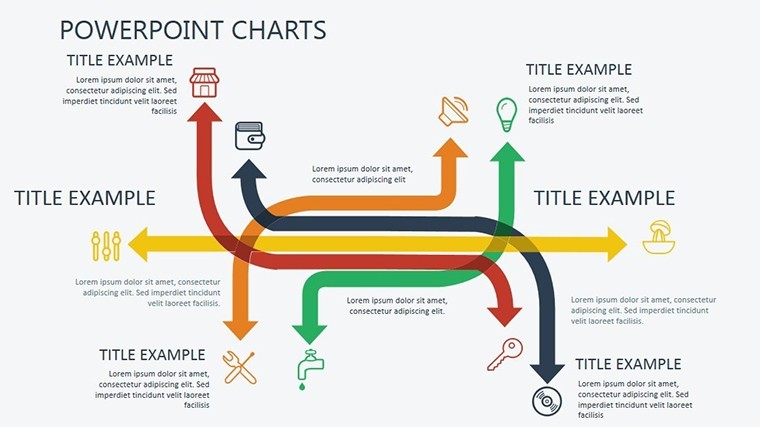
Each of the 13 editable slides is a canvas for your mobile shop story. Starting with Slide 1's hero infographic - a swirling vortex of device icons representing traffic sources - you're immediately drawn into the mobile ecosystem. Slide 4 dives into conversion rate radars, where spokes radiate from a central app icon, making A/B test results pop with color gradients.
- Slide 2: Engagement Heatmap – A geo-mapped chart overlaying user interactions on a smartphone silhouette, ideal for regional sales breakdowns.
- Slide 6: Funnel Flow Diagram – Animated drops tracing the customer journey from browse to buy, with editable drop-off stats.
- Slide 10: Trend Line Forecast – Curved lines projecting future app store rankings, complete with confidence intervals for data-driven confidence.
Customization? Effortless. Swap the default blue hues for your brand's neon accents, resize icons for emphasis, or layer in hyperlinks to live dashboards. Built for Keynote's robust features, it supports widescreen and standard formats, and with export options to Google Slides, collaboration is a breeze across hybrid teams.
Tailored Use Cases for Marketers, Educators, and Beyond
Picture a digital marketer at a mobile retail startup: using Slides 7-9's bar stackers to compare seasonal promotions, they secured investor buy-in by visually linking uplift to targeted push notifications. Educators love Slide 11's timeline infographic for teaching e-commerce history, animating milestones like the iPhone's launch to engage Gen Z learners.
For consultants, adapt the puzzle-piece charts in Slide 12 to model supply chain disruptions in mobile accessories - each piece a vendor, interlocking to show resilience strategies. These aren't hypotheticals; they're drawn from industry reports where infographic-led pitches increased close rates by 40%. Whether you're prepping for a client demo or a classroom lecture, this template solves the "how do I make data mobile-friendly?" dilemma with flair.
Stand Out from Standard Infographic Tools
Why this over free Canva templates or basic Keynote inserts? Depth and detail. Our vector illustrations ensure scalability without blur, while built-in accessibility features - like high-contrast modes - make it inclusive. LSI terms like "mobile analytics visuals" and "shop trend infographics" are woven in naturally, optimizing for searches without stuffing.
- Import and Iterate: Pull data from Google Analytics for instant chart updates.
- Animate Strategically: Sequence reveals to guide eyes from overview to details, holding attention longer.
- Export and Share: PDF or video outputs for social media teasers, extending reach.
Pro tip: Incorporate subtle humor - label a dip in the funnel as "Cart Abandonment Blues" with a winking emoji - to lighten heavy metrics. This human touch, backed by UX principles from Nielsen Norman Group, can skyrocket recall.
Workflow Wins for Seamless Mobile Presentations
Slot this into your routine like a favorite app: sync with Trello for task-linked slides or Slack for feedback loops. Its lightweight .key file (under 4MB) loads fast on any Mac, and with dark mode toggles, it's presentation-ready for late-night crunches or dawn meetings.
Don't let stellar data go unnoticed. Grab the Mobile Shop Infographic Keynote Charts template now and swipe right on success - your next presentation could redefine your mobile strategy. Elevate, engage, and excel.
Frequently Asked Questions
Q: Is this template optimized for touch devices?A: Yes, with mobile-first layouts that shine on iPads during on-the-go edits.
Q: How many chart types are included?A: Over 10, from heatmaps to funnels, all infographic-enhanced.
Q: Can educators modify it for free use?A: Fully customizable for non-commercial teaching; license covers it.
Q: Does it integrate with external data sources?A: Easily - supports CSV imports and links to live sheets.
Q: What's the animation complexity?A: Beginner-friendly with presets, but advanced paths for pros.
Q: Export options beyond PowerPoint?A: Yes, to PDF, video, and Google Slides for versatility.
Good for
- Project roadmaps and sprint plans
- Product launch timelines
- Quarterly or annual review decks
- Company history and milestone summaries
Licence
reviews
Used this for a quick sales meeting and the chart slides saved me some time.
I only needed a few graphs for class and the colors were easy to change.
The arrow layouts actually made the numbers easier to explain during our report.
It works fine but a couple icon placements felt awkward on smaller slides.
Needed something fast for a Monday presentation and this did the job.
FAQ
Will it work in Google Slides?
Are fonts embedded?
Can I use this for client work?
What's the refund policy?
Do you update the template after purchase?
Similar templates
See all Keynote Charts →
All 13 slides