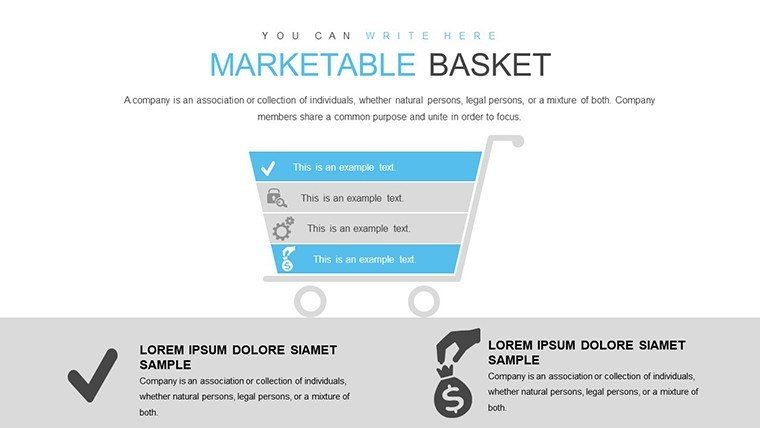
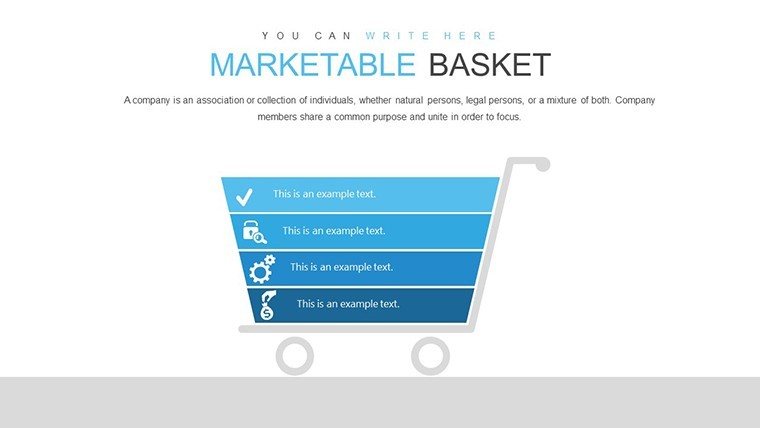
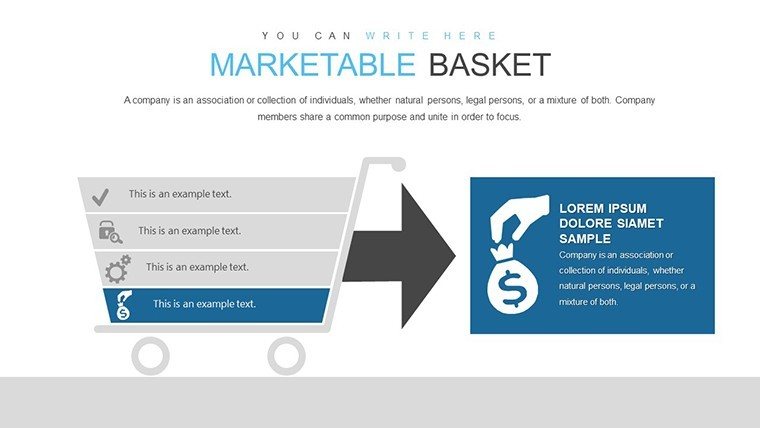
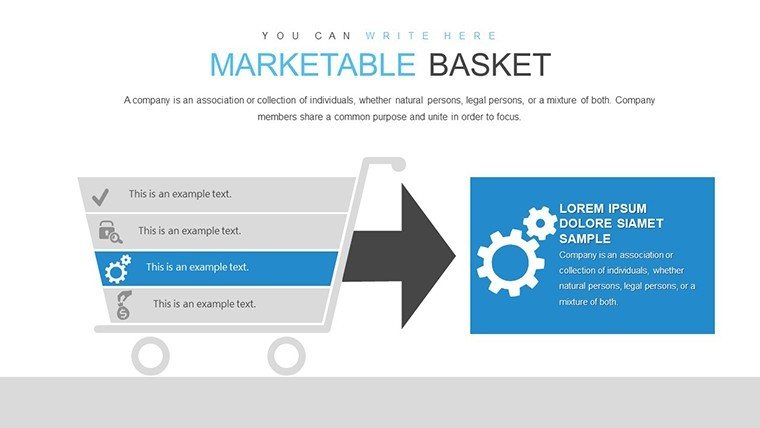
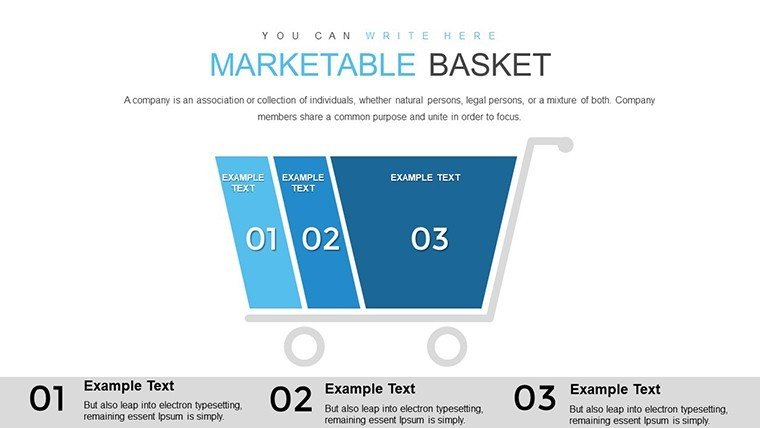
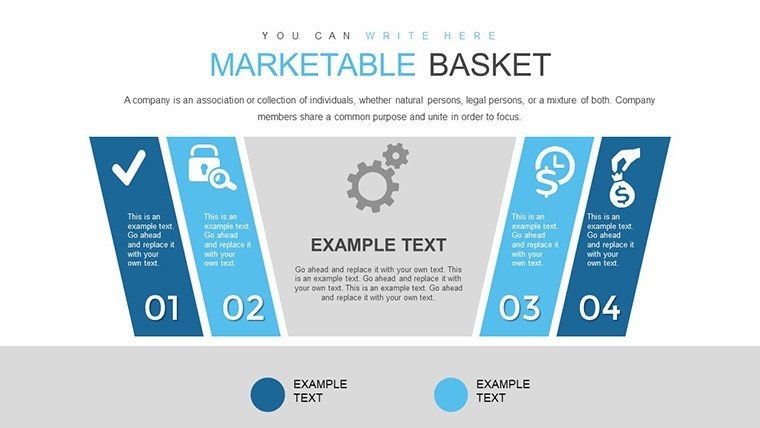
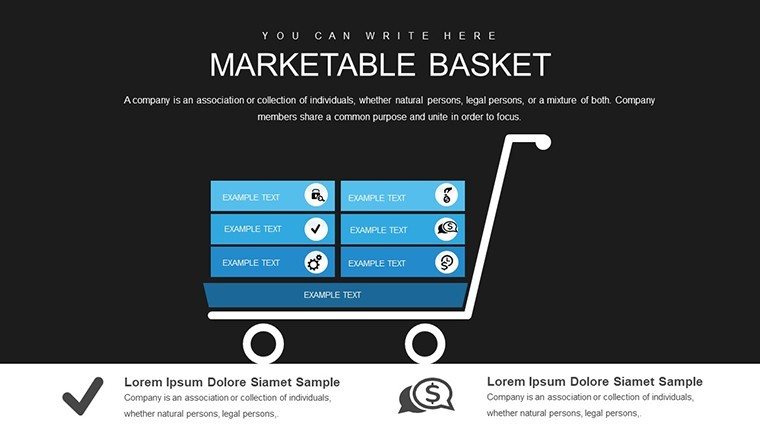
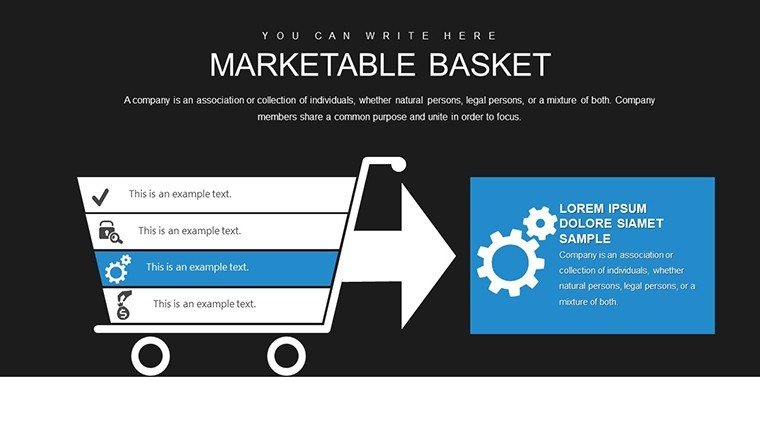
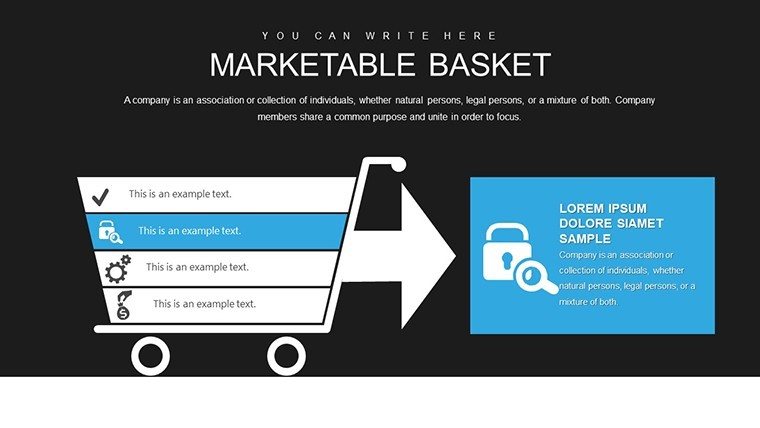
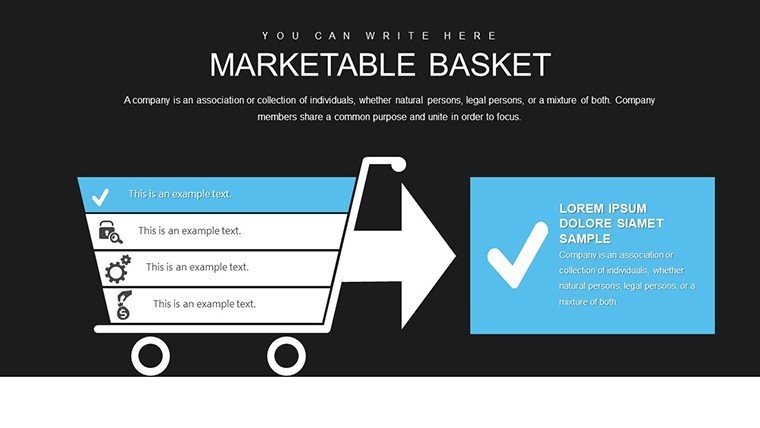
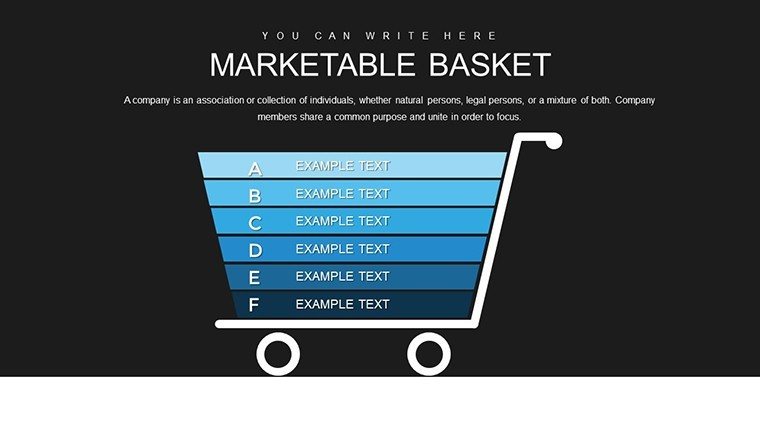
 Click to zoom
Marketable Basket PowerPoint Charts Template for Professional Presentations
| Format | .pptx |
| Slides | 38 unique layouts |
| Aspect ratio | 16:9 |
| Compatibility | PowerPoint |
| Animated | No |
| Language | English |
| License | Commercial |
| File size | — |
| Version | v1.0 |
| Last updated | April 2025 |
What's inside
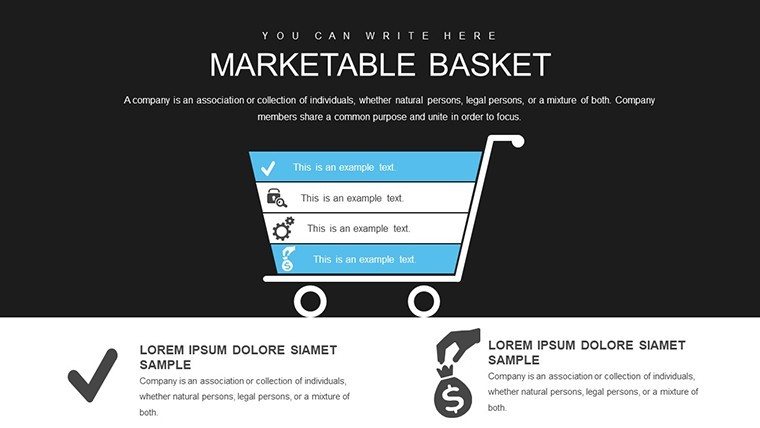
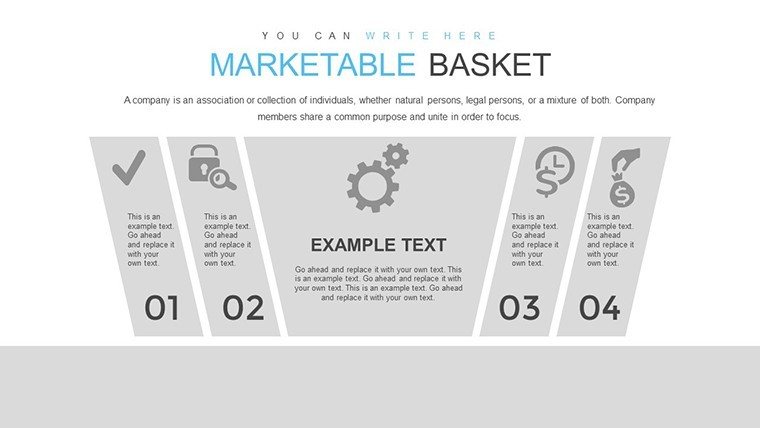
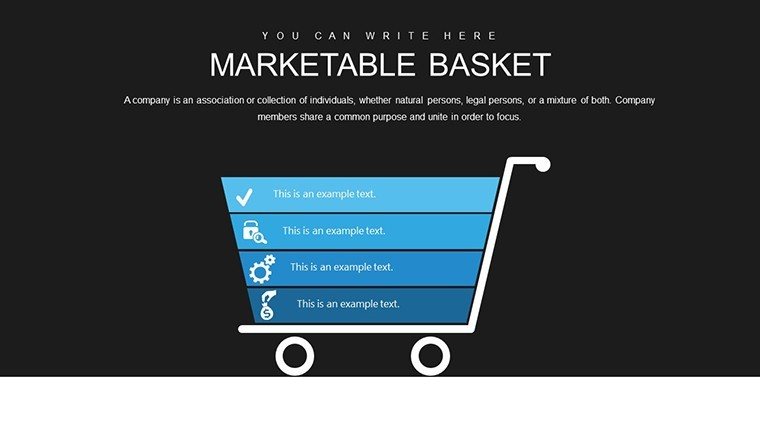
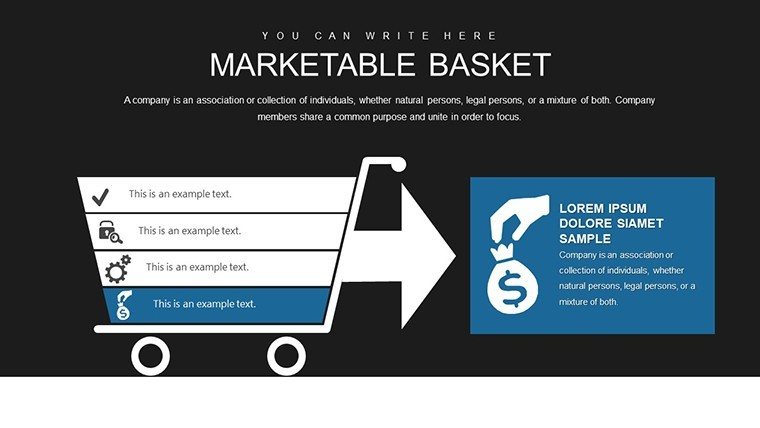
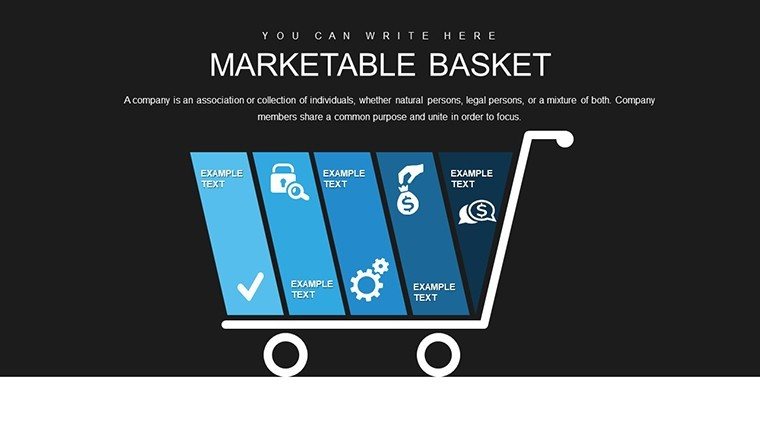
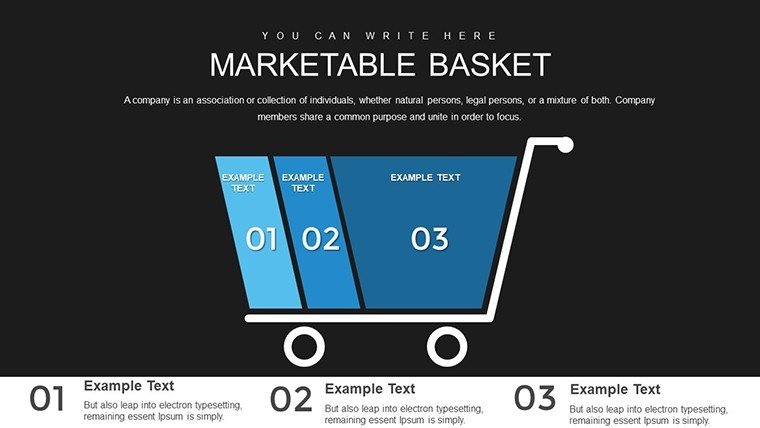
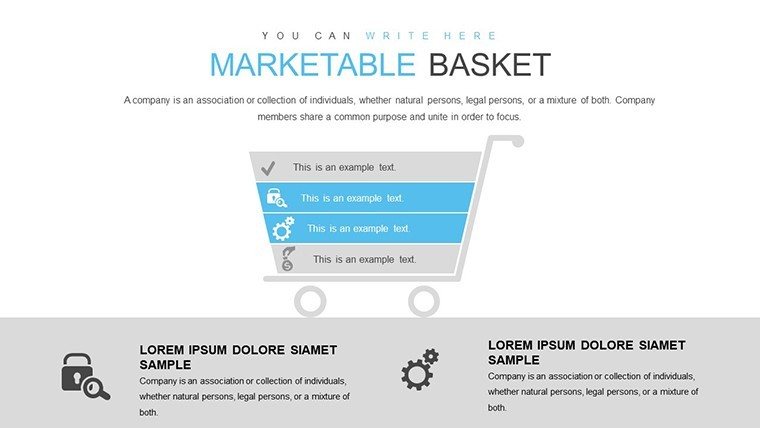
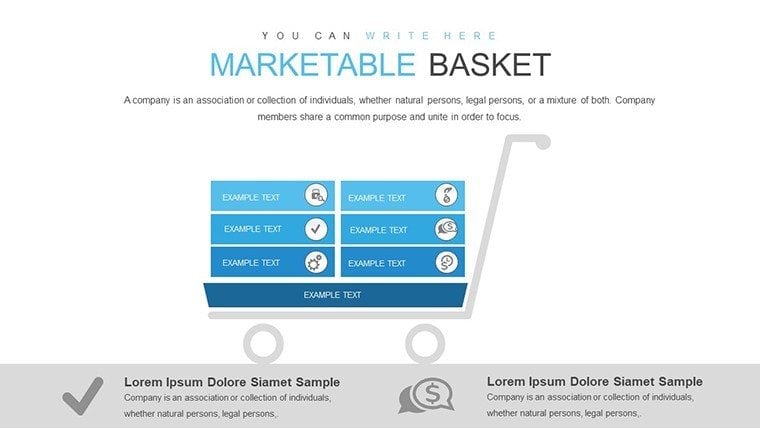
In the realm of data analysis, where understanding consumer behavior drives success, the Marketable Basket PowerPoint Charts Template emerges as a vital resource for marketers, entrepreneurs, and educators. With 38 editable slides dedicated to matrix and analysis visuals, this template enables you to dissect market baskets - groupings of products purchased together - revealing patterns that inform strategies. Envision presenting a retail analysis where pie charts show product affinities, impressing stakeholders with actionable insights derived from techniques like those in the Association for Computing Machinery's data mining standards. Cross-compatible with PowerPoint, Google Slides, and Keynote, it offers drag-and-drop ease, high-res graphics, and customization that aligns with your narrative, turning raw data into persuasive stories for pitches, reports, or lectures.
Dynamic Features for In-Depth Analysis
Central to this template are its dynamic visuals, encompassing pie, bar, line, and area charts, all fully customizable for colors, fonts, and layouts. This flexibility allows tailoring to specific datasets, such as adjusting bar heights for sales comparisons or shading areas for trend overlaps. The user-friendly interface requires no design prowess, while regular updates ensure fresh chart designs, keeping your presentations cutting-edge.
Exploring the 38 Analytical Slides
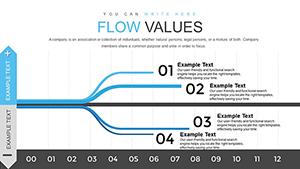
The slides are structured for comprehensive coverage. Introductory ones (1-7) feature matrix overviews, like 2x2 grids for segmenting market baskets by frequency and value. Slides 8-15 focus on pie charts, breaking down compositions - e.g., "Grocery Basket: 40% Produce, 30% Dairy" - ideal for affinity analysis.
Bar chart sections (16-23) compare categories, such as seasonal purchases, with stacked options for sub-groupings. Line charts in slides 24-30 track trends over time, like basket size fluctuations, supporting forecasting. Area charts (31-35) visualize cumulative impacts, and closing slides (36-38) offer dashboards integrating multiple views for holistic summaries.
Versatile Use Cases with Real Impact
Business pros craft sales dashboards revealing cross-sell opportunities, akin to how Amazon uses basket analysis for recommendations, boosting revenue. Entrepreneurs pitch investors with visuals on market trends, building credibility through data-backed plans. Educators demystify concepts in analytics courses, using charts to illustrate rules like Apriori algorithms for association mining.
Marketers showcase campaign performances, linking promotions to basket changes for ROI proof. The template's benefits include streamlined workflows, memorable messaging via visuals, and enhanced decision-making, all while establishing authority through professional designs that outshine generic tools.
Expert Strategies for Compelling Charts
- Data Integration: Import from Excel for live updates, ensuring accuracy in real-time analyses.
- Visual Storytelling: Sequence charts to build arguments, starting broad and narrowing to insights.
- Audience Adaptation: Simplify for executives with summaries; detail for analysts with raw metrics.
- Enhance Interactivity: Add hyperlinks to deeper data in Keynote for exploratory presentations.
- Refine Iteratively: Test with peers, adjusting based on clarity feedback for optimal impact.
These tips, informed by data visualization pioneers like Stephen Few, elevate your work from informative to influential.
Stand Out with Data-Driven Excellence
As big data reshapes industries - per Gartner reports on analytics growth - this template arms you with tools to harness it. It resolves issues like data overload by providing structured visuals that clarify patterns. Versatile across platforms, it's perfect for hybrid teams or multi-device use. Imagine sealing a deal with a chart that uncovers untapped markets, all from your polished deck. This template isn't mere slides; it's your pathway to smarter strategies. Act now - customize this powerhouse and transform your presentations.
Frequently Asked Questions
What chart types are included?
Pie, bar, line, and area charts, each tailored for market basket analysis and customizable.
Is it compatible with Keynote?
Yes, fully compatible with Keynote, Google Slides, and PowerPoint for broad usability.
Can I add my own data?
Absolutely - placeholders make it easy to insert and visualize your datasets.
Suitable for beginners?
Yes, the drag-and-drop interface is intuitive, no prior design experience needed.
Are updates free?
Yes, access new features and charts through ongoing template enhancements.
How to export charts?
Export as images, PDFs, or embed in reports seamlessly across platforms.
Good for
- Project roadmaps and sprint plans
- Product launch timelines
- Quarterly or annual review decks
- Company history and milestone summaries
Licence
reviews
Market Basket template's 38 slides with pie, bar, and area charts helped my retail analysis presentation. Affinity pies in nice color schemes revealed cross-sell opportunities clearly. Drag-drop easy for data.
Marketer using for campaign ROI: stacked bars for categories and trend lines over time. Custom fonts matched brand. Slightly critical of dashboard integration but insightful.
Data analyst: matrix grids for frequency/value segmentation professional. High-res for reports. Good for Apriori-like visuals without coding.
Deadline for investor pitch: area charts for cumulative impacts looked premium. Editable everything. Enthusiastic student-friendly too for analytics class.
The pie breakdowns for basket composition are spot-on. Practical placeholders. Professional style elevates presentations beyond defaults.
Mixed: comprehensive but some slides felt data-heavy for execs. Still, boosted credibility hugely with real metrics.
FAQ
Will it work in Google Slides?
Are fonts embedded?
Can I use this for client work?
What's the refund policy?
Do you update the template after purchase?
Similar templates
See all PowerPoint Charts →
All 38 slides