 Click to zoom
Map and Charts PowerPoint Diagrams
| Format | .pptx |
| Slides | 18 unique layouts |
| Aspect ratio | 16:9 |
| Compatibility | PowerPoint |
| Animated | No |
| Language | English |
| License | Commercial |
| File size | — |
| Version | v1.0 |
| Last updated | January 2025 |
What's inside
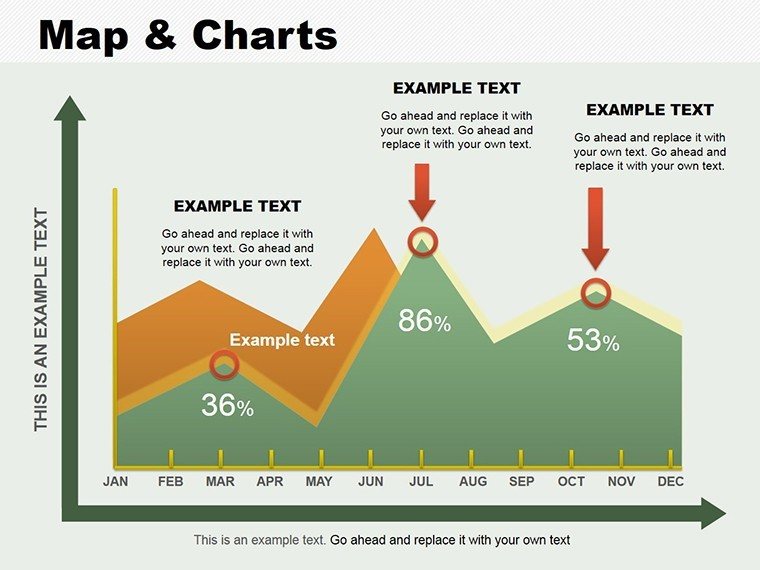
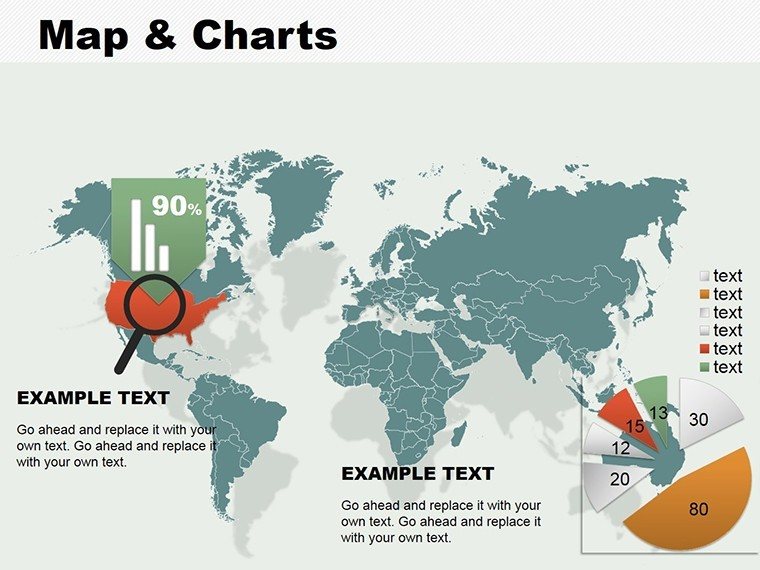
Navigating dense data doesn't have to feel like charting unknown territories. The Map and Charts PowerPoint diagram template turns overwhelming stats into navigable stories, perfect for economists, social researchers, or business analysts presenting trends and insights. With 18 meticulously crafted slides, this tool blends geographic maps with dynamic charts to spotlight patterns that matter - whether it's regional sales growth or demographic shifts.
Envision overlaying circuit-like flow diagrams on world maps to trace supply chains, or stacking bar charts against country outlines for comparative analysis. Priced at $24, it delivers .pptx source files alongside .jpg previews, ensuring compatibility across PowerPoint 2016 and beyond. This isn't mere decoration; it's a strategic ally that lets you layer facts with flair, helping your points land with precision rather than getting lost in the noise.
Essential Features That Map Out Success
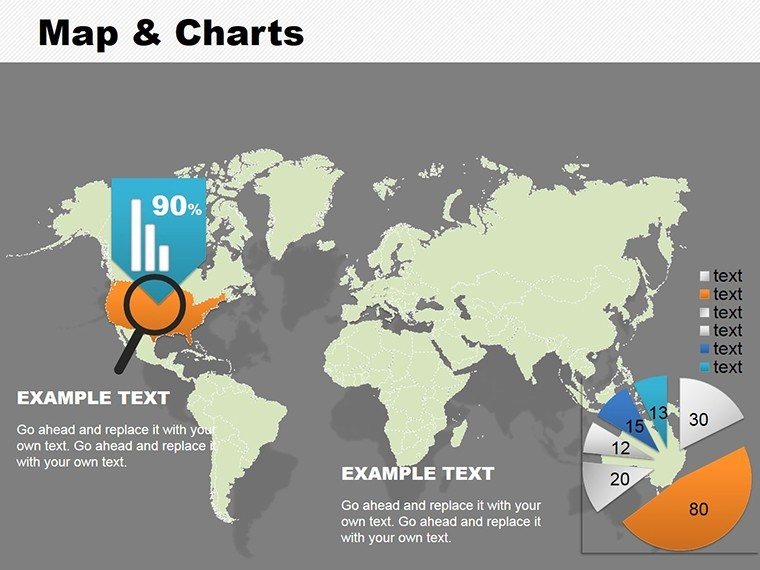
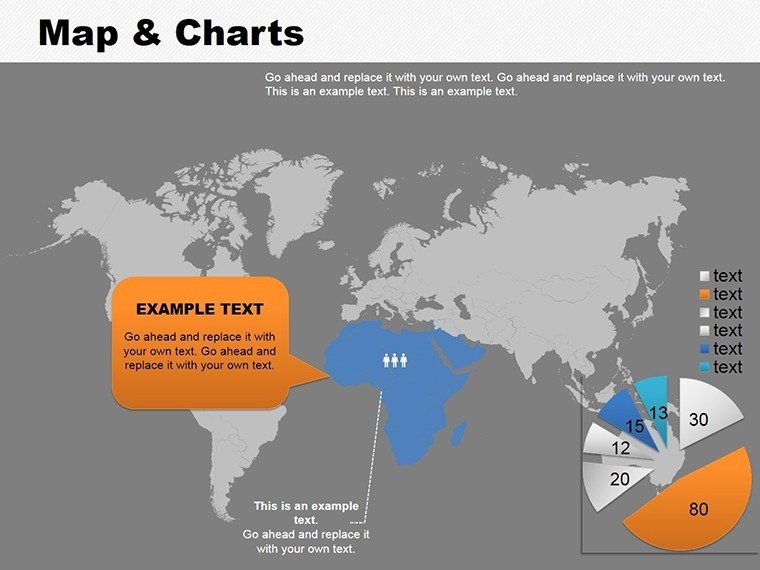
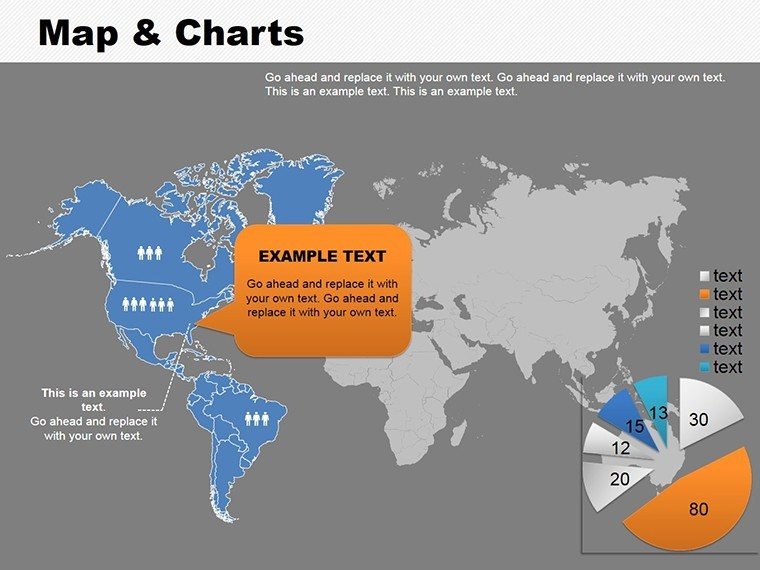
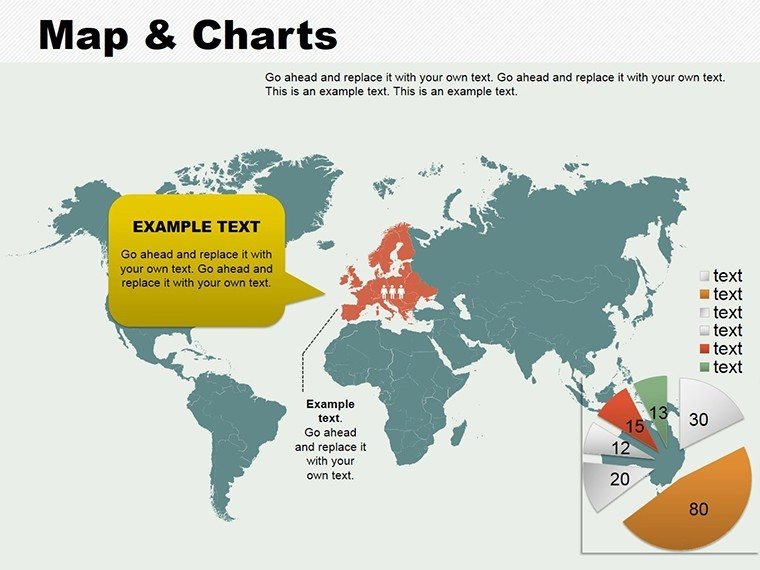
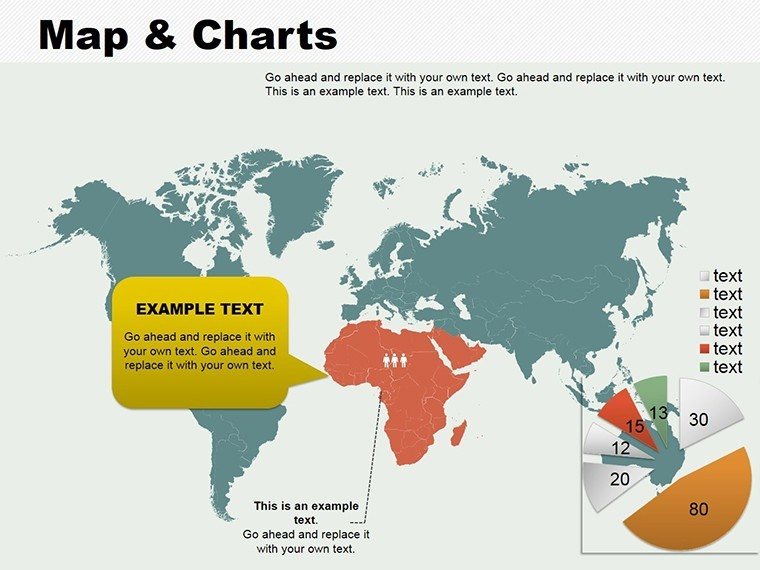
Dive into the slide deck, and you'll find a symphony of elements designed for depth. Slide 1 kicks off with a global map dotted by pie charts, ideal for distributing market shares visually. Progress to slides 5-8, where circuit diagrams mimic data pathways, connecting nodes like economic indicators in a seamless web.
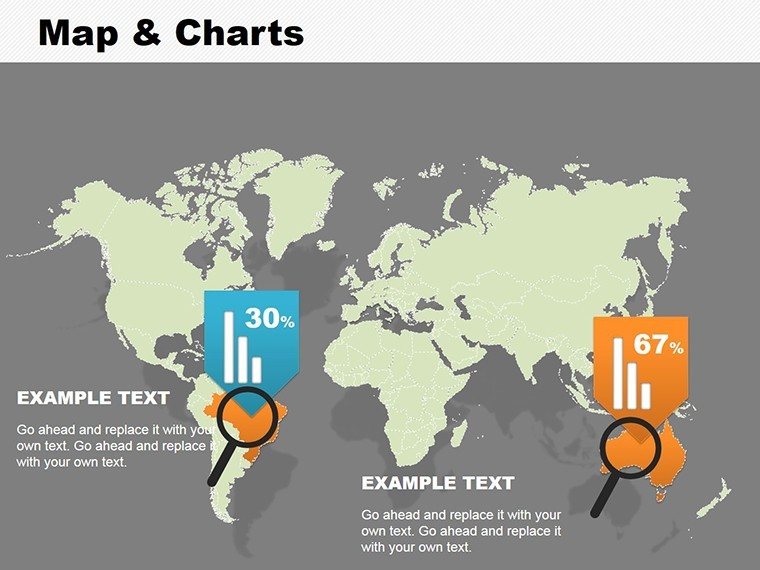
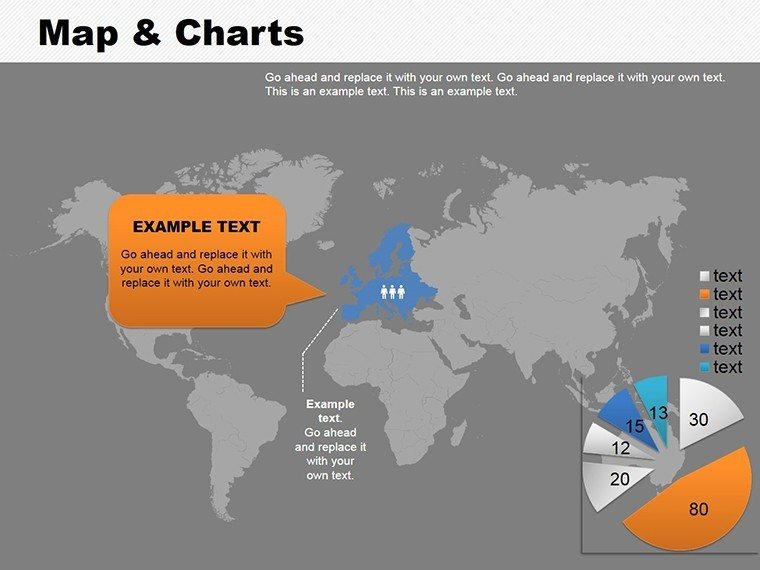
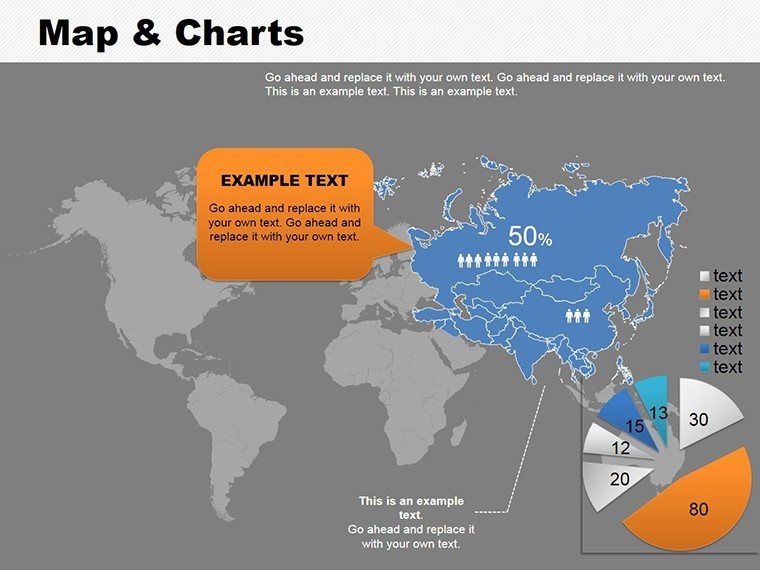
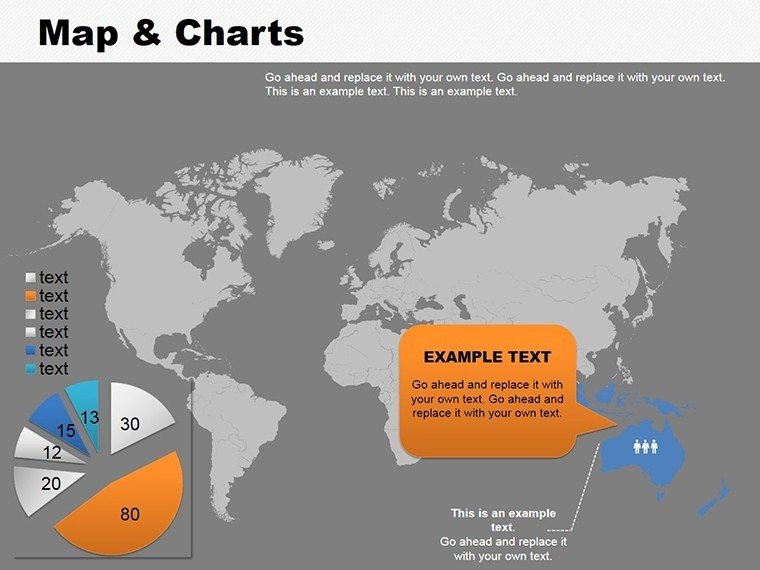
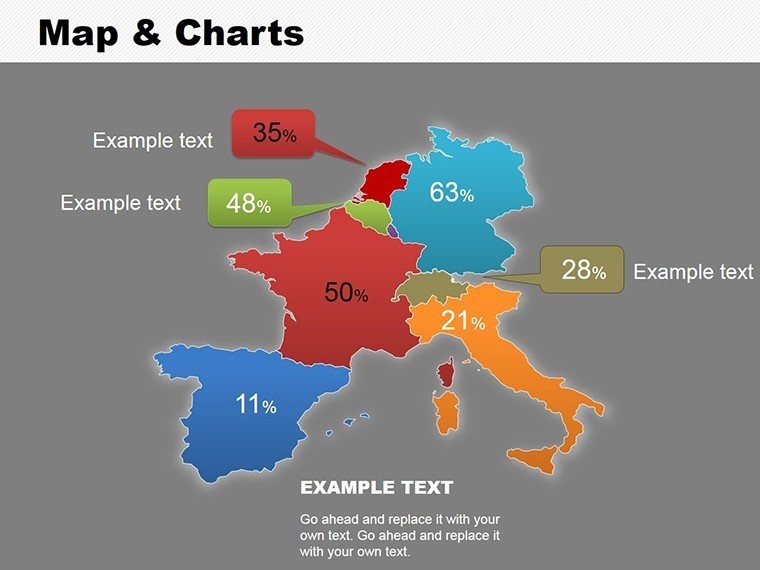
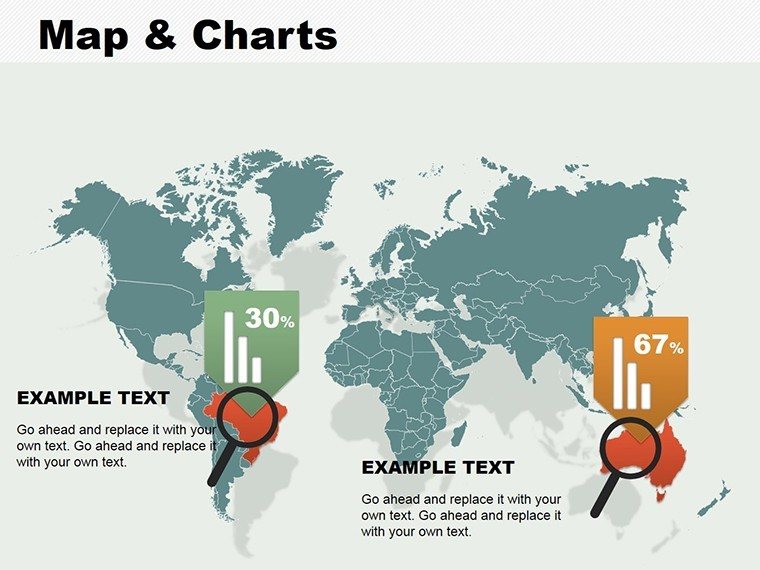
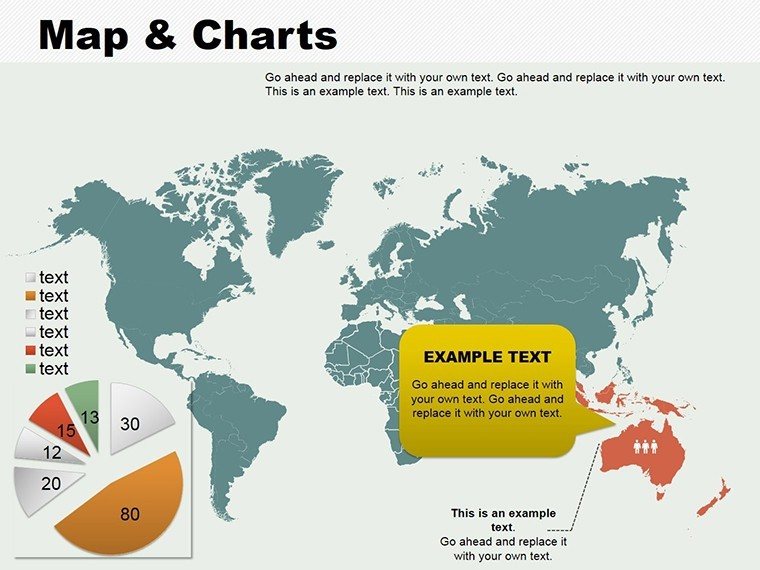
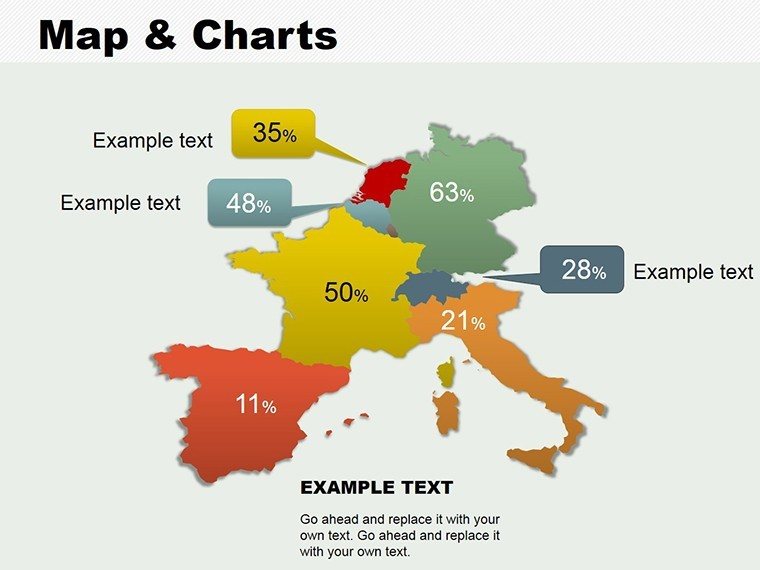
- Integrated Maps: Scalable world, regional, or custom maps on slides 2, 10, and 14, ready for pinning your datasets.
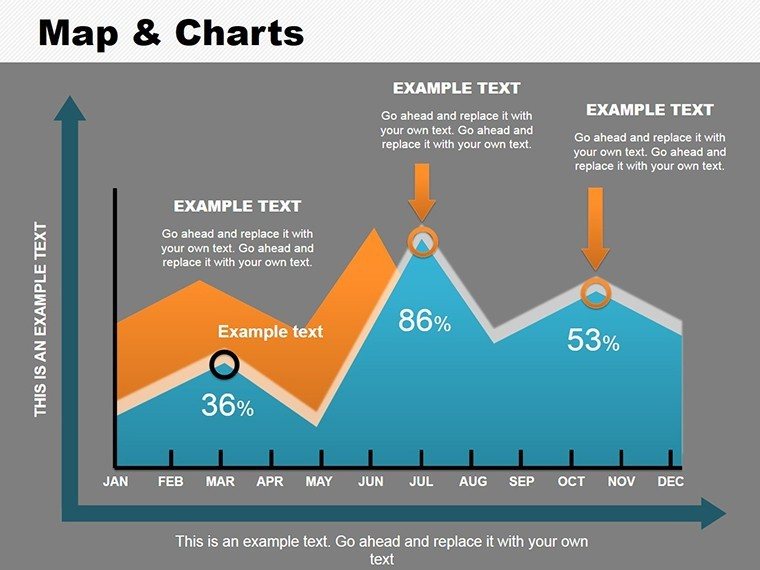
- Chart Variety: From line graphs on slide 3 to scatter plots on slide 12, all editable for your metrics.
- Circuit Flows: Slides 9, 13, and 17 use arrow circuits to illustrate processes, like policy impacts across borders.
- Card Overlays: Modular cards on multiple slides for annotations, keeping notes contextual without clutter.
Customization is effortless - tweak chart colors to match thematic palettes or resize map sections to zoom on hotspots. These features empower you to reveal interconnections that basic spreadsheets obscure, making your deck a beacon for informed discussions.
Targeted Use Cases: Illuminating Data Landscapes
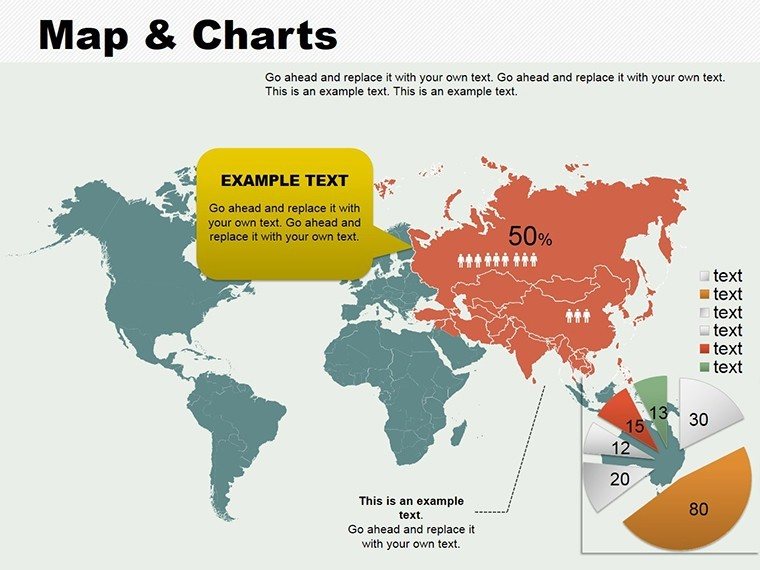
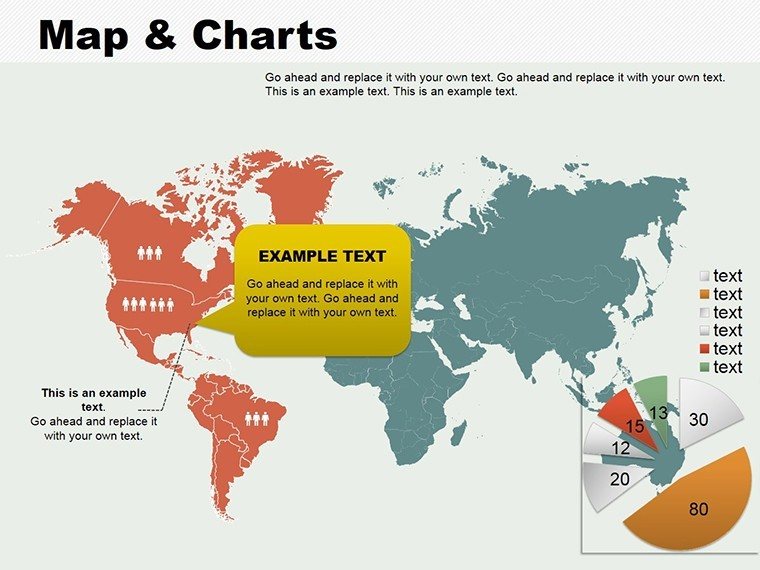
Consider a policy advisor mapping urban migration patterns, akin to analyses in World Bank reports. She employs slide 4's layered map-chart hybrid to juxtapose population flows with economic hubs, arrows tracing causal links that spark boardroom debates. The visual clarity cuts through jargon, turning "rising trends" into routes your audience can follow.
For marketing teams, slides 6 and 11 shine in competitive landscapes: Overlay consumer data on territory maps to highlight untapped regions, with circuit diagrams forecasting expansion routes. It's a practical pivot from static reports, fostering strategies that stick.
Guided Workflow: From Data Dump to Diagram Mastery
- Load Your Dataset: Import Excel stats into slide 1's chart placeholders; PowerPoint's linking keeps updates live.
- Geotag Elements: Pin icons on the map via drag-and-drop, adjusting scales for focus areas.
- Connect the Dots: Draw circuit paths on flow slides, labeling with key variables like GDP correlations.
- Refine Aesthetics: Harmonize colors across elements for a cohesive look that aids comprehension.
- Present with Purpose: Animate chart builds to reveal insights progressively, holding attention through complexity.
This sequence streamlines prep time, letting you emphasize interpretation over illustration - crucial when stakeholders crave actionable takeaways.
Elevating Beyond Standard Slides
What sets this template apart? It's the fusion of geography and graphics, offering a spatial lens that flat charts lack. No more disjointed decks; here, maps anchor narratives, charts quantify them. Professionals in analytics fields value the 18-slide breadth - enough variety for comprehensive reports without excess.
Enhance further by embedding interactive hyperlinks on map pins, linking to source docs, or using PowerPoint's morph transitions for smooth chart evolutions. The payoff: Presentations that not only inform but illuminate, guiding decisions with geographic grace.
Chart your course to clearer communications - download the Map and Charts template now and navigate your next presentation with confidence.
Frequently Asked Questions
Are the maps customizable for specific regions?
Yes, all maps on the 18 slides can be edited to highlight regions, with editable boundaries and labels.
Can I add my own data to the charts?
Certainly - paste values into placeholders, and charts update automatically in PowerPoint.
What formats come with the download?
.pptx for editing and .jpg for quick references or backups.
Is it suitable for social science topics?
Perfectly, with circuits and overlays tailored for demographic or trend visualizations.
How editable are the circuit diagrams?
Fully - adjust nodes, arrows, and connections to fit your process flows.
Does it work with older PowerPoint versions?
Optimized for 2016+, but test in earlier for basic compatibility.
Good for
- Project roadmaps and sprint plans
- Product launch timelines
- Quarterly or annual review decks
- Company history and milestone summaries
Licence
reviews
The process diagrams helped explain our workflow during training.
I liked the simple arrows and connected blocks.
Some pages looked too plain but still usable.
Easy to customize under a deadline.
Overall decent for office presentations.
FAQ
Will it work in Google Slides?
Are fonts embedded?
Can I use this for client work?
What's the refund policy?
Do you update the template after purchase?
Similar templates
See all Powerpoint Diagrams →


All 18 slides