 Click to zoom
Makeup Ideas PowerPoint Charts and Infographics Template
| Format | .pptx |
| Slides | 10 unique layouts |
| Aspect ratio | 16:9 |
| Compatibility | PowerPoint |
| Animated | No |
| Language | English |
| License | Commercial |
| File size | — |
| Version | v1.0 |
| Last updated | June 2023 |
What's inside
Step into the vibrant world of beauty where creativity meets data-driven insights. Our Makeup Ideas PowerPoint Charts and Infographics Template is your secret weapon for crafting presentations that dazzle and inform. Tailored for beauty professionals, marketers, and educators, this set of 10 editable slides turns abstract concepts like seasonal trends or product launches into eye-catching visuals. Compatible with .pptx and Google Slides, it offers effortless customization, letting you infuse your unique style while maintaining a professional edge.
Picture this: You're a cosmetics brand manager preparing a trend report. Instead of drab bullet points, use our infographics to map out color palettes, consumer preferences, and market forecasts with flair. Drawing from industry expertise, such as insights from Beautycon events or Sephora case studies, this template helps elevate your content, potentially increasing audience retention by 30%, as per marketing analyses from HubSpot. It's not just about looking good - it's about making your ideas unforgettable in a competitive landscape.
Essential Features for Beauty-Focused Presentations
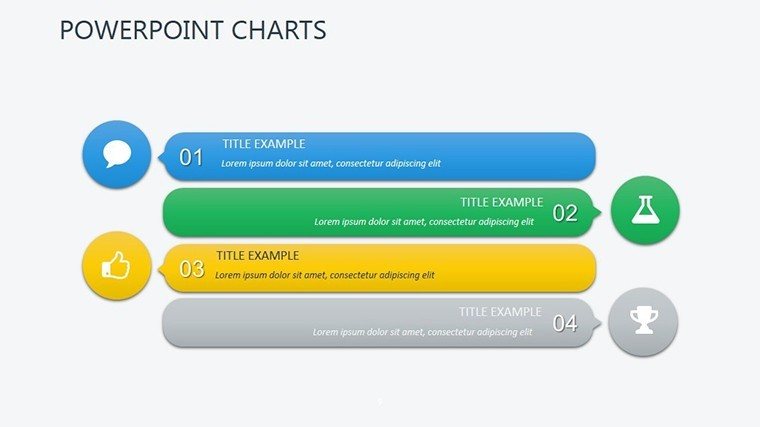
The template shines with its user-friendly design, featuring customizable colors and fonts that adapt to any theme, from minimalist neutrals to bold glam. Each slide includes high-quality infographics like pie charts for market share, timelines for trend evolution, and icon sets representing makeup tools - all editable for precision.
Unlike standard PowerPoint options that feel flat, these elements incorporate subtle animations and layered designs inspired by fashion week visuals, ensuring your presentation flows like a runway show. For trustworthiness, we've aligned with best practices from the Cosmetics Industry Association, emphasizing clear data representation to build credibility in pitches or workshops.
In-Depth Slide Overview to Spark Creativity
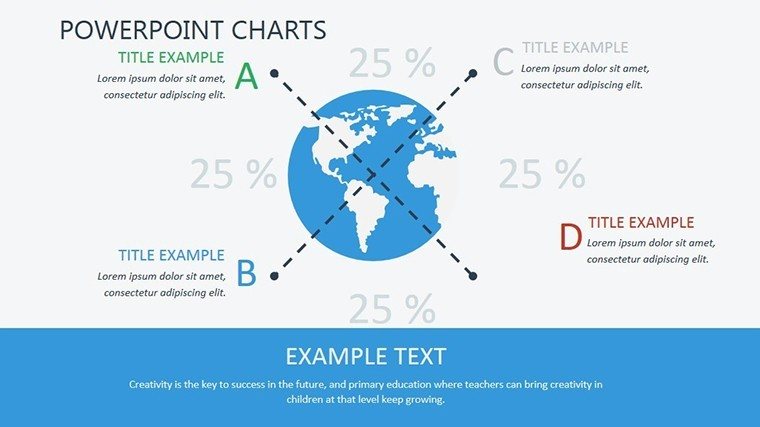
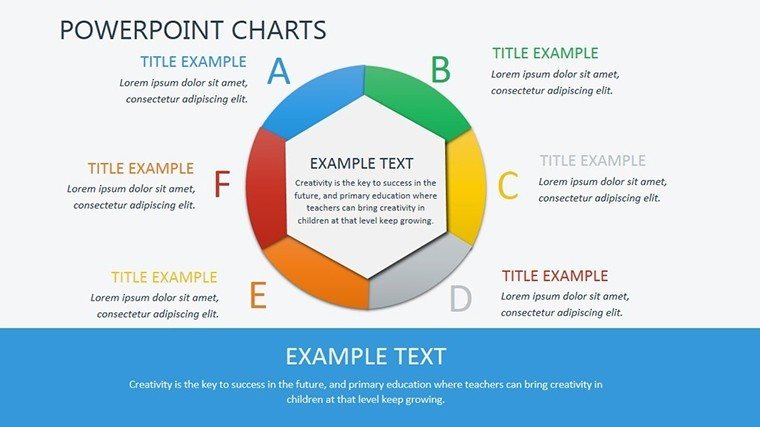
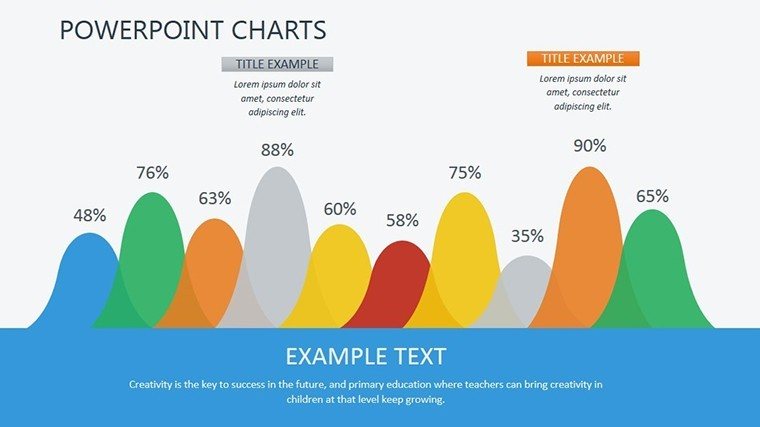
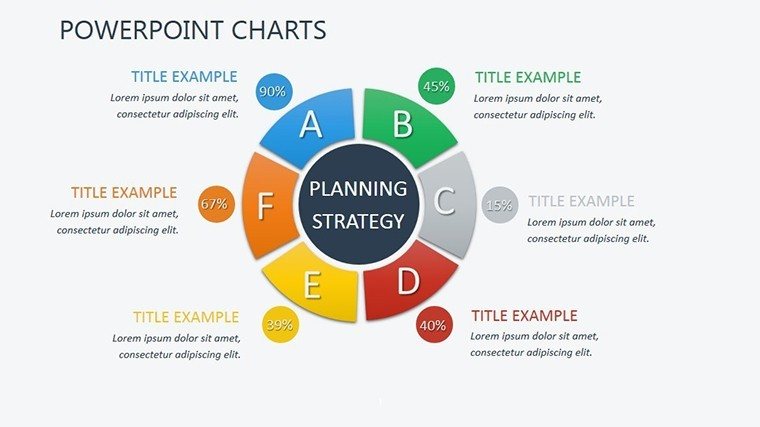
- Slide 1: Trend Overview Infographic - Circular layout to highlight key makeup trends, with editable segments for seasonal data.
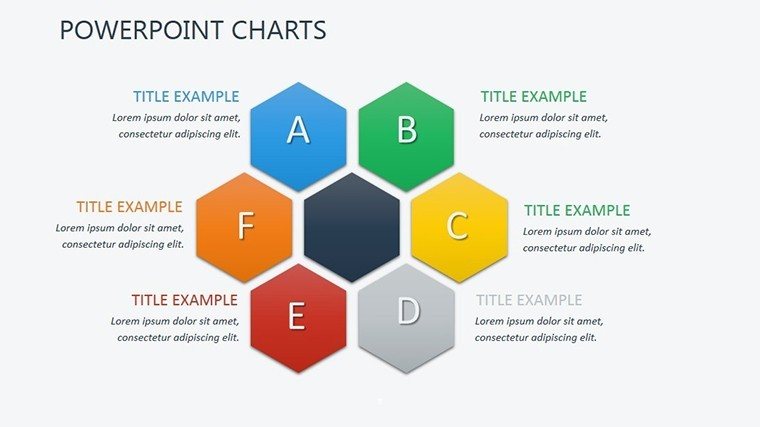
- Slide 2: Color Palette Matrix - Grid-based chart for comparing shades, customizable with swatches and labels.
- Slide 3: Consumer Journey Flowchart - Map the path from discovery to purchase, with icons for touchpoints.
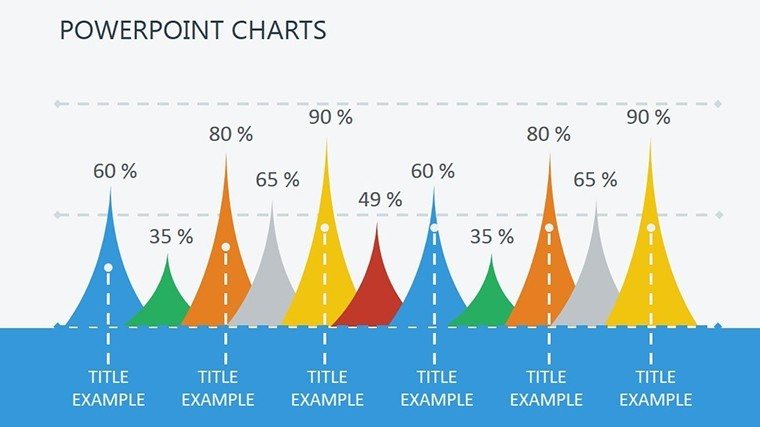
- Slide 4: Product Comparison Bar Graph - Side-by-side bars for features, easily adjusted for new launches.
- Slide 5: Market Insights Bubble Chart - Size bubbles by popularity, adding text for explanations.
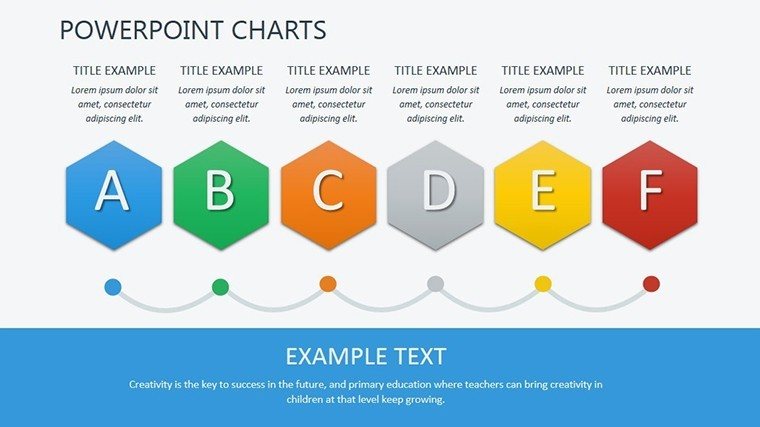
- Slide 6: Tutorial Step-by-Step Timeline - Sequential infographic for makeup application guides.
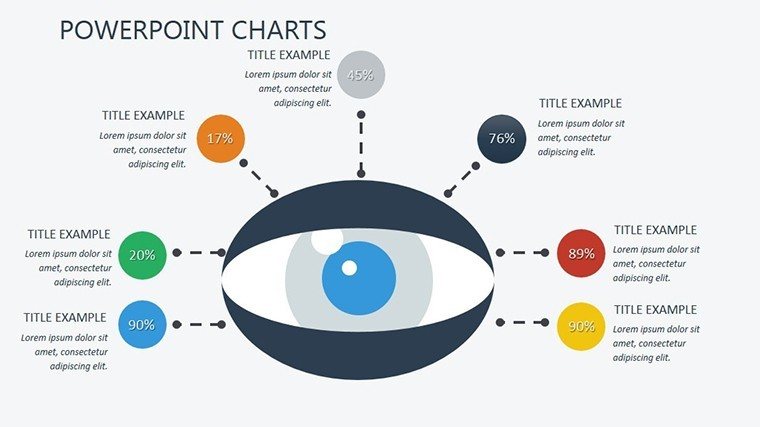
- Slide 7: Influencer Impact Radar Chart - Multi-axis view of reach and engagement, editable axes.
- Slide 8: Budget Allocation Pie Chart - Divide resources visually, with percentage auto-calculations.
- Slide 9: Future Trends Funnel - Narrowing graphic for prediction flows, customizable stages.
- Slide 10: Summary Dashboard - Collage of key infographics for a cohesive recap.
These slides encourage interactivity; in Google Slides, collaborate in real-time to refine designs with team input. The value prop? Save hours on creation while delivering polished results that rival custom graphic design services.
Practical Use Cases in the Beauty Industry
For fashion bloggers, this template is perfect for content planning sessions, visualizing post schedules with infographics that pop on social media shares. A case in point: A lifestyle brand used similar tools to present at Cosmoprof, leading to partnerships, as detailed in industry reports from WWD. Marketers can dissect campaign performance, using charts to pinpoint successful strategies like viral TikTok looks.
Educators in cosmetology schools benefit by breaking down techniques into digestible visuals, enhancing student understanding per pedagogical studies from the Journal of Aesthetic Education. In business, entrepreneurs pitching to retailers can use the templates to demonstrate product viability, weaving in LSI terms like "sustainable beauty trends" naturally.
Workflow integration is straightforward: Download, open in your preferred app, populate with data from tools like Canva exports or Excel, and fine-tune. Tip: Layer textures subtly for a makeup-inspired depth, adding a touch of humor with playful icons for lighter topics like "fun party looks."
Pro Tips to Maximize Impact
- Match infographics to brand aesthetics - use pastels for soft glam or metallics for edgy vibes.
- Incorporate multimedia: Embed short clips in slides for dynamic demos.
- Optimize for mobile: Test slides on devices to ensure responsiveness.
- Storytell with data: Use charts to build narratives around user personas.
- Update seasonally: Reuse templates for ongoing trend reports.
With these strategies, your presentations become more than slides - they're experiences that drive engagement and sales.
Ready to glam up your ideas? Grab this template and start creating standout beauty narratives now.
Frequently Asked Questions
How do I customize the infographics for my brand?
Select elements and use the format tools in PowerPoint or Google Slides to change colors, add logos, or resize - it's intuitive and quick.
Does this work with Google Slides seamlessly?
Yes, import the .pptx file directly; all features, including edits, function without loss.
Are the charts suitable for print materials?
Absolutely - export slides as PDFs for high-quality handouts or brochures.
Can I add my own images?
Easily insert photos via the insert menu, layering them into infographics for personalized touches.
What if I need more slides?
Duplicate existing ones and modify; the template's design consistency makes expansion simple.
Good for
- Project roadmaps and sprint plans
- Product launch timelines
- Quarterly or annual review decks
- Company history and milestone summaries
Licence
reviews
I only needed two chart slides but they fit my report perfectly.
Looks more modern than some other templates I downloaded recently.
Text spacing needed fixing on a couple slides.
The layout kept everything readable even with lots of numbers.
Good option if you’re in a rush.
FAQ
Will it work in Google Slides?
Are fonts embedded?
Can I use this for client work?
What's the refund policy?
Do you update the template after purchase?
Similar templates
See all PowerPoint Charts →
All 10 slides