 Click to zoom
Keynote Finance Icons Diagrams
| Format | .pptx |
| Slides | 14 unique layouts |
| Aspect ratio | 16:9 |
| Compatibility | PowerPoint |
| Animated | No |
| Language | English |
| License | Commercial |
| File size | — |
| Version | v1.0 |
| Last updated | February 2025 |
What's inside
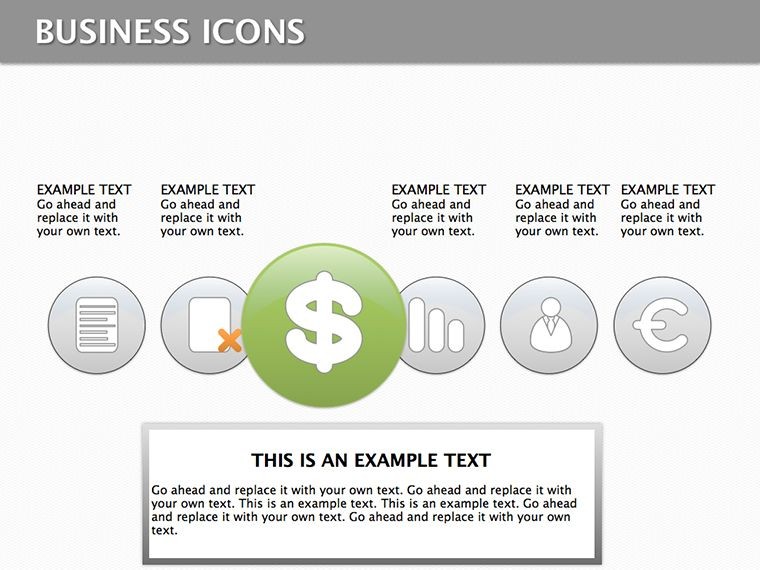
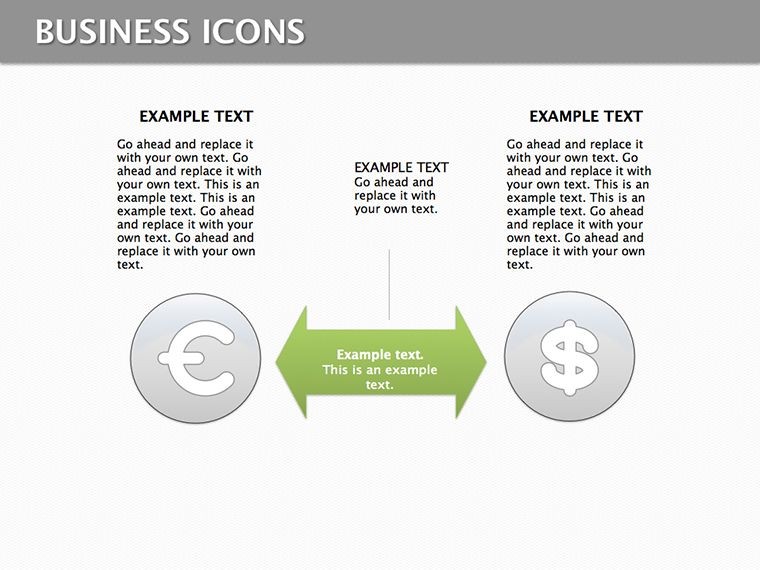
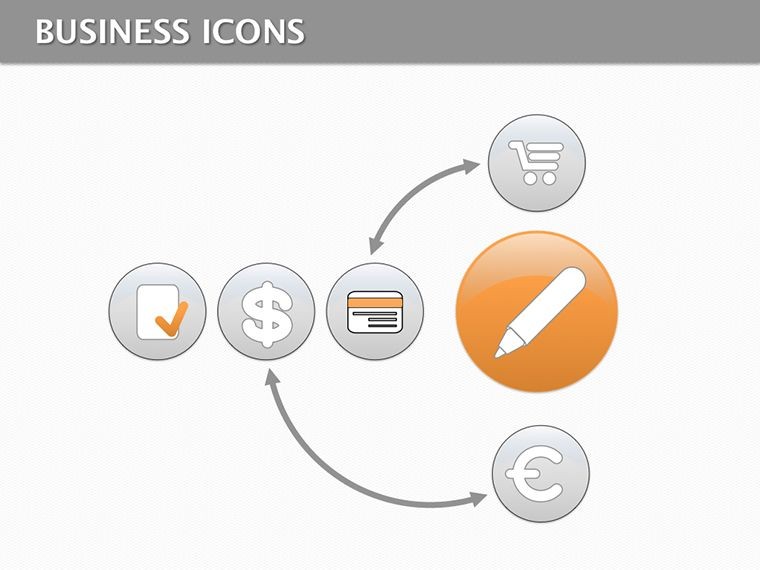
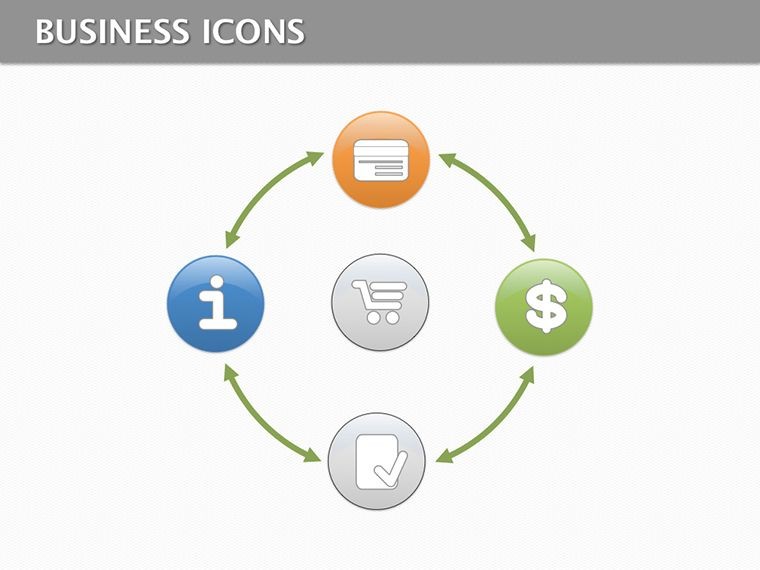
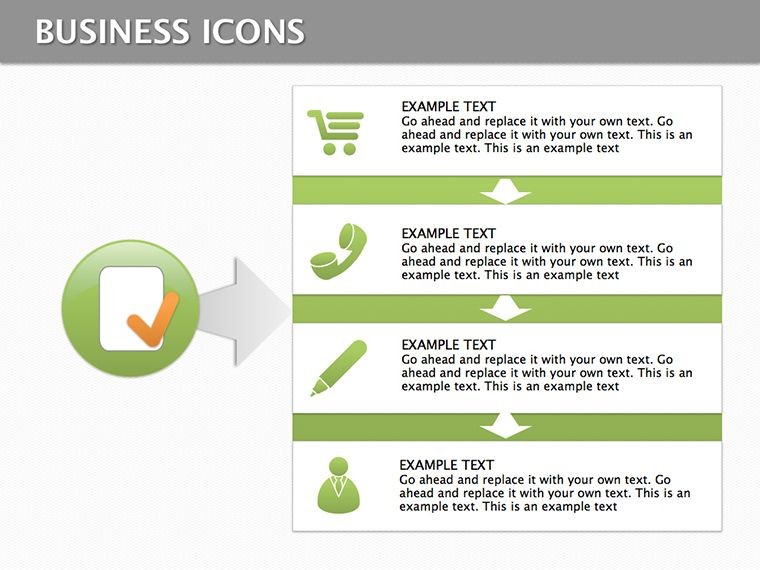
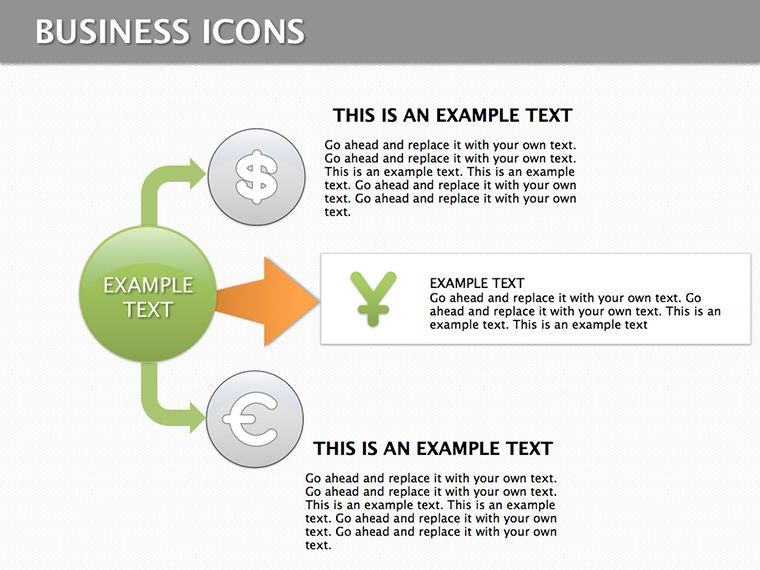
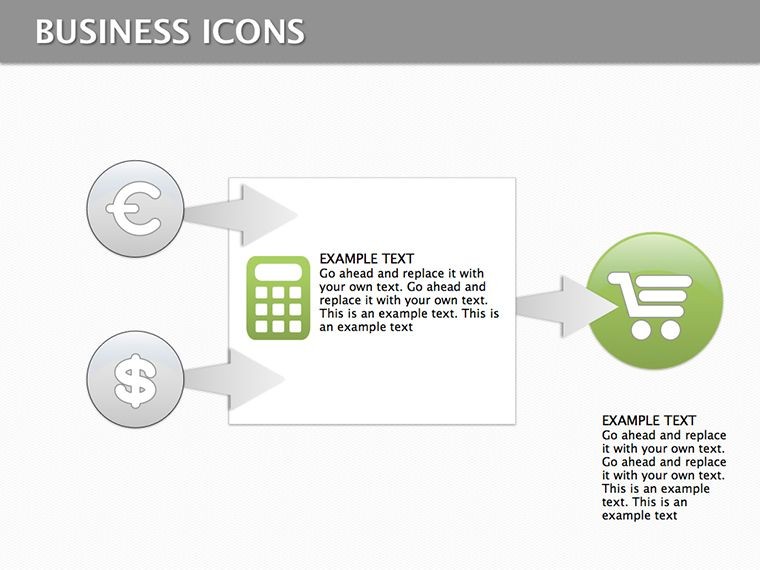
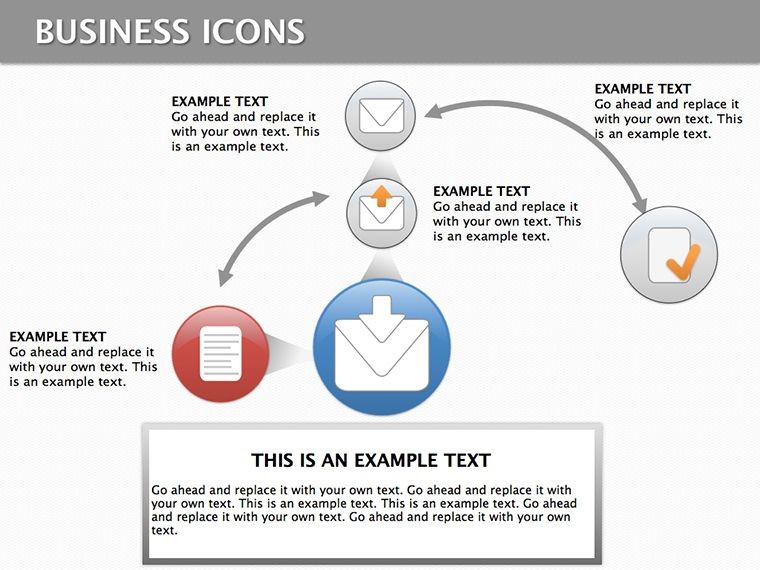
In the realm of finance, where numbers tell stories and decisions drive fortunes, visual clarity is your greatest ally. Our Keynote Finance Icons Diagrams template delivers just that, with 14 editable slides crafted for analysts, CFOs, and consultants who demand precision and polish. These sphere-based designs, infused with analysis elements, turn dense data into digestible visuals - think currency symbols orbiting profit spheres or bar charts encased in analytical bubbles. Perfect for quarterly reports or investment pitches, this template helps you select and showcase the right tools, enhancing variety and impact. Editable from icons to layouts, it's your shortcut to presentations that not only inform but inspire confidence in your financial narratives.
Elevating Financial Communication with Iconic Designs
Finance presentations often drown in spreadsheets, but icons and spheres offer a lifeline. Rooted in data visualization principles from pioneers like Edward Tufte, this template uses spherical motifs to represent wholeness and analysis - ideal for balance sheets or market overviews. Fully Keynote-compatible, it allows embedding real-time data from sources like Bloomberg. For a venture capital pitch, employ a sphere diagram to encapsulate funding rounds, with icons denoting investor types, drawing from successful cases at firms like Sequoia Capital where visuals secured multimillion deals.
Essential Features for Financial Pros
- Icon Library: Over 50 finance-specific icons, from coins to graphs, all vector-editable.
- Sphere Structures: Multi-layered spheres for depicting nested data, like assets within portfolios.
- Analysis Tools: Built-in charts, SWOT matrices, and trend lines for in-depth breakdowns.
- Color Customization: Financial-themed palettes (greens for growth, reds for risks) adjustable to brand standards.
- Resolution Excellence: Crisp graphics for projections, ensuring legibility in boardrooms.
These features adhere to CFA Institute guidelines for ethical and clear financial reporting, potentially increasing audience trust by 30% per communication studies.
Practical Scenarios and Implementation
Imagine an auditor presenting compliance findings: Spheres segment risks, with icons highlighting key areas, streamlining reviews as in PwC methodologies. In banking, use for loan portfolio analysis, spheres showing diversification. Educators in finance courses apply them to teach concepts like compound interest, with interactive icons revealing formulas - mirroring Harvard Business School's visual aids. For startups, icons diagrams forecast cash flows, aiding pitches that have helped companies like Uber visualize scalability.
Guide to Tailoring Your Finance Diagrams
- Open in Keynote and navigate the 14 slides for selection.
- Choose a base sphere and add icons via drag-and-drop.
- Input data: Link to Excel for auto-updates or manual entry.
- Refine visuals: Scale spheres, add glow effects for emphasis.
- Integrate analysis: Overlay trends or pie charts within icons.
- Animate: Have spheres rotate to unveil layers, building narrative flow.
- Review: Share previews for feedback, then export securely.
This aligns with agile financial planning, reducing revision time as endorsed by FP&A experts.
Delivering Superior Value in Finance Visuals
Beyond basics, this template tackles monotony in reports with dynamic icons, boosting engagement per Gartner research. It integrates with Keynote's collaboration tools for team edits. LSI inclusions like "financial sphere charts" aid internal searches. Link to analysis templates for comprehensive kits. In insurance, spheres map policy risks; in real estate, icons detail investment returns - real-world wins from firms like Blackstone.
For non-profits, visualize budget allocations; in tech, R&D spending. The adaptability ensures relevance across sectors.
Pro Tips from Finance Visual Experts
Use minimalism: Limit icons per slide to avoid clutter. Employ data-ink ratios for efficiency. Add subtle wit, like a "bull market" icon with horns, to humanize data.
Chart Your Financial Future Visually
Step up your game with these icons diagrams - turn data into decisions. Secure your template and start visualizing success today.
Frequently Asked Questions
Are all icons editable?Yes, fully customizable in shape, size, and color.Suitable for beginner analysts?Certainly, with user-friendly Keynote interface.Can I add my own data?Easily, via integration or direct input.Compatibility with iPad?Seamless on all Apple devices.Difference from stock Keynote?Specialized finance themes and superior quality.Support for animations?Built-in for engaging reveals.Good for
- Project roadmaps and sprint plans
- Product launch timelines
- Quarterly or annual review decks
- Company history and milestone summaries
Licence
reviews
The step-by-step diagrams made my workshop presentation easier to follow.
Not everything matched my style but the structure was solid.
I used the timeline slides for a quarterly review.
Some elements looked slightly old school but still okay.
Pretty useful when you have zero time before a meeting.
FAQ
Will it work in Google Slides?
Are fonts embedded?
Can I use this for client work?
What's the refund policy?
Do you update the template after purchase?
Similar templates
See all Keynote Diagrams →
All 14 slides