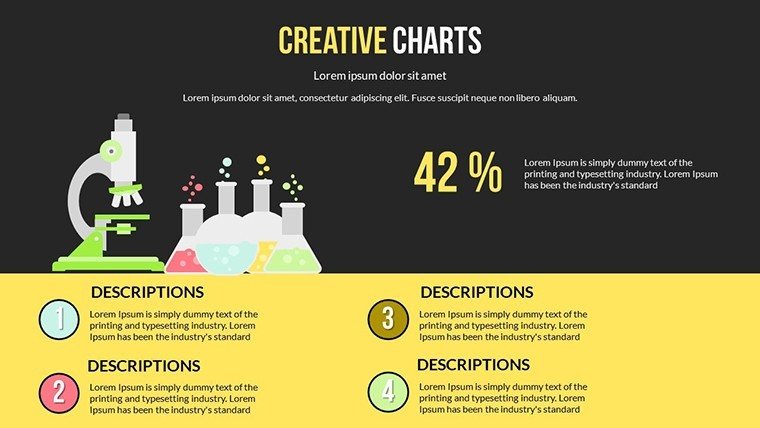
 Click to zoom
Interactive Infographic PPT Chart Template - 13 Slides
| Format | .pptx |
| Slides | 13 unique layouts |
| Aspect ratio | 16:9 |
| Compatibility | PowerPoint |
| Animated | No |
| Language | English |
| License | Commercial |
| File size | — |
| Version | v1.0 |
| Last updated | June 2024 |
What's inside
Picture this: You're in a high-stakes meeting, and instead of droning through static slides, your audience is actively engaging with your data, clicking through interactive elements that reveal insights on demand. That's the magic of our Interactive Infographic PowerPoint Chart Template. Crafted for those who demand more from their presentations, this 13-slide powerhouse turns complex information into digestible, visually stunning narratives. Whether you're a corporate strategist outlining relationship dynamics in business partnerships or an educator simplifying relational concepts, this template bridges the gap between data and decision-making. With its focus on infographics and interactivity, it solves the common frustration of passive audiences by fostering immersion. From timeline charts that map project evolutions to comparative graphs highlighting stakeholder relationships, each slide is designed to spark conversation and drive action. Professionals across industries praise its ability to make abstract ideas tangible, like visualizing network connections in a supply chain pitch, ultimately leading to better comprehension and faster buy-in.
Delve into Interactive Features for Enhanced Engagement
This template stands out by prioritizing user interaction, a key differentiator in modern presentations. Slides incorporate clickable hotspots that expand data views, ideal for exploring relationship matrices in depth. For marketing teams, this means presenting customer journey maps where audiences can drill down into touchpoints, revealing hidden patterns that inform strategy refinements.
Standout Elements of the Template
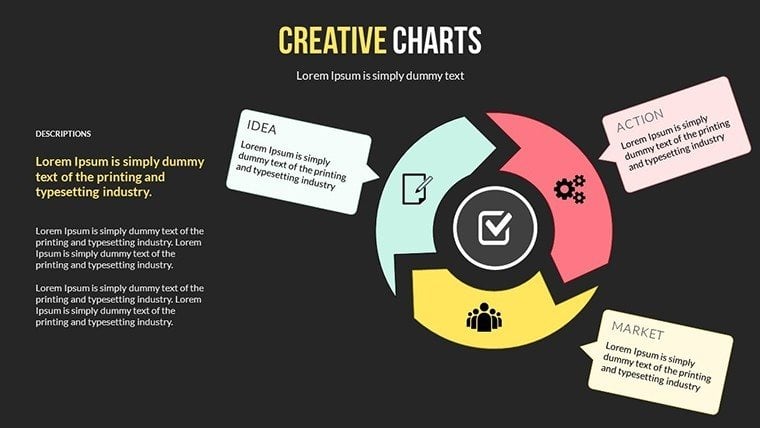
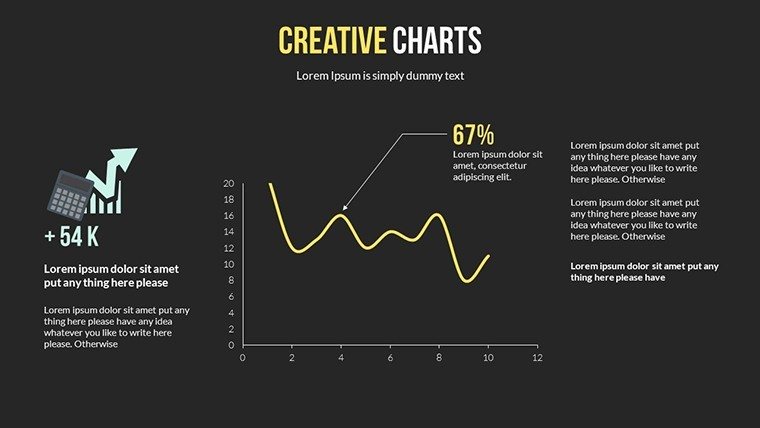
- Infographic Variety: A rich selection of elements like flowcharts and radial diagrams, all tailored for relationship-themed content.
- Real-Time Interactivity: Adjust data on-the-fly during presentations, perfect for live Q&A sessions.
- Customization Flexibility: Modify layouts, colors, and fonts to fit your brand, with intuitive controls that require no design expertise.
- Versatile Layouts: From process flows to comparison charts, covering scenarios like partnership analyses or team hierarchies.
- Step-by-Step Guidance: Built-in tutorials ensure even novices can create pro-level slides quickly.
These components come together to create presentations that feel alive, as evidenced by a consulting firm that used the template to map client relationships, resulting in a 30% uptick in engagement during reviews.
Practical Use Cases Tailored to Your Needs
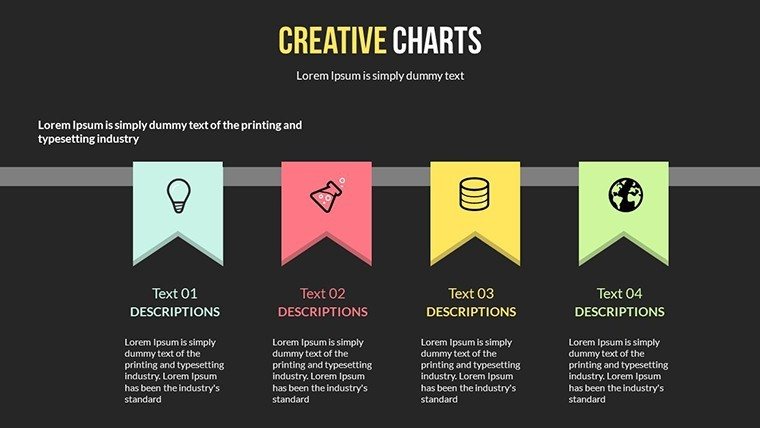
Apply this template in diverse settings for maximum value. In project management, utilize interactive timelines to track milestones and dependencies, allowing teams to interact with elements for real-time updates. Educators might employ radial charts to illustrate ecological relationships, making lessons interactive and memorable for students.
For sales professionals, craft pitches around customer relationship funnels, with clickable stages that reveal metrics like conversion rates. A real example: A tech startup leveraged the template for investor decks, using interactive graphs to demonstrate user acquisition networks, securing funding by clearly showing growth potential.
Customizing for Success: A Guided Approach
- Import your data into the placeholders - supports Excel integration for accuracy.
- Activate interactivity by linking elements to hidden slides or external data.
- Refine visuals with the customizable palette, ensuring alignment with your theme.
- Test interactions in presentation mode to guarantee smooth delivery.
- Export as PPTX for sharing, preserving all dynamic features.
This process outshines basic tools by embedding interactivity natively, reducing the need for third-party plugins and streamlining your workflow.
Superior to Generic Alternatives
While standard PowerPoint offers basic charts, this template elevates them with infographic flair and relationship-focused designs. Icons themed around connections - like handshake symbols or network nodes - add contextual depth, unlike plain defaults. Industry reports from Gartner highlight how interactive visuals can increase retention by 50%, underscoring the template's edge.
Incorporate it into daily operations for relational analyses, such as HR org charts or supply chain mappings, fostering a culture of data-driven dialogue.
Pro Tips from Presentation Experts
- Limit interactions per slide to three to prevent overload, focusing on key relationships.
- Use color coding for relational strengths, drawing from psychology principles for intuitive understanding.
- Ensure mobile compatibility for on-the-go edits, broadening accessibility.
- Analyze post-presentation feedback to iterate on interactive elements.
Grounded in best practices from design authorities like Edward Tufte, these tips ensure your presentations are both beautiful and effective.
Don't settle for static - embrace interactivity with this template and redefine your relational storytelling today.
Frequently Asked Questions
What makes the charts interactive?
Charts feature clickable elements that reveal additional data or navigate to related slides, enhancing audience participation.
Can I customize the infographics fully?
Yes, all elements are editable, from shapes to colors, allowing complete personalization.
Is it suitable for beginners?
Absolutely, with user-friendly interfaces and included guides, no prior design skills are needed.
Does it work on older PowerPoint versions?
It supports PowerPoint 2016 and later, with full interactivity preserved.
How do I handle large datasets?
Integrate Excel links for dynamic updates, managing extensive data without performance issues.
Are updates available?
Yes, purchasers receive free updates for new features and bug fixes.
Good for
- Project roadmaps and sprint plans
- Product launch timelines
- Quarterly or annual review decks
- Company history and milestone summaries
Licence
reviews
The graph slides helped clean up my messy presentation.
I liked the simple text sections and chart balance.
One slide had too many shapes for no reason.
Worked okay for internal company reports.
I mostly used the percentage charts.
FAQ
Will it work in Google Slides?
Are fonts embedded?
Can I use this for client work?
What's the refund policy?
Do you update the template after purchase?
Similar templates
See all PowerPoint Charts →

All 13 slides