 Click to zoom
Integration Keynote Charts: Weave Data Threads into Cohesive Narratives
| Format | .pptx |
| Slides | 16 unique layouts |
| Aspect ratio | 16:9 |
| Compatibility | PowerPoint |
| Animated | No |
| Language | English |
| License | Commercial |
| File size | — |
| Version | v1.0 |
| Last updated | August 2017 |
What's inside
In the labyrinth of modern business, integration isn't optional - it's the glue holding strategies together. Our Integration Keynote Charts template, with its 16 editable slides, serves as your master weaver, blending financials, processes, and timelines into tapestries that tell a unified tale. Aimed at analysts, project managers, and C-suite visionaries, it deciphers silos, spotlighting synergies that drive decisions. No more disjointed decks; just fluid flows that mirror your operations' rhythm.
Inspired by lean methodologies from Toyota's production lines, these charts animate connections - arrows linking KPIs to outcomes, columns stacking budgets against benchmarks. Versatile across formats (16:9 widescreen, 4:3 standard, 16:10), it's Keynote-native, ensuring buttery-smooth edits on any Apple device. Whether auditing cross-departmental workflows or forecasting merger impacts, this tool turns integration puzzles into polished presentations. Thread the needle - your integrated future starts here.
Core Features: Connectors for Crystal-Clear Insights
Packed with 16 slides ready for your data infusion, this template prioritizes interconnectivity. Vector precision means no pixelation during zooms, and modular builds let you assemble custom views on the fly.
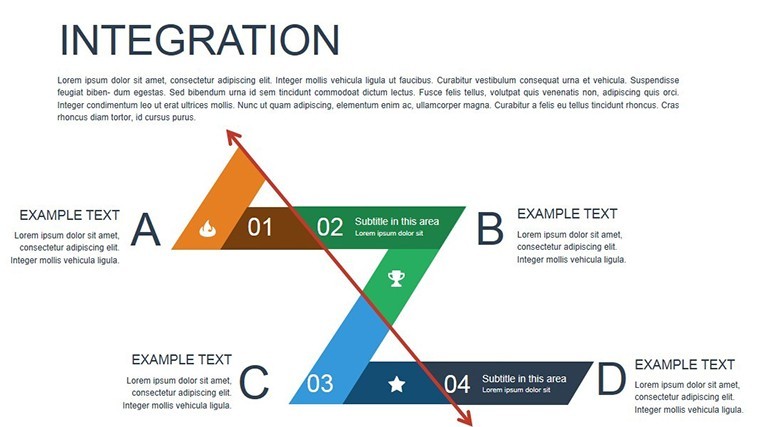
- Process Flow Arrows: Dynamic lines that branch and merge, animating step dependencies - trace procurement from PO to delivery in one sweep.
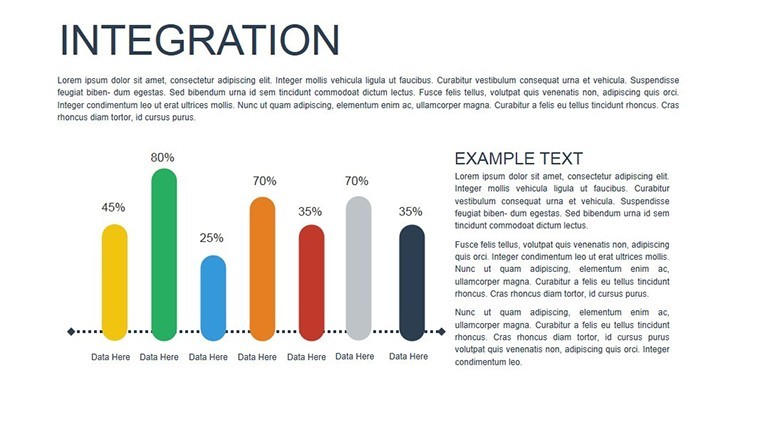
- Financial Column Integrations: Stacked bars fusing revenue streams with expense overlays, color-coded for variance spotting per GAAP visuals.
- Timeline Synapses: Gantt hybrids linking milestones to resources, with drag connectors for real-time reshuffles.
- Multi-Project Hubs: Radial charts integrating traffic patterns across initiatives, pulling from API-like embeds for live feeds.
These aren't isolated gadgets; they're ecosystem enablers, echoing systems thinking from Donella Meadows' work. A PwC report highlights how integrated visuals cut miscommunication by 35% - this template delivers that edge affordably.
Edit Like a Pro: Quick-Start Integration
Layer data via Keynote's shapes tool, auto-align connectors, and trigger builds with triggers. For traffic sims, import GeoJSON for mapped integrations - seamless as a well-oiled machine.
Targeted Applications: Integration in Everyday Wins
Consider a fintech merger: Slide 9's arrow matrix integrates legacy systems, animating data migration risks to greenlight approvals. Or, in ops, use period charts to sync seasonal traffic with inventory pulses, averting stockouts.
- Organizational Mergers: Overlay org trees with role mappings, easing cultural integrations via phased animations.
- Financial Audits: Column fusions of P&L statements with cash flow webs, revealing liquidity threads.
- Project Traffic Control: Timeline arrows juggling resources across lanes, flagging bottlenecks like a digital air controller.
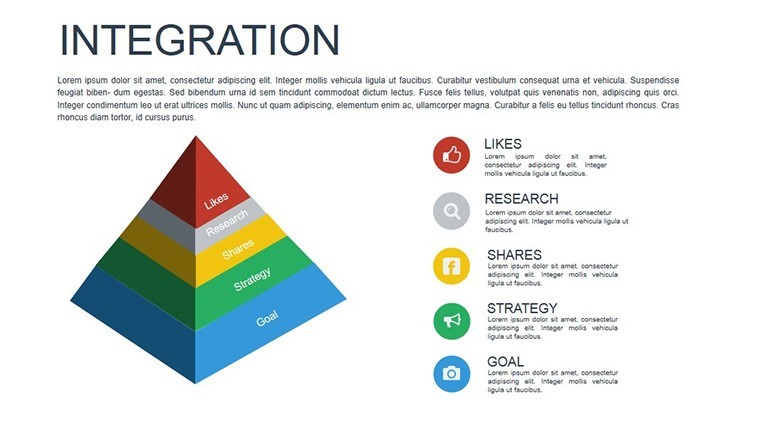
- Analysis Deep Dives: Process pyramids integrating qualitative metrics, from surveys to sentiment scores.
Outshining siloed spreadsheets, these charts foster holistic views - McKinsey notes integrated dashboards accelerate decisions by 20%. Tailor for your sector: Healthcare for patient flow, retail for omnichannel syncs.
Superior Synergy: Beyond Basic Charting
Free alternatives fragment; ours unifies with smart guides for auto-snapping elements. Accessibility baked in - contrast ratios meet AA standards, voiceover-friendly labels included. Collaborate via shared libraries, turning individual charts into team tapestries.
Workflow hack: Sync with Numbers for auto-pulls, present in Keynote, archive as interactive PDFs. The outcome? Stakeholders see the whole cloth, not just threads.
Mastery Moves: Fine-Tuning Your Integrations
Limit arrow clutter - use opacity fades for backgrounds. Theme for compliance: Neutral tones for finance, vibrant for creative projects. Hyperlink nodes to source docs, weaving a web of verifiability.
"Integrated our ERP visuals overnight - game-changer," raves an IT director. With flexible masters, your integrations evolve effortlessly.
Knit your data destiny. Secure the Integration Keynote Charts template today and forge unbreakable links - your cohesive canvas calls.
Frequently Asked Questions
Supports multiple slide ratios?
Yes - 16:9, 4:3, 16:10 presets, auto-adjusting connectors.
Integrate with external tools?
Seamlessly: CSV imports, Numbers links, even Tableau exports.
Best for large datasets?
Optimized for 1K+ points; grouping tools handle scale.
Animation speed controls?
Fully customizable - slow builds for emphasis, fast for overviews.
Export options for non-Apple users?
PDF, PPTX, or video - preserving layouts and links.
Good for
- Project roadmaps and sprint plans
- Product launch timelines
- Quarterly or annual review decks
- Company history and milestone summaries
Licence
reviews
I just needed decent charts without thinking too much and this helped.
The slides opened correctly in Keynote which was nice.
Text placeholders were a bit awkward on some pages.
Good for quick office presentations.
FAQ
Will it work in Google Slides?
Are fonts embedded?
Can I use this for client work?
What's the refund policy?
Do you update the template after purchase?
Similar templates
See all Keynote Charts →


All 16 slides