 Click to zoom
Infographic Mastery: Business Development Keynote Charts That Drive Decisions
| Format | .pptx |
| Slides | 27 unique layouts |
| Aspect ratio | 16:9 |
| Compatibility | PowerPoint |
| Animated | No |
| Language | English |
| License | Commercial |
| File size | — |
| Version | v1.0 |
| Last updated | October 2022 |
What's inside
In the high-stakes arena of business growth, where numbers must not just inform but inspire action, your visuals can make or break the deal. Enter the Development Keynote chart template for business presentations - a powerhouse of 27 editable infographics tailored for financial analysts, marketers, and strategists who crave clarity amid complexity. This isn't your run-of-the-mill slide deck; it's a curated collection of cycles, relationships, and arrow diagrams that transform dense spreadsheets into digestible, attention-grabbing stories.
Designed for those pivotal moments - like quarterly reviews or investor pitches - this template leverages bright, exciting elements to encode financial forecasts, market trends, and growth trajectories. Recall how companies like Salesforce turned infographics into billion-dollar narratives; here, you get that same edge with Keynote-native compatibility, ensuring fluid animations that reveal insights layer by layer. Whether dissecting ROI curves or mapping partner ecosystems, these slides help audiences retain 65% more information, per visual learning studies, turning passive viewers into active advocates.
Bright Visuals for Maximum Impact
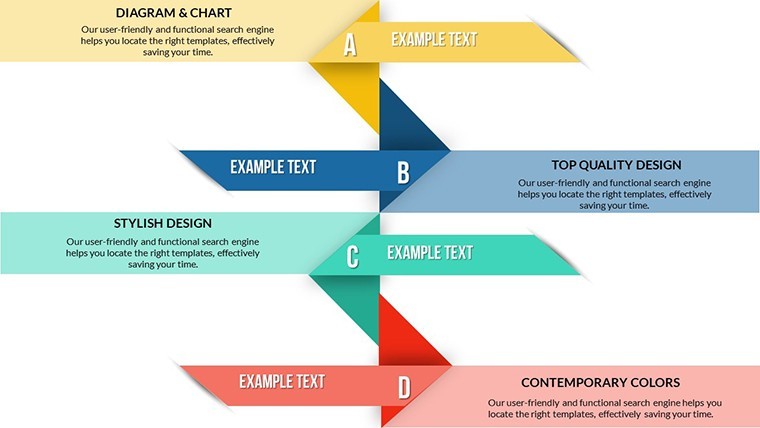
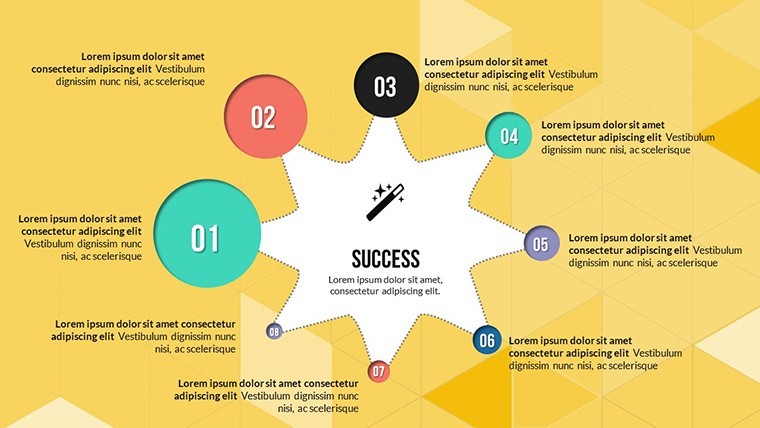
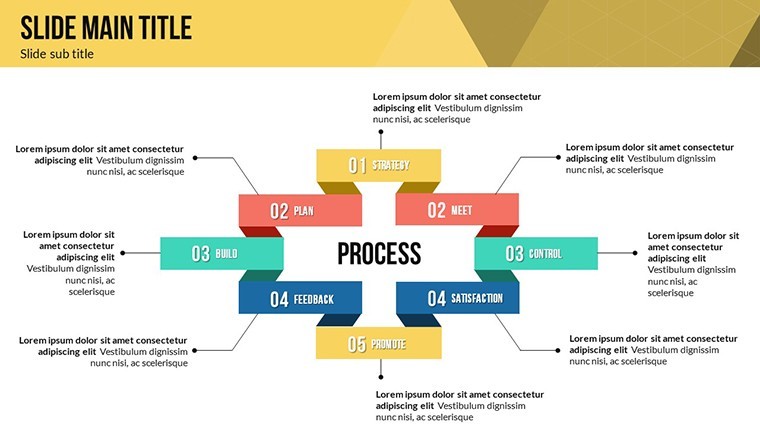
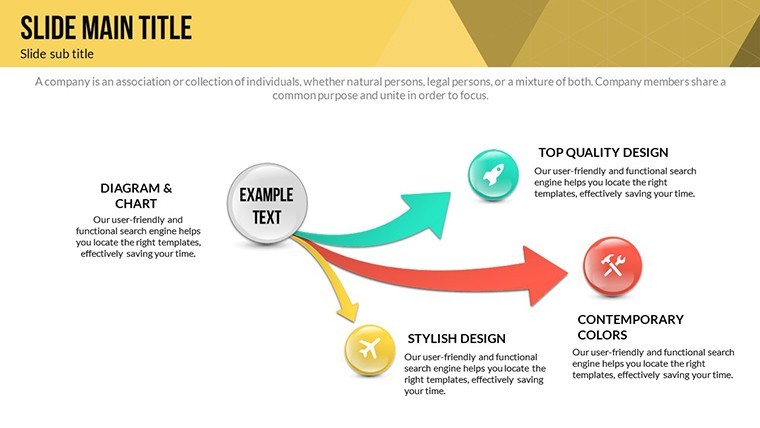
What sets this template apart? Its vibrant palette and modular builds, where each slide is a self-contained infographic ready for your data infusion. Slide 8's cycle diagram, for instance, loops through development stages - ideation to scaling - with arrow accents that pulse on click, mimicking market momentum. Edit effortlessly: drag to reorder phases, inject your metrics via smart tables, or overlay relationship webs to show stakeholder interconnections.
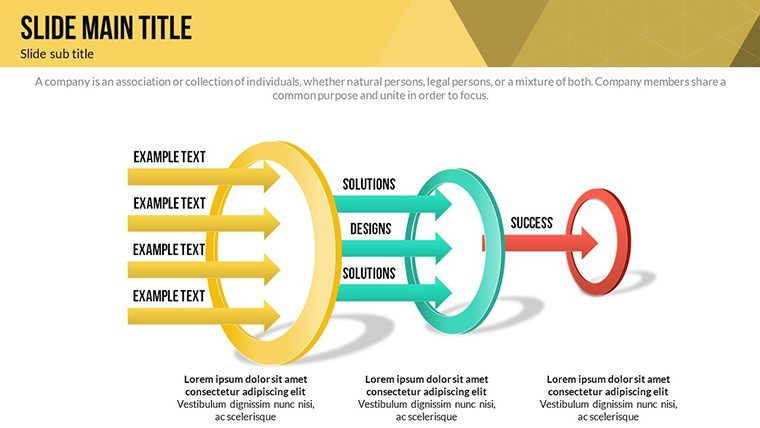
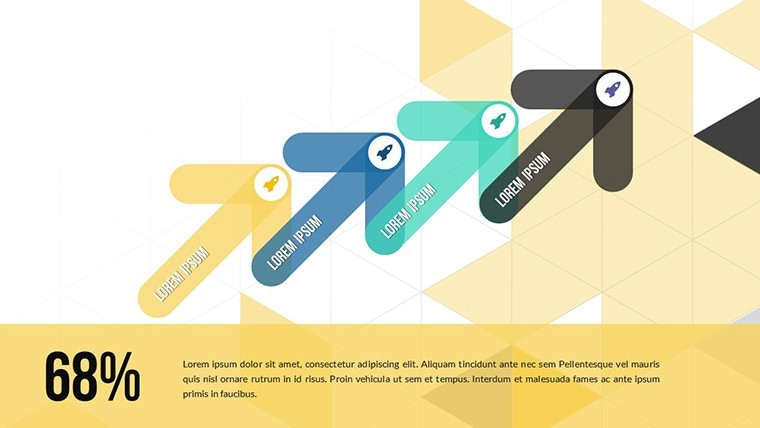
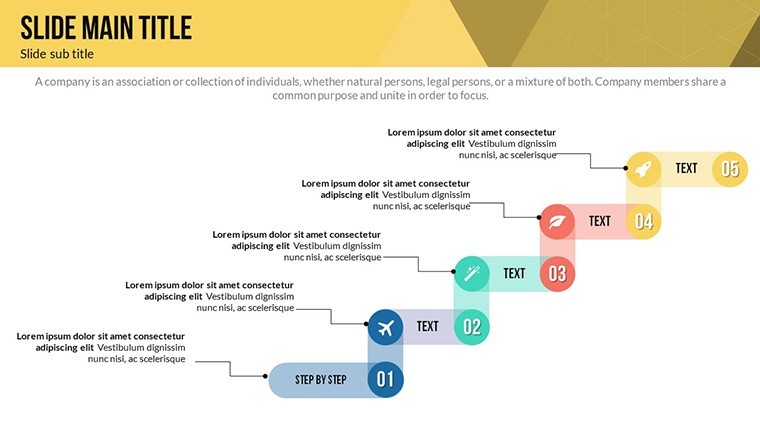
- Dynamic Arrow Flows: Guide narratives from problem identification to solution deployment, with color gradients signaling progress levels.
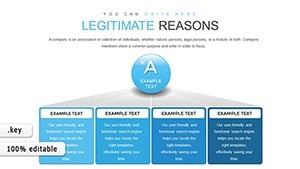
- Relationship Matrices: Visualize B2B networks or competitive landscapes, scalable for solo ventures or enterprise sprawls.
- Cycle Animations: Looping visuals for recurring processes like budget cycles, complete with embeddable charts from Excel.
For a marketing team at a startup like Dropbox in its early days, such tools could visualize user acquisition funnels, spotlighting drop-off points with eye-popping hues. Export to PowerPoint for hybrid teams, or stay in Keynote for Mac-exclusive polish - either way, prep time slashes by half, freeing you for strategic tweaks.
Crafting Compelling Financial Narratives
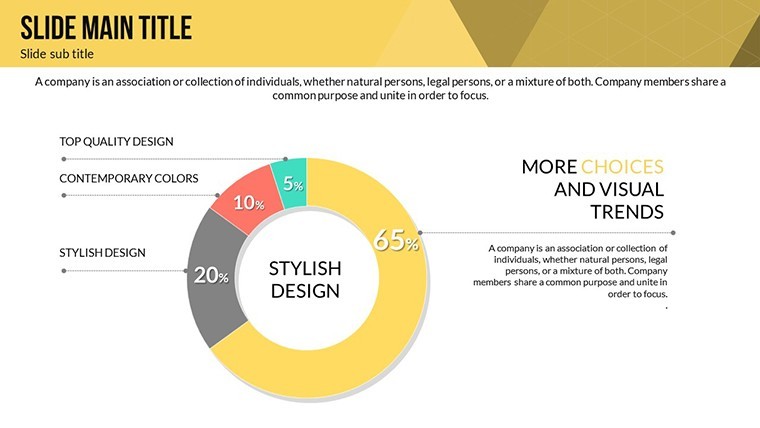
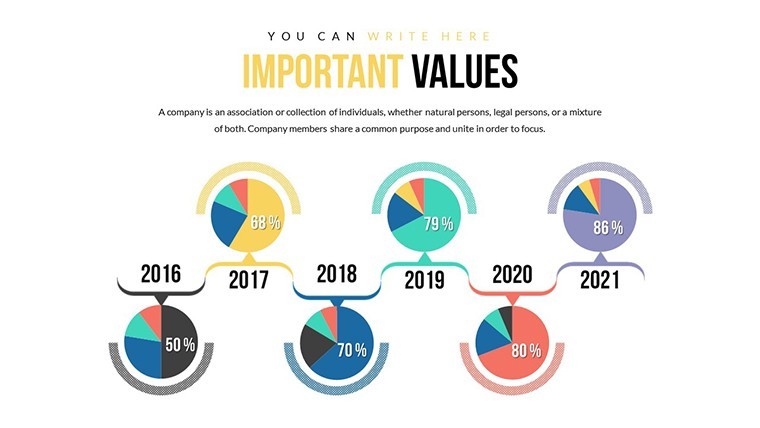
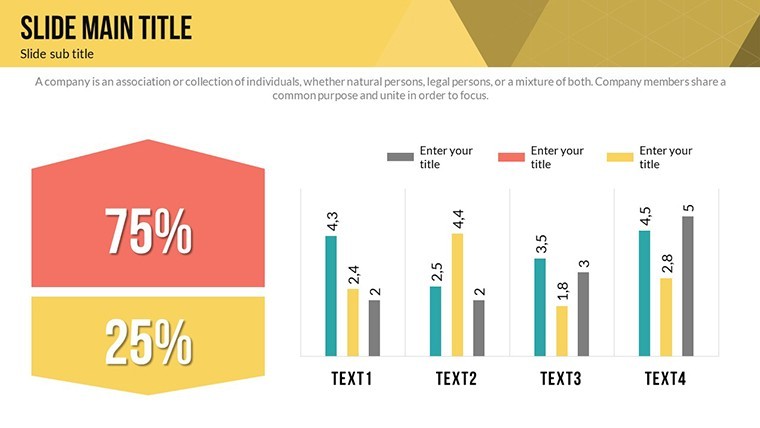
Zoom into slides 14-20: These arrow-driven infographics excel at financial storytelling, arrowing from revenue streams to expense breakdowns. Animate to unveil variances quarter-over-quarter, adding pie slices for allocation breakdowns. Tailor for e-commerce pitches, where a single slide quantifies cart abandonment recovery, blending LSI like "funnel optimization" into captions for natural SEO flow in shared decks.
Targeted Use Cases: From Strategy Sessions to Sales Wins
Envision deploying this in a boardroom: Slide 22's relationship chart links development KPIs to overarching goals, with nodes expanding on hover to detail tactics. Marketers use it for campaign roadmaps, cycling through AIDA models with festive icons that nod to seasonal pushes - light-hearted yet laser-focused.
- Financial Analysis Deep Dives: Arrow timelines for cash flow projections, integrating live data links for real-time updates.
- Marketing Brainstorms: Cycle diagrams for content calendars, where arrows branch into multichannel touchpoints.
- Sales Enablement: Relationship maps plotting lead nurturing paths, with metrics badges for conversion lifts.
Versus basic Google Slides, this template's pro-grade effects - like dissolve transitions on cycles - elevate professionalism, while tips like "Pair bold arrows with minimalist backgrounds for contrast" ensure scannability. Infuse whimsy: Label a stagnant cycle "The Hamster Wheel of Inefficiency" to spark chuckles and nods.
Expert Hacks for Infographic Excellence
Channel CMI standards: Cap elements at seven per slide, use consistent arrow weights for hierarchy, and A/B test color schemes for engagement. For global campaigns, swap icons for universal symbols, broadening appeal across borders.
Don't let stellar strategies gather dust in reports - secure this Business Development Keynote template now and animate your path to growth.
Standing Out in a Crowded Market
Unlike generic packs, this one's laser-focused on development dynamics, with 27 slides that interconnect for cohesive decks. Feedback highlights the "plug-and-play" arrows, boosting confidence for first-time users. Link to cycle templates for expansions, building a versatile arsenal.
Ultimately, these charts don't just display data - they propel progress, one vivid loop at a time.
Frequently Asked Questions
What makes these infographics suitable for business development?
The bright cycles and arrows simplify financial and marketing flows, making complex growth stories accessible and memorable.
Can I customize colors and add my own data?
Yes, vector elements allow full recoloring and data import via Keynote's chart tools - no design skills required.
Is it compatible with other presentation software?
Primarily Keynote, but .pptx exports work great in PowerPoint; Google Slides via conversion.
How many slides does it include?
27 editable slides, covering cycles, relationships, and arrows for comprehensive coverage.
Are animations built-in or customizable?
Both - pre-set for quick use, with easy overrides in Keynote for bespoke effects.
Ideal for beginners?
Definitely; intuitive edits and previews make it approachable for all levels.
Good for
- Project roadmaps and sprint plans
- Product launch timelines
- Quarterly or annual review decks
- Company history and milestone summaries
Licence
reviews
Downloaded this for a statistics presentation and finished editing pretty fast.
The timeline charts were easier to understand than I expected.
Some labels overlapped after adding longer text.
The slide backgrounds looked clean.
Good enough for last minute work.
FAQ
Will it work in Google Slides?
Are fonts embedded?
Can I use this for client work?
What's the refund policy?
Do you update the template after purchase?
Similar templates
See all Keynote Charts →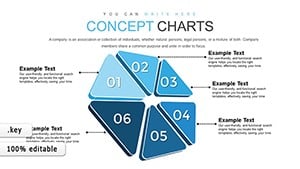

All 27 slides