 Click to zoom
Illuminate Strategy with Target Vision Cycle PowerPoint Charts
| Format | .pptx |
| Slides | 38 unique layouts |
| Aspect ratio | 16:9 |
| Compatibility | PowerPoint |
| Animated | No |
| Language | English |
| License | Commercial |
| File size | — |
| Version | v1.0 |
| Last updated | February 2026 |
What's inside
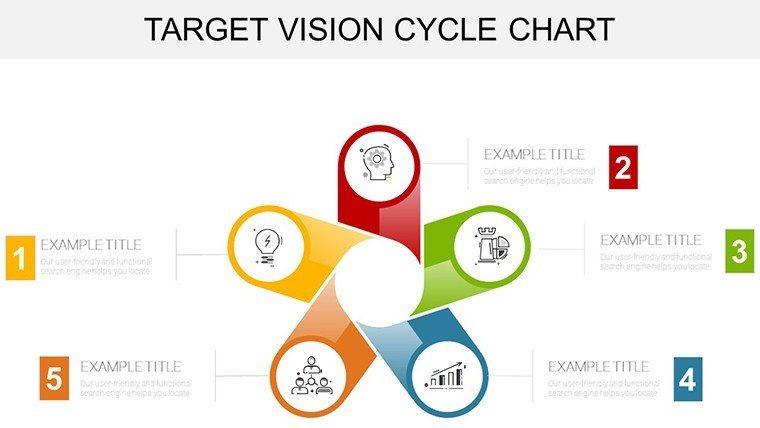
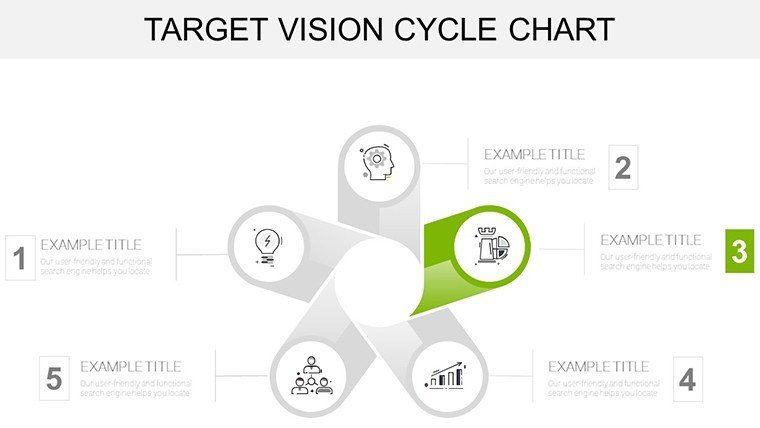
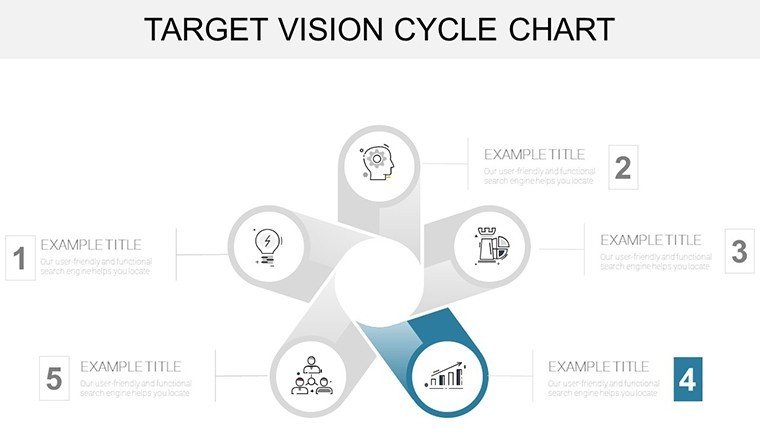
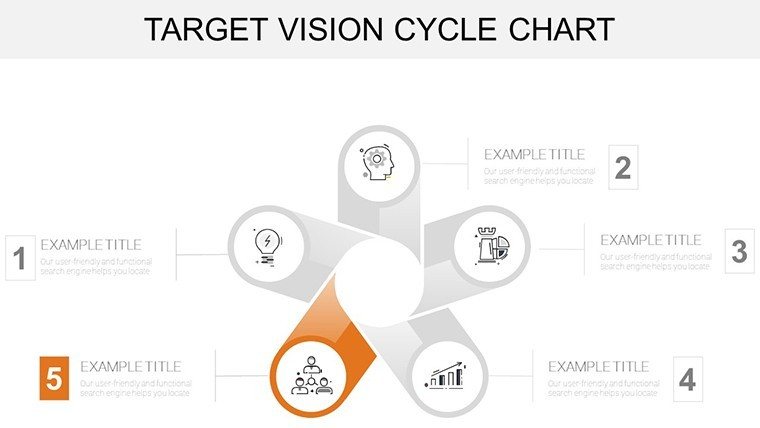
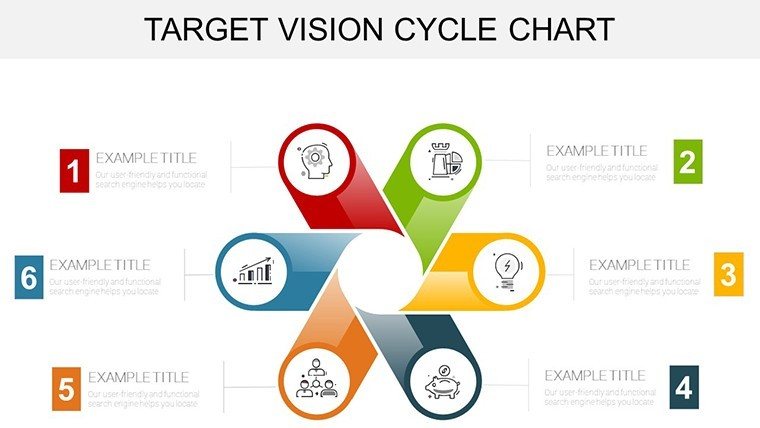
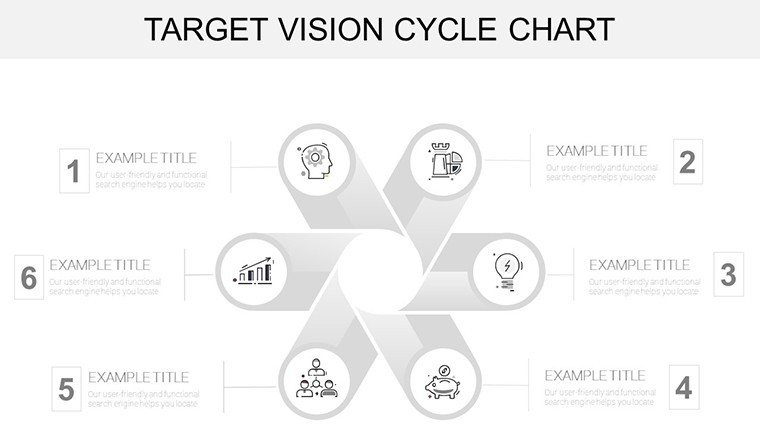
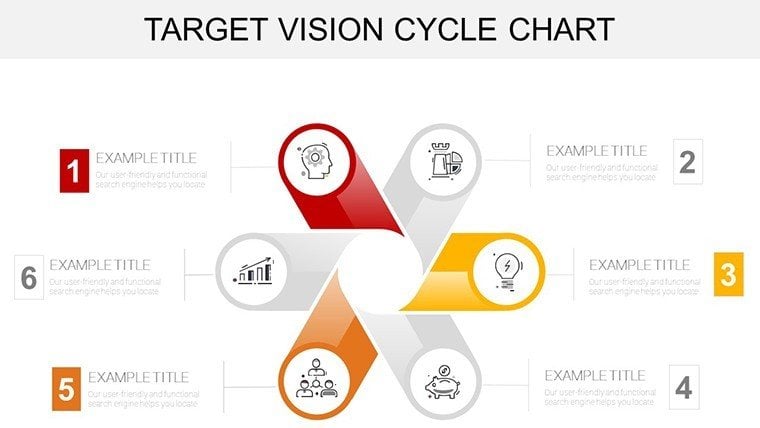
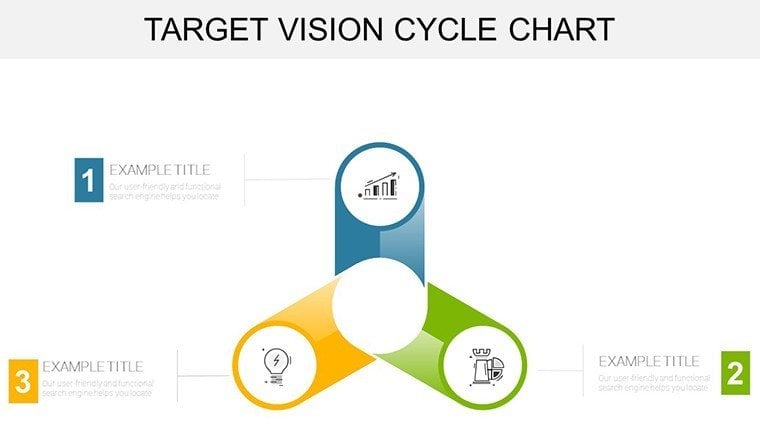
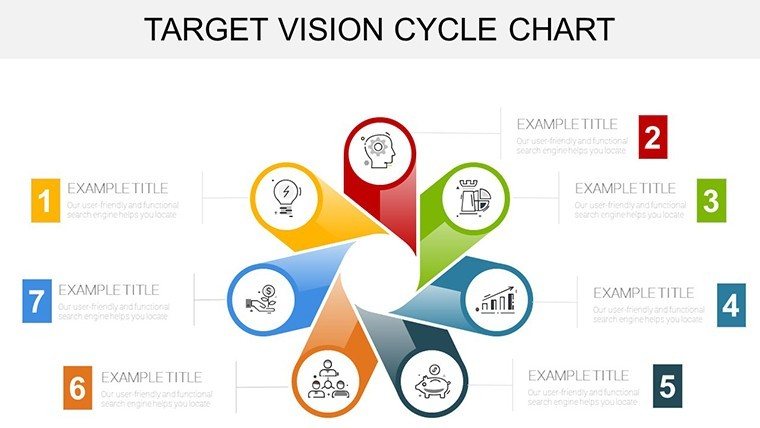
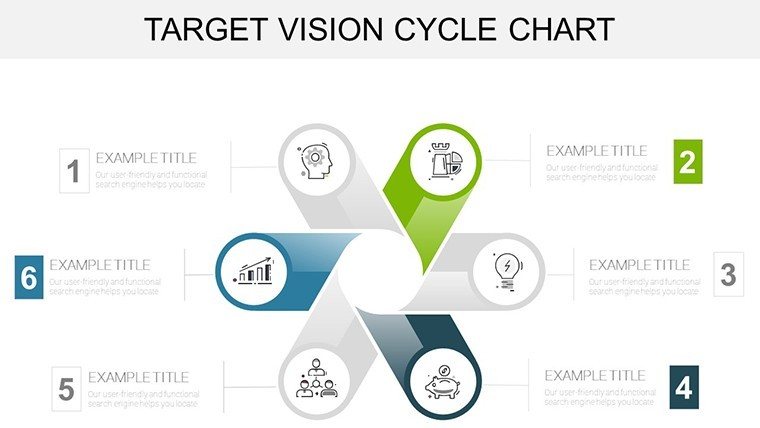
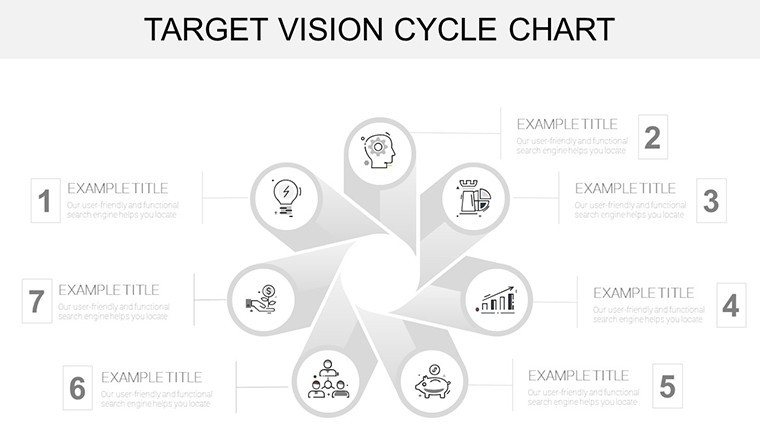
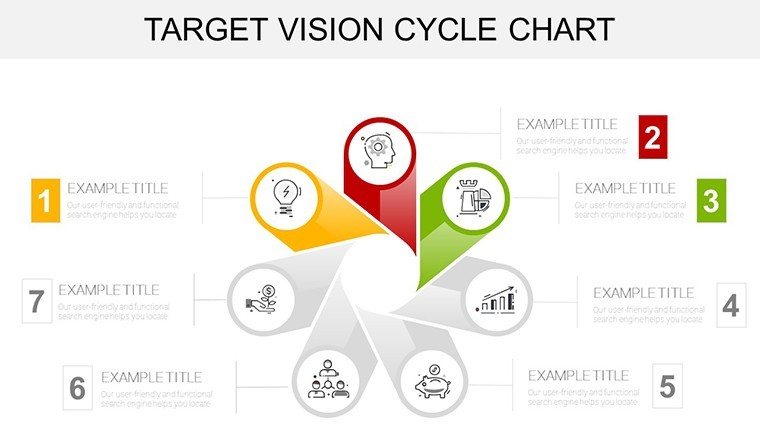
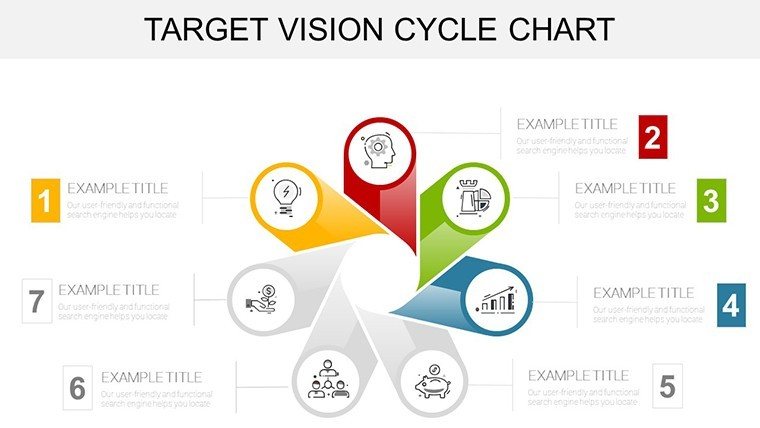
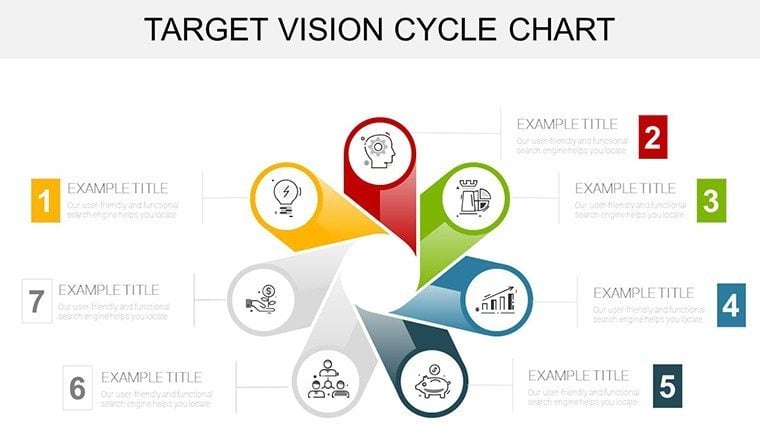
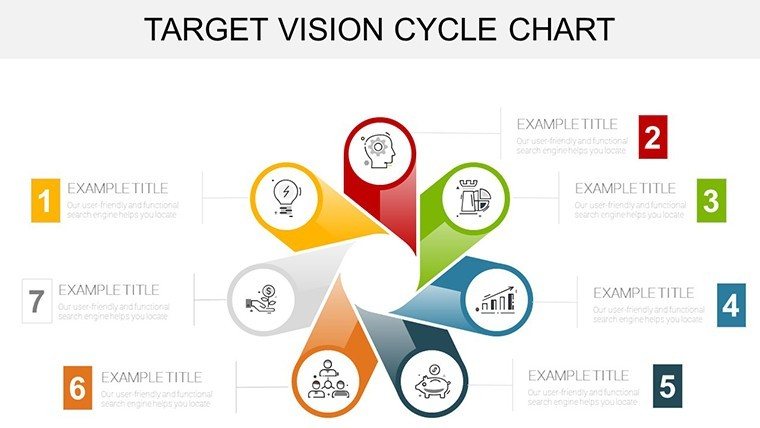
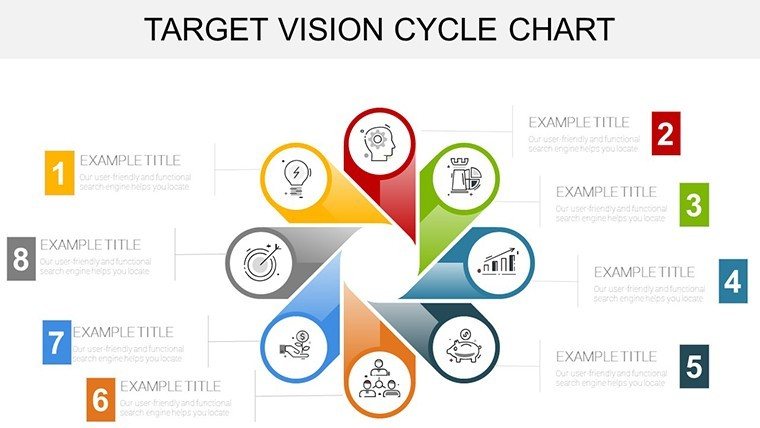
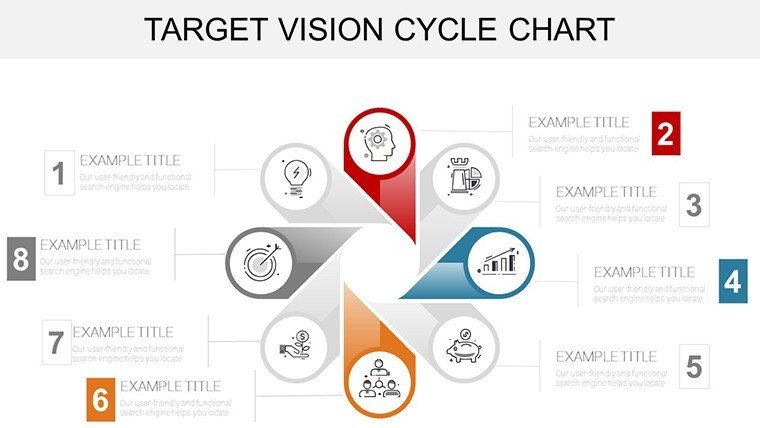
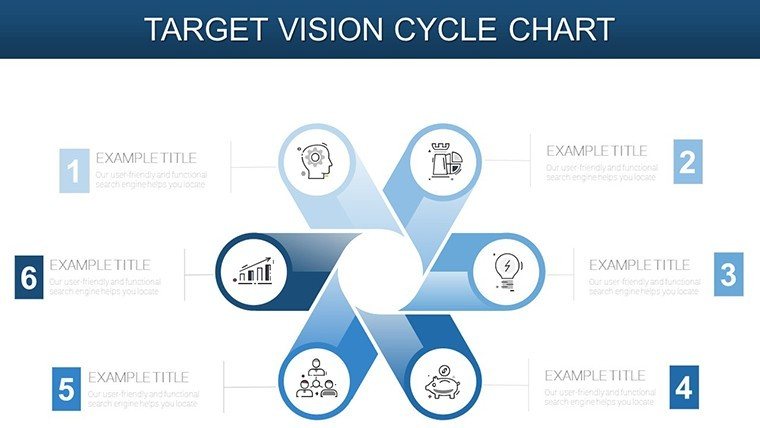
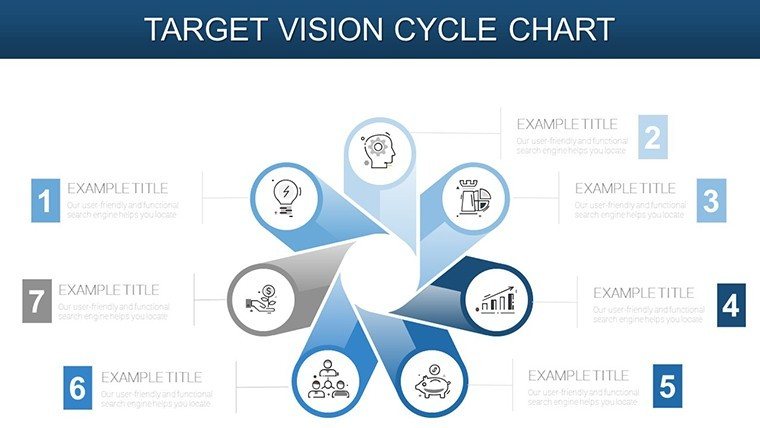
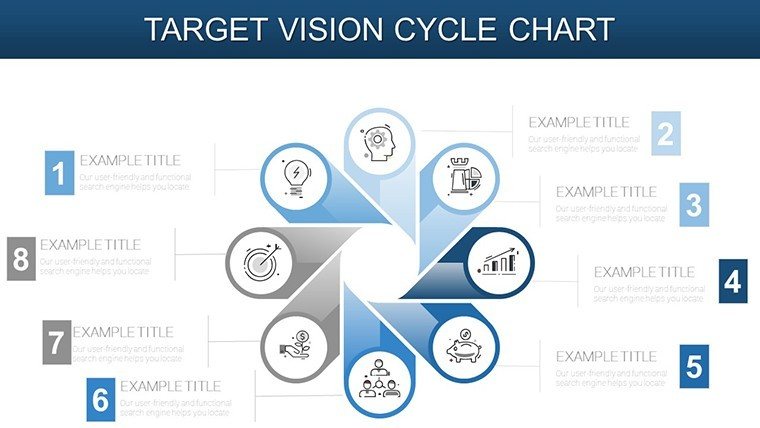
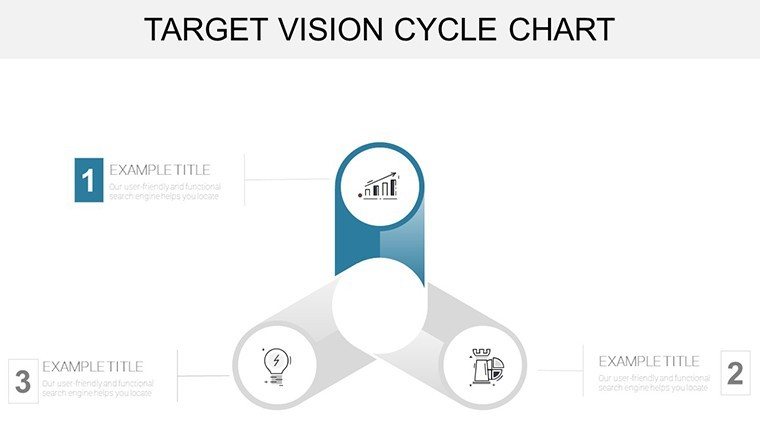
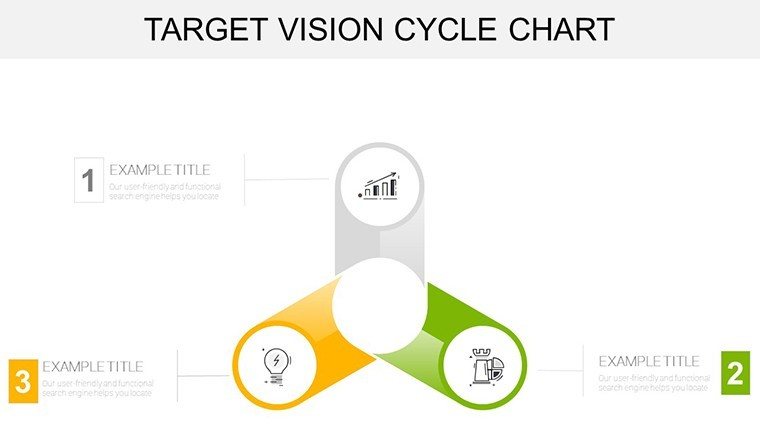
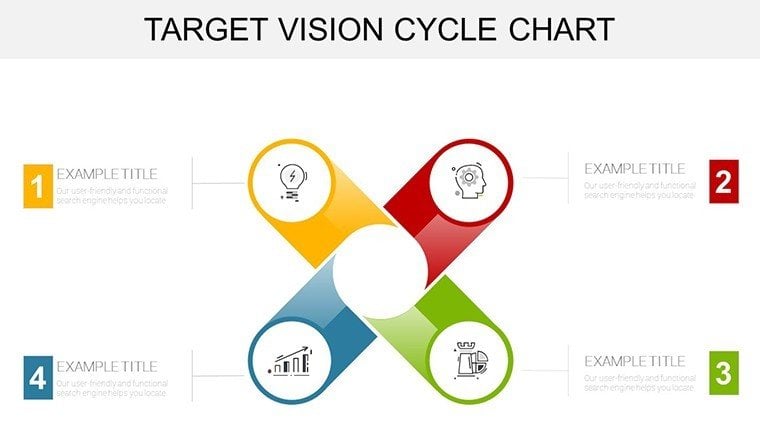
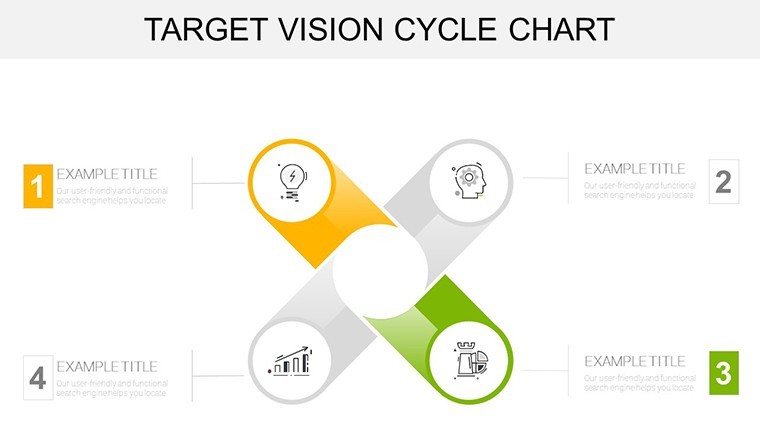
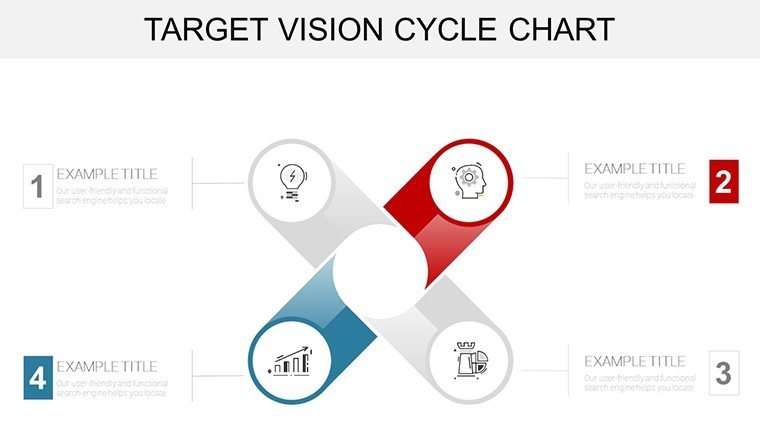
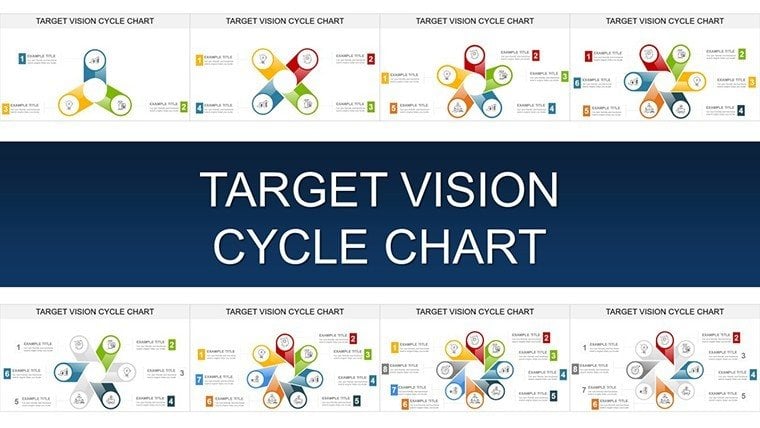
In the grand theater of enterprise strategy, where visions clash with realities and proportions dictate priorities, misaligned data can derail even the most visionary roadmap. You've got sectors vying for resources, missions fragmenting into silos - how do you unify them into a cohesive cycle that propels your organization forward? The Target Vision Cycle PowerPoint Charts Template answers with elegance: 38 editable slides that masterfully depict relationships, proportions, and focal points in cyclic harmony.
Aimed at strategists, enterprise developers, and visionaries crafting long-term missions, this template excels at small-dataset storytelling - think board-level overviews where every slice signifies strategic weight. Inspired by cyclical models in Peter Senge's "The Fifth Discipline," it fosters systems thinking, helping teams see how parts interconnect to sustain the whole. No more static lists; these charts breathe life into abstract concepts, making enterprise evolution tangible and persuasive.
Its edge? Geometric precision meets intuitive edits - highlight a sector with a simple glow effect, or rotate cycles for fresh perspectives. PowerPoint-optimized (.pptx), it handles animations that simulate rotational insights, ideal for virtual town halls. Lightweight and vector-based, it scales from keynote screens to printed reports without pixelation, democratizing high-level viz for all skill levels.
Crafting Compelling Cyclic Narratives
At heart, these charts are geometric symphonies for relational data. Slide 7's core cycle divides market shares into wedges, with exploded views for deep dives - perfect for underscoring a pivot toward emerging tech.
- Proportion Wheels: Radial divisions for budget allocations, with percentage labels that auto-adjust on data entry.
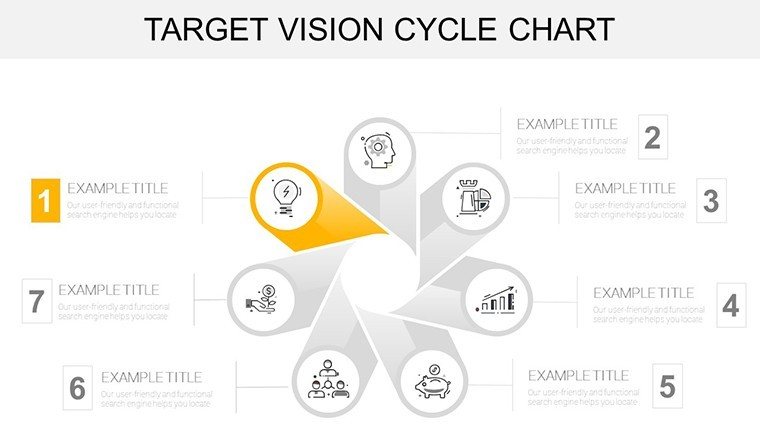
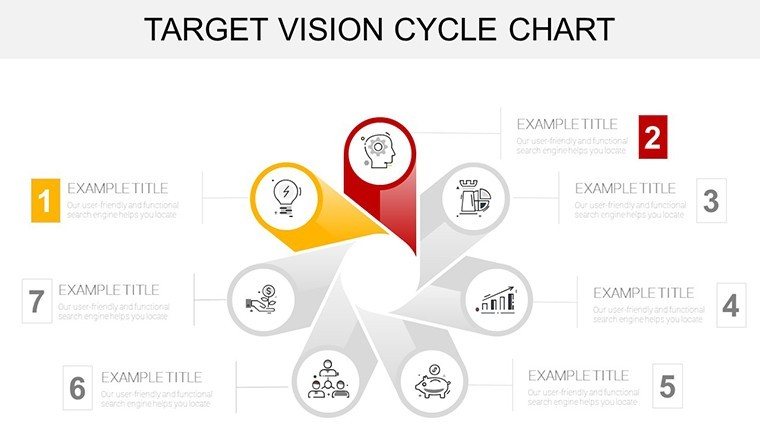
- Sector Spotlights: Detachable arcs emphasizing outliers, like R&D's outsized impact on innovation metrics.
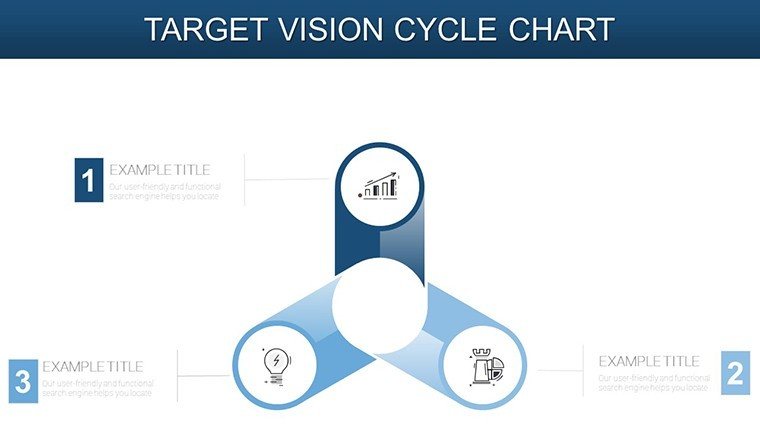
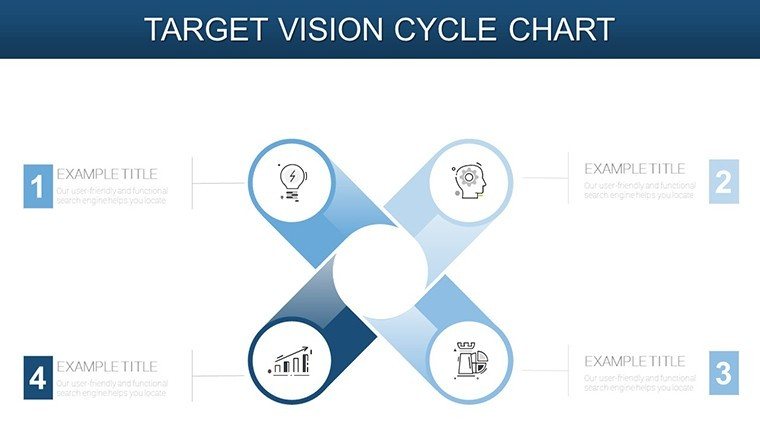
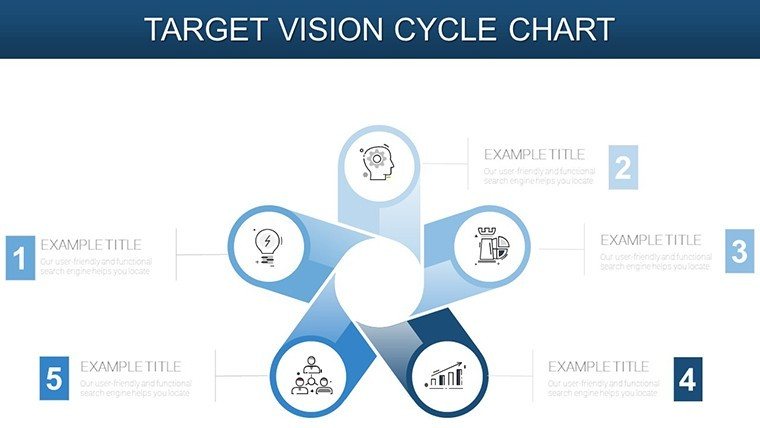
- Relation Loops: Interlinked rings showing feedback cycles, from strategy to execution and back.
- Whole-Part Harmonies: Nested cycles contrasting micro-tactics within macro-visions.
Rooted in Gestalt principles of perception, they group elements intuitively, reducing cognitive load - per studies from the Nielsen Norman Group on dashboard efficacy. Edit freely: recolor for thematic resonance, or embed hyperlinks to mission docs.
Navigating from Concept to Cycle Deployment
Launch your vision with this phased approach:
- Scope the Cycle: Identify relational data - e.g., departmental contributions to revenue - from strategy briefs.
- Build the Base: Pick a proportion slide, populate with values; watch auto-calcs derive percentages.
- Accentuate Angles: Isolate key sectors via grouping tools, adding tooltips for layered intel.
- Cycle Through Iterations: Test rotations and zooms, ensuring accessibility for color-blind viewers.
- Deploy Dynamically: Animate spins for emphasis, capping with calls to collective action.
Proven payoff: Enterprises mirroring BCG frameworks report 20% better alignment post such visuals.
Visionary Applications: Cycling Toward Enterprise Zenith
Strategic planners use it for mission mapping - slide 20's loop illustrates policy impacts rippling through operations, clarifying long-term prospects. In development reviews, proportion charts dissect investment returns, focusing on high-yield sectors to guide capital flows.
For mission implementation, nested cycles on slide 28 relate tactical KPIs to overarching goals, bridging gaps that stall progress.
Refining Long-Term Prospects
Board strategy sessions? Deploy full-cycle dashboards to debate resource tilts, with visual equity ensuring balanced discourse.
Harmonizing Team Missions
Internal cascades: Break down enterprise cycles into departmental subsets, empowering units with contextual clarity.
Outshining plain PowerPoint rings, this template's refined curvatures and shadow depths confer sophistication, transforming data into discursive art.
Strategic Nuances for Cycle Supremacy
Elevate with 3D tilts for depth illusion, or sync with SWOT matrices for fuller context. Prioritize minimalism - let whitespace amplify the cycle's message. In global ops, localize labels for cultural resonance.
Envision your enterprise's arc anew. Acquire the Target Vision Cycle PowerPoint Charts Template today and cycle strategies into sustained success.
Expand your arsenal via related cycles.
Frequently Asked Questions
Why cyclic charts for strategic visions?
They elegantly show interconnections and proportions, ideal for holistic enterprise narratives.
Handling larger datasets?
Best for small sets; for more, aggregate into summary sectors with drill-down links.
Customization for branding?
Full spectrum - gradients, patterns, and fonts adapt to any corporate identity.
Animation possibilities?
Rich options, from subtle rotations to phased reveals, enhancing engagement.
Export compatibility?
Flawless to PDF or images; retains editability in PowerPoint ecosystem.
Suitable for non-business use?
Yes, adaptable for educational or personal goal cycles.
Good for
- Project roadmaps and sprint plans
- Product launch timelines
- Quarterly or annual review decks
- Company history and milestone summaries
Licence
reviews
I was rushing and this template helped a lot
Graphs were easy to plug numbers into
Layout feels basic but usable
Some icons didn’t match my topic
Still got my presentation done on time
FAQ
Will it work in Google Slides?
Are fonts embedded?
Can I use this for client work?
What's the refund policy?
Do you update the template after purchase?
Similar templates
See all PowerPoint Charts →

All 38 slides