 Click to zoom
Fishbone Diagram PowerPoint Template
| Format | .pptx |
| Slides | 14 unique layouts |
| Aspect ratio | 16:9 |
| Compatibility | PowerPoint |
| Animated | No |
| Language | English |
| License | Commercial |
| File size | — |
| Version | v1.0 |
| Last updated | January 2025 |
What's inside
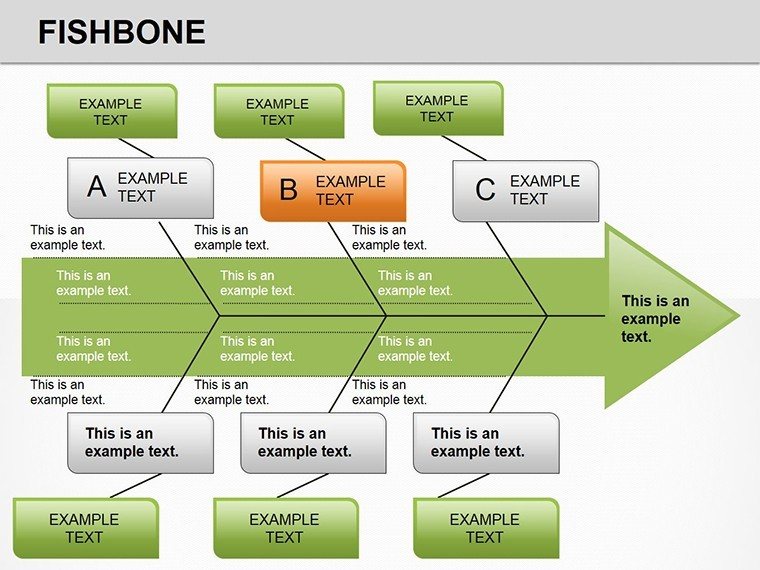
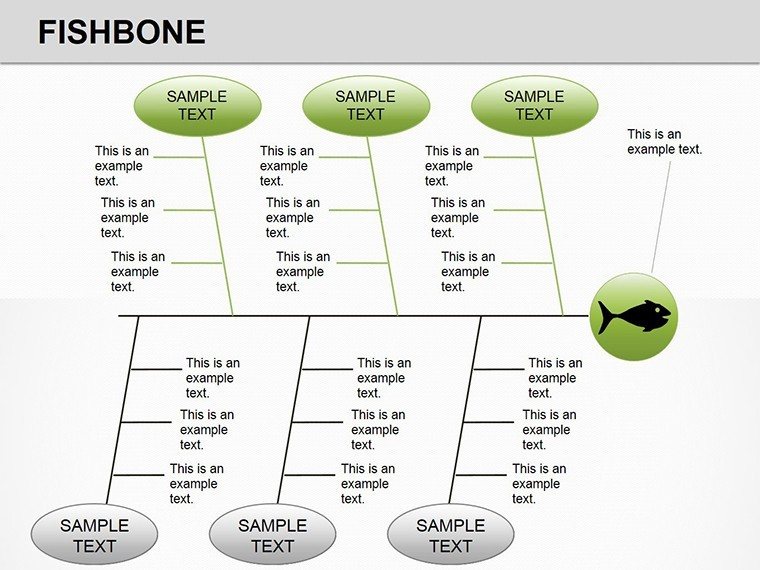
Ever chased a problem only to realize the real culprit hides in plain sight? The Fishbone Diagram PowerPoint Template cuts through the fog with 14 meticulously crafted slides that embody the classic Ishikawa approach, reimagined for modern workflows. Aimed at quality assurance specialists, process engineers, and team facilitators, this tool dissects issues into categories like methods, materials, and manpower, revealing interconnections that drive real fixes.
Whether auditing operations or brainstorming improvements, these visuals foster collaborative discovery without the hassle of from-scratch builds. Optimized for PowerPoint 2016+, the vector-driven design ensures flawless rendering on projectors or PDFs. For $20, you're gaining a versatile asset that turns reactive firefighting into proactive mastery. Step up your diagnostic game - acquire this template now and hook the truths behind your challenges.
Standout Features of the Fishbone Framework
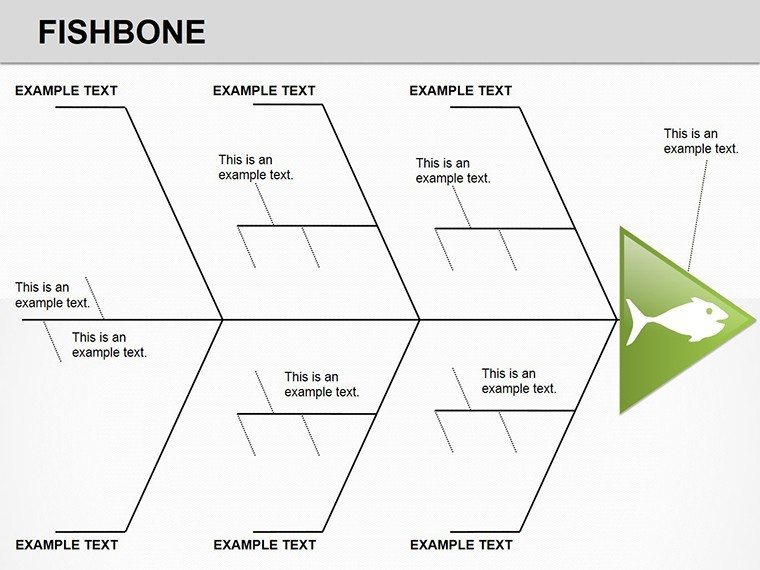
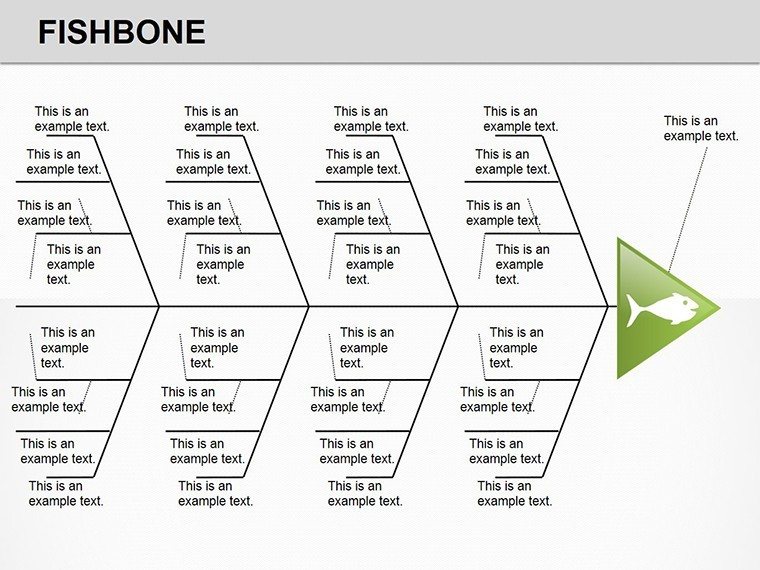
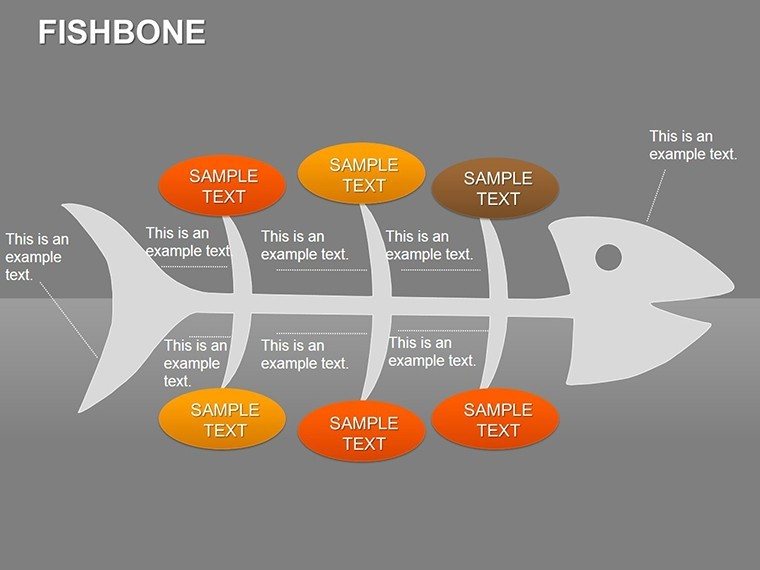
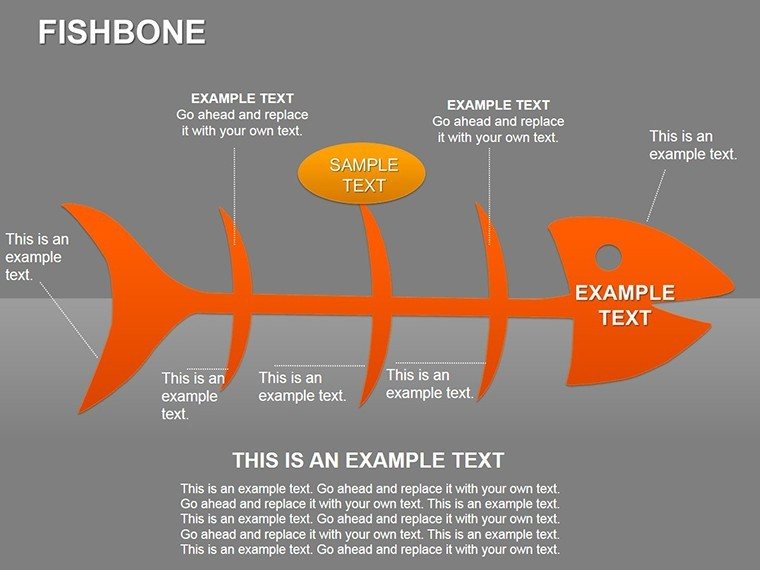
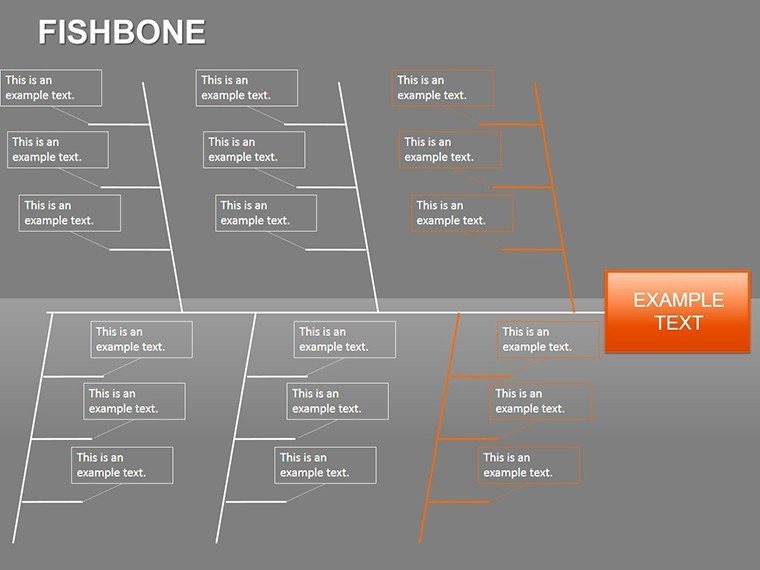
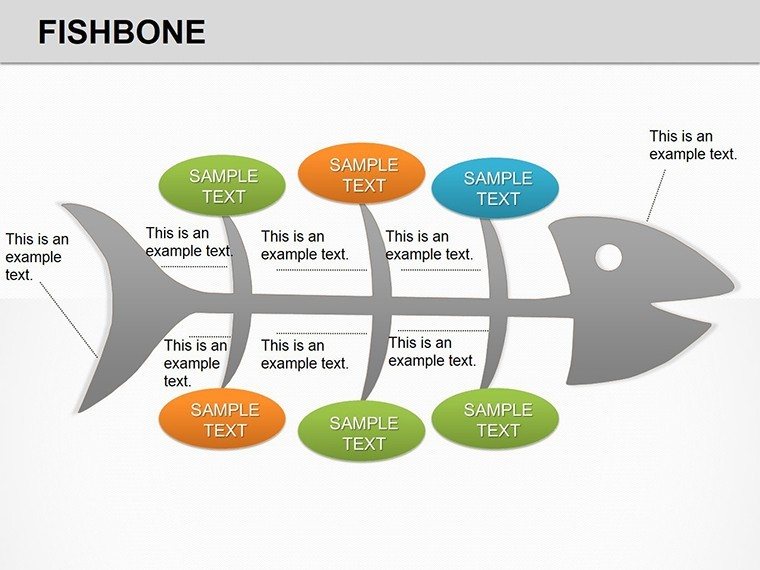
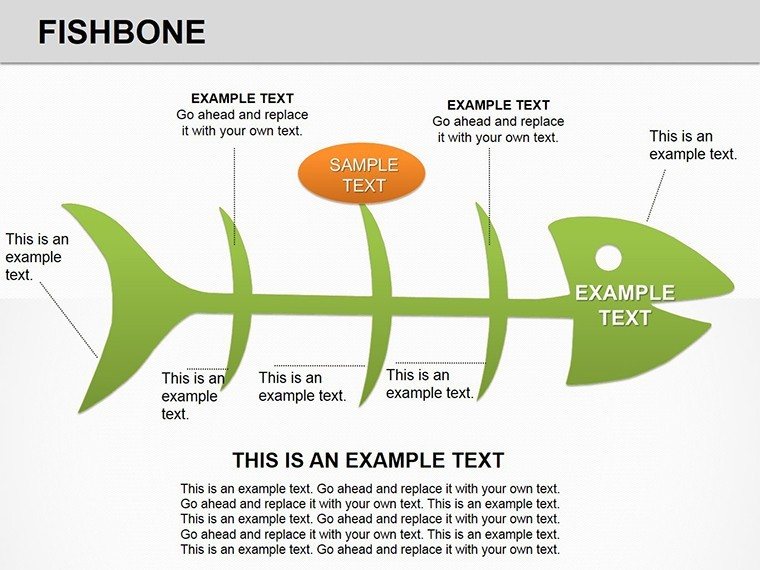
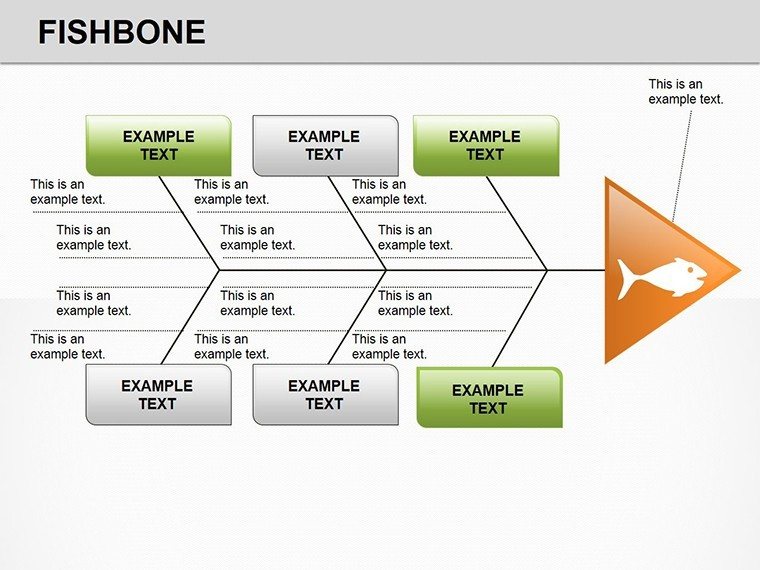
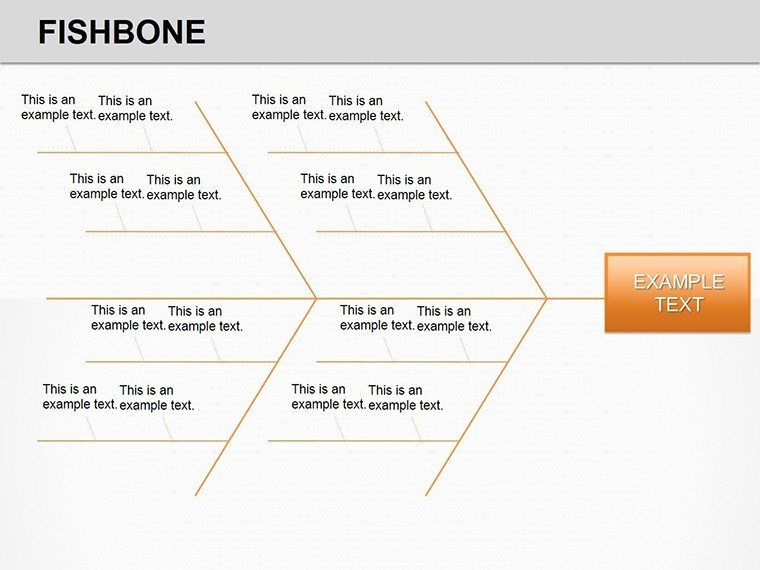
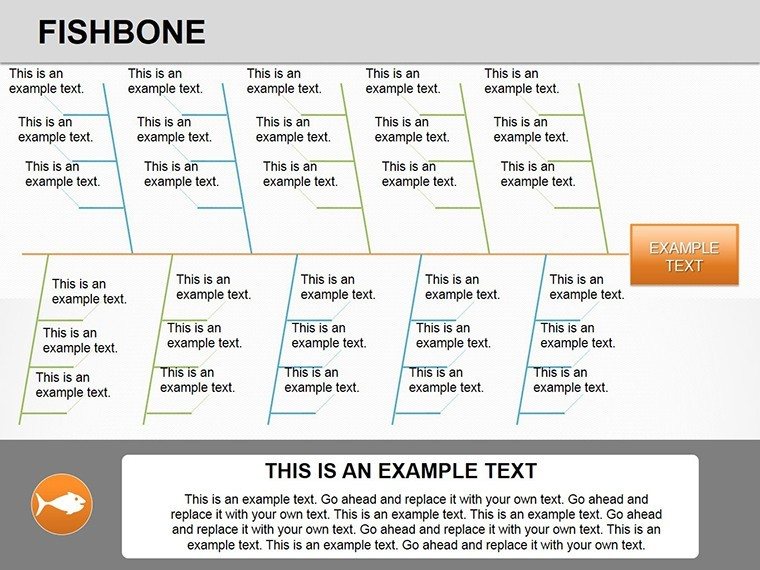
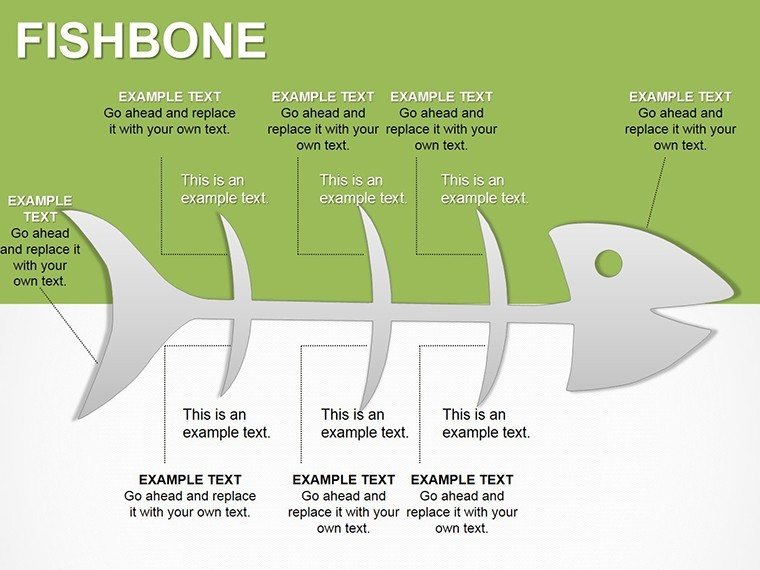
Central to this PowerPoint diagram template is the iconic skeletal structure, with a "head" for the effect and "bones" branching for causes - each category pre-labeled but fully renameable. Slides vary from simple single-fish to multi-layered hybrids, accommodating everything from quick audits to comprehensive reviews.
Enhance engagement with gradient shading on spines, denoting priority levels, and tooltip-ready text boxes for drill-down notes. Compared to native SmartArt, this offers finer control over bone curvature and spacing, preventing crowded visuals. Safety officers, for example, customize the manpower arm to spotlight training gaps, aligning with ISO standards intuitively.
- Modular Bones: Detach and rearrange categories independently.
- Icon Library: Embedded symbols for quick categorization, like tools for machinery.
- Responsive Layout: Auto-reflows on text overflow for clean presentations.
Such details make dissecting dilemmas not just possible, but pleasurable - equipping you to lead with insight.
Exploring the 14 Slides in Depth
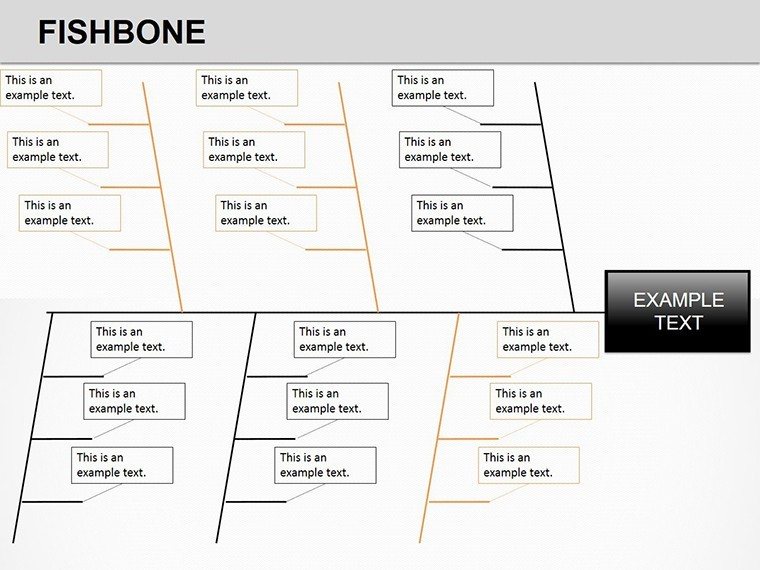
The journey begins with Slide 0: a foundational horizontal fishbone, head on the right for outcome focus, with four primary bones - ideal for introductory overviews. Slide 3 introduces vertical orientation, flipping the flow for vertical screens or emphasis on hierarchy.
Slide 6 merges fishbone with timelines, tracking cause evolution over months - handy for incident reports. Midway, Slide 8's 6M variant (man, machine, etc.) caters to manufacturing, with sub-bones for granular factors like vendor reliability.
Toward the end, Slides 12-13 offer comparative fishbones side-by-side, contrasting before-and-after interventions, and a 3D-rendered finale for dramatic closes. Every slide packs editable spines with sample causes, like "outdated software" under methods, sparking immediate relevance.
- Edit Flow: Group-select bones via Ctrl+click for batch styling.
- Visual Boost: Add subtle glows to the head for spotlight effects.
This curated sequence scaffolds your analysis, from broad strokes to pinpoint precision.
Targeted Applications That Deliver Results
In a hospital setting, a nurse manager employs Slide 4's people-centric fishbone to untangle staffing shortages, bones revealing shift overlaps and morale dips - paving the way for roster tweaks. Environmental consultants use Slide 9's eco-themed variant to map pollution sources, categorizing under nature and measurement for regulatory briefs.
For software devs, the template shines in post-mortem reviews: Slide 11's integrated swimlane dissects deployment fails, blending fishbone with responsibility lanes. A retail ops lead adapted Slide 7 for inventory woes, exposing supplier delays as the spine - resulting in diversified sourcing. These instances prove the template's chameleon-like fit across sectors.
In workshops, facilitate group fills on shared slides via PowerPoint Live, turning solo efforts into collective wisdom. The essence: Use it to empower, not overwhelm, always circling back to the "head" for unified purpose.
Hands-On Tips for Tailoring Your Diagrams
Import the .pptx, navigate to a slide, and use the Shape Format tab to elongate bones for longer lists - maintaining the fish silhouette's integrity. Infuse industry flavor by swapping icons: beakers for R&D causes, clocks for timing issues.
To animate revelations, set entrance effects bone-by-bone, unveiling from tail to head for narrative build. Collaborate? Share via OneDrive for versioned edits. Common fix: If bones overlap, nudge with the Align tool under Drawing.
For exports, opt for 16:9 aspect to preserve proportions. These practices elevate the template from stock to bespoke, mirroring your expertise.
Reel in resolutions - snag it for $20 and start angling for excellence.
Frequently Asked Questions
What's the file format and compatibility?
.pptx for PowerPoint 2016+; convertible to Google Slides with layout preservation.
Can categories be customized beyond the defaults?
Yes, relabel and add/remove bones freely to fit your framework.
Does it support animations for presentations?
Prepped with simple wipes; expand using PowerPoint's Animation Pane.
How many cause levels per bone?
Infinitely nestable - start with 2-3 for clarity, expand as needed.
Is it printable for workshops?
Perfectly - export as handout with multiple slides per page.
Any guides included?
A built-in notes section outlines basic modifications.
Good for
- Project roadmaps and sprint plans
- Product launch timelines
- Quarterly or annual review decks
- Company history and milestone summaries
Licence
reviews
The Pareto chart ready to fill.
The bars and cumulative line.
Used this for a defect analysis.
The 80% line is pre-drawn.
FAQ
Will it work in Google Slides?
Are fonts embedded?
Can I use this for client work?
What's the refund policy?
Do you update the template after purchase?
Similar templates
See all Powerpoint Diagrams →

All 14 slides