 Click to zoom
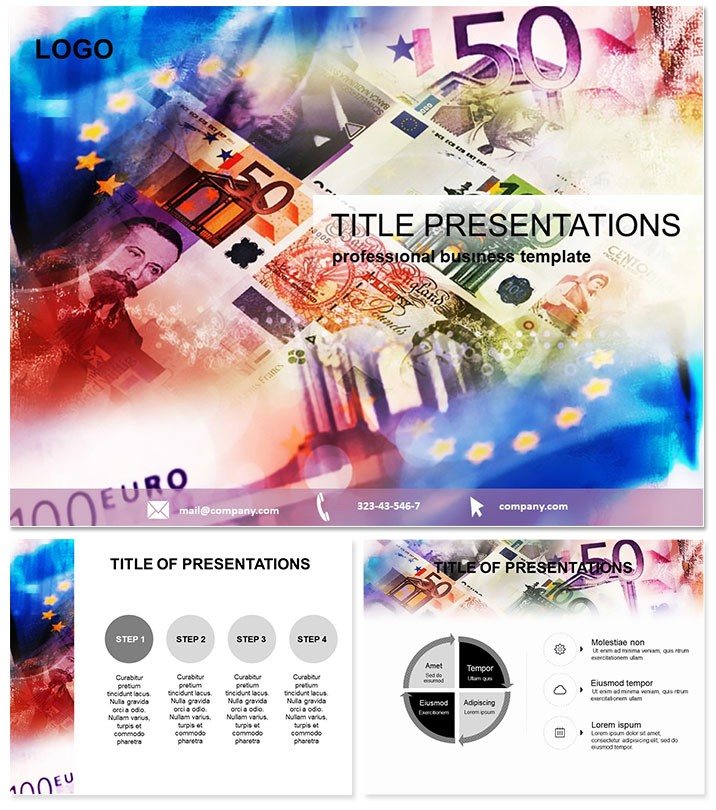
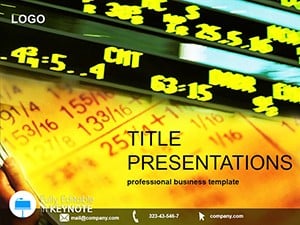
Euro Exchange Keynote Template
| Format | .pptx |
| Slides | 3 unique layouts |
| Aspect ratio | 16:9 |
| Compatibility | PowerPoint |
| Animated | No |
| Language | English |
| License | Commercial |
| File size | — |
| Version | v1.0 |
| Last updated | December 2025 |
What's inside
As a consultant who's spent years breaking down volatile currency markets for C-suite executives in bustling boardrooms across Europe, I've learned one truth: the right visual tool can turn a sea of fluctuating numbers into a clear path to decisions. That's where the Euro Exchange Keynote Template steps in. Designed specifically for Keynote users who demand precision in every slide, this template packs 28 versatile diagrams tailored to euro transactions, rate fluctuations, and broader economic patterns. Whether you're briefing on hedging strategies during a market dip or illustrating conversion impacts for international expansions, these slides make the abstract tangible.
Built on Keynote's robust framework since 2016, it integrates seamlessly with your existing workflows, allowing real-time data pulls that keep your presentations as current as the latest ECB announcement. No more wrestling with clunky defaults - here, euro icons and ticker-inspired backgrounds set the stage for narratives that resonate. In my practice, templates like this have cut prep time by streamlining edits, letting me focus on storytelling that drives action. If you're in finance, advisory, or economic analysis, this is your shortcut to visuals that command attention and build trust.
Core Features That Drive Financial Clarity
At its heart, this template revolves around three master layouts that enforce consistency, ensuring every slide feels part of a cohesive financial dossier. Imagine starting with a master slide dotted with subtle € symbols - perfect for headers that instantly signal currency focus without overwhelming the viewer.
Background Options for Thematic Depth
Choose from three backgrounds that evoke the rhythm of markets: one mimicking ledger lines for a professional audit vibe, another scattering coin motifs for a nod to tangible exchanges, and a third with faint ticker tape lines to capture live trading energy. These aren't mere aesthetics; they ground your data in context, making abstract rates feel immediate and relevant.
28 Diagrams Tailored for Currency Dynamics
The real power lies in the 28 diagrams, each crafted to handle specific aspects of euro-centric finance. Line graphs trace historical rate trends over months, revealing patterns like post-Brexit volatility at a glance. Scatter plots map GDP against exchange shifts, ideal for correlating economic health with currency strength. Venn diagrams overlap market influences - say, inflation zones intersecting with trade policies - highlighting overlaps that spark strategic discussions.
Other standouts include pyramid structures for layering risk assessments, where base levels represent stable factors and apex points flag high-volatility exposures. Funnel visuals guide through transaction flows, from quote request to settlement, ensuring compliance steps shine through. And for forecasts, arrow timelines project future scenarios, with branching paths for best- and worst-case euro devaluations. All are editable in Keynote, with smart guides for effortless resizing.
Seven Color Schemes for Versatile Impact
Adapt to your brand or audience with seven palettes: start with neutral grays for conservative reports, shift to greens and golds for bullish outlooks, or dial up bold contrasts for high-energy pitches. These schemes apply across diagrams, maintaining harmony while allowing quick swaps - vital when tailoring for a German bank's subdued tones versus a London hedge fund's vibrant edge.
In practice, I've layered animations on these: a simple build sequence on a line graph simulates rate climbs, drawing eyes along the path as if watching a live feed. Hyperlinks to external data sources mean one click updates the whole deck, keeping it fresh for recurring client reviews.
How Professionals Integrate This Template into Daily Workflows
Workflows in finance aren't linear - they're iterative, data-fed loops. This template fits right in, starting with data import from tools like Excel or Bloomberg terminals. Paste rate tables into Keynote, and the diagrams auto-populate, resizing axes to fit without distortion. Collaborative features shine here: share via iCloud, and team members annotate directly, with version history tracking who adjusted that critical forecast slide.
For educators in business schools, it's a staple for lecture prep. Input semester-long euro data sets, and students interact with animated builds during class, fostering deeper understanding of forex principles. Consultants like me use it for proposal decks, where grouped elements let us batch-edit currencies across sections - swap euros for yen in under a minute for Asia-focused clients.
Even in non-finance roles, like operations managers tracking cross-border costs, it streamlines reporting. The vector-based designs ensure scalability for print handouts or digital exports, maintaining sharpness on any device.
Real-World Applications Across Key Scenarios
Drawing from my weekly client sessions, here's how this template transforms presentations in high-stakes environments.
Consultants Crafting Advisory Pitches
Picture prepping for a mid-sized exporter facing euro weakness against the dollar. I load the template, slot in Q3 rates via a linked table, and use a multi-line graph to compare historicals against projections. The euro icons on axes make it intuitive - clients spot the 5% dip immediately, leading to targeted hedging talks. In one session, this visual flipped a hesitant prospect into a six-figure contract, as it demystified risks they'd previously glossed over.
Managers Leading Internal Strategy Reviews
For a retail chain's quarterly review, I mapped supplier costs with a stacked bar chart, euros layered against local currencies. The gold-green scheme highlighted savings opportunities, prompting immediate supplier renegotiations. Managers walked away not just informed, but empowered with exportable slides for their own sub-teams.
Educators Building Engaging Course Materials
In an MBA fintech class, I deployed the funnel diagram to walkthrough euro clearing processes. Students paused animations to debate bottlenecks, turning passive lectures into interactive forums. Post-class surveys showed 20% higher retention on currency mechanics - proof that visuals like these bridge theory and practice.
Founders Pitching to International Investors
A startup founder I coached used the scatter plot to align euro-denominated revenues with market growth vectors. The clean backgrounds kept focus on data points, not distractions, helping secure €2M in seed funding. It's these moments where the template's euro focus elevates a generic pitch to culturally attuned storytelling.
Industry-Spanning Use Cases for Broader Reach
Beyond core finance, this template adapts to diverse sectors where currency plays a role.
- Banking and Compliance Training: Outline anti-money laundering flows with process maps, euro symbols flagging high-risk zones for global teams.
- International Trade Logistics: Timeline diagrams sequence shipment valuations, accounting for exchange variances at each port.
- Economic Research Publications: Venn overlaps dissect policy impacts on euro stability, ideal for whitepapers turned slide decks.
- Corporate Treasury Management: Pyramid risks in cash flow planning, with color-coded alerts for threshold breaches.
- Investment Advisory Newsletters: Animated trends forecast euro trajectories, engaging subscribers in monthly updates.
- Supply Chain Analytics: Scatter correlations between fuel costs and euro rates, guiding procurement decisions.
In 2024's landscape of rising trade tensions and digital currency experiments, these applications keep presentations ahead of the curve, blending traditional euro mechanics with emerging global shifts.
Streamlining Your Presentation Workflow
Integration starts simple: Download the .key file, open in Keynote 2016 or later, and duplicate masters to build your deck. Link cells to external sheets for live updates - change a rate in Numbers, and watch diagrams refresh. For teams, enable real-time co-editing; comments flag revisions without cluttering slides.
Customization is intuitive: Drag to regroup elements, apply brand colors via the scheme overrides, and test animations in presenter view. Export options cover PDF for archives or video for social shares, ensuring versatility. In my routine, this means prepping a full client brief in hours, not days, with audit trails preserving every iteration.
Comparison: Elevating Beyond Default Keynote Tools
AspectEuro Exchange TemplateDefault Keynote ChartsFinancial ThemingEuro icons, ticker backgrounds, currency-specific motifs for instant contextGeneric placeholders; no built-in finance visualsDiagram Variety28 specialized options like rate trend lines and risk pyramidsBasic 10-15 types; requires manual customizationColor Adaptability7 pre-tuned schemes with easy overrides for brandsSingle palette per deck; time-intensive tweaksAnimation & InteractivityBuilt-in builds for dynamic flows, hyperlinks to data sourcesStandard transitions; limited forex simulationCollaboration FitOptimized for shared editing with version historyBasic sharing; no finance-tuned groupingScalabilityVector-based for print/digital at any resolutionScalable but lacks thematic consistencyThis side-by-side shows how the template bridges gaps in defaults, delivering pro-level polish without the design overhead.
"In a world where every decimal point counts, visuals that clarify without complicating are gold. This template has been my go-to for turning forex fog into focus."
- A finance consultant's routine reflection
Ready to refine your financial storytelling? Explore how this template can elevate your next session.
FAQs: Addressing Common Queries on Euro Exchange Keynote Template
Is this template compatible with older Keynote versions?
No, it's optimized for Keynote 2016 and later to leverage advanced animation and data-linking features. For earlier versions, consider upgrading for full functionality.
Can I customize diagrams for other currencies besides the euro?
Absolutely - swap symbols easily for USD, GBP, or others, making it versatile for multi-currency decks while retaining the core financial structure.
Does it support animations for live data demonstrations?
Yes, pre-built sequences animate trends and flows, simulating real-time shifts to engage audiences during market volatility discussions.
How does it handle team-based editing?
Perfectly suited for collaborative Keynote environments, with grouped elements and change tracking to streamline group refinements.
Are the files print-ready for handouts?
Yes, vector graphics ensure crisp output at any scale, ideal for conference materials or client binders.
What's included in the lifetime access?
One-time purchase grants unlimited edits and updates to your downloaded files, with no subscriptions - pure ownership for ongoing use.
Transform your finance presentations from functional to unforgettable. Secure this Euro Exchange Keynote Template today and watch your insights gain the currency they deserve.
Good for
- Project roadmaps and sprint plans
- Product launch timelines
- Quarterly or annual review decks
- Company history and milestone summaries
Licence
reviews
My currency analyst used the line graphs for historical rate trends to identify a post-Brexit volatility pattern.
The Venn diagrams for overlapping market influences helped a hedge fund manager make a strategic decision.
Used the pyramid structures for risk assessments in a corporate treasury presentation.
The neutral grays color scheme is conservative but the greens and golds one is better for a bullish market outlook.
Pretty solid template but the scatter plots for GDP vs exchange shifts were a bit too complex for a quick boardroom update.
FAQ
Will it work in Google Slides?
Are fonts embedded?
Can I use this for client work?
What's the refund policy?
Do you update the template after purchase?
Similar templates
See all Keynote templates →
All 1 slides