 Click to zoom
Equity Capital Dynamics PowerPoint Template and Charts
| Format | .pptx |
| Slides | 30 unique layouts |
| Aspect ratio | 130/73 |
| Compatibility | PowerPoint |
| Animated | No |
| Language | English |
| License | Commercial |
| File size | — |
| Version | v1.0 |
| Last updated | June 2026 |
What's inside
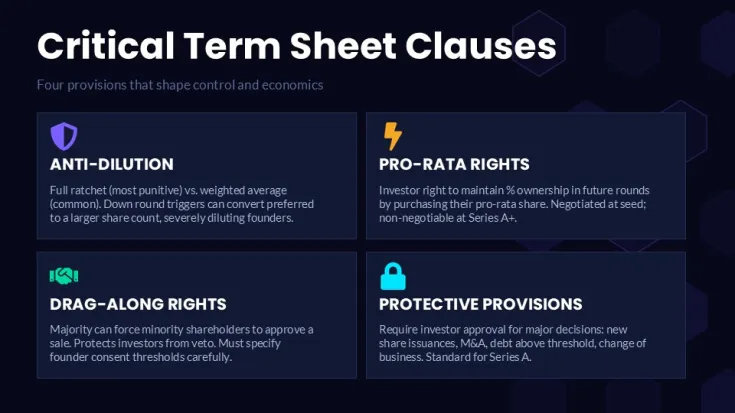
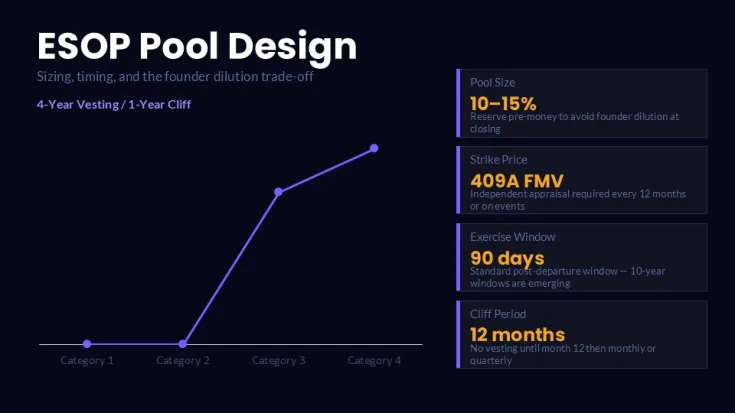
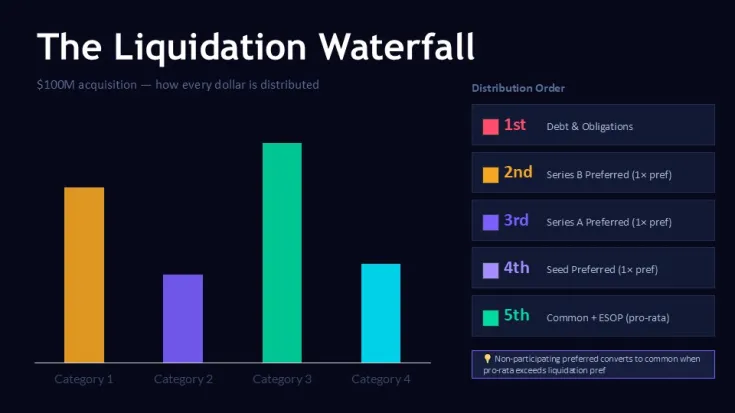
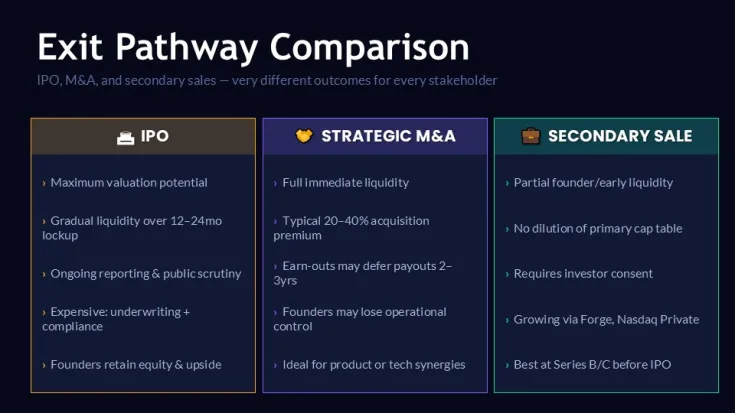
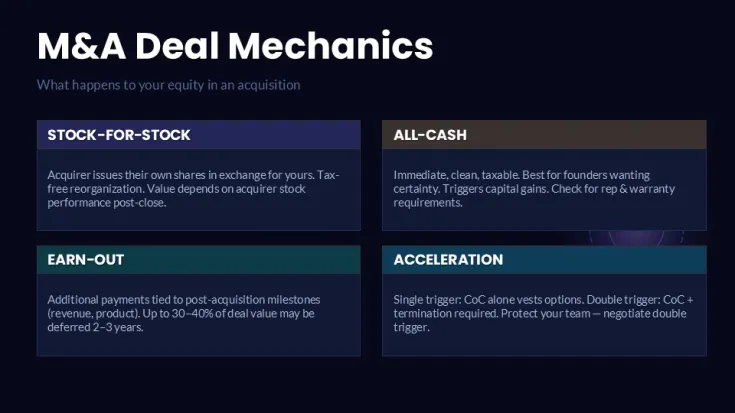
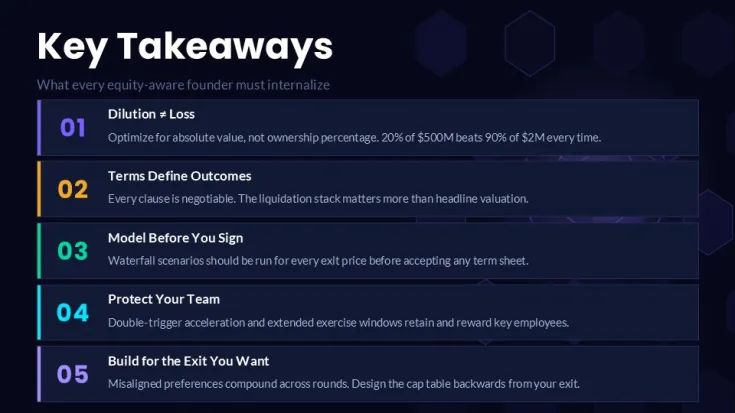
This PowerPoint chart template is built for finance professionals tracking equity capital movements, funding rounds, valuation changes, and investment performance. The 30-slide deck provides structured layouts where chart elements are grouped but independently editable. Resize a chart and the labels adjust proportionally; data series can be reordered without breaking the alignment. Color updates follow slide master assignments - change one accent and all charts using that master update consistently.
- Slide master controls chart colors - update once, refresh all
- Data labels maintain position when bar or line values are edited
- Legend entries reflow automatically when series are added or removed
- All vectors and icons remain fully editable; no rasterized elements
Frequently Asked Questions
Can I edit the chart data directly in PowerPoint? Yes. Each chart uses native PowerPoint charting. Right-click any chart and select Edit Data to modify values; the chart updates in real time.
Does the template work with Google Slides? The .pptx file imports into Google Slides, but some chart animations and font assignments may not transfer exactly as designed.
Are there restrictions on using this for client work? No. After purchase, the template can be used in both internal and client-facing presentations without additional licensing.
Good for
- Project roadmaps and sprint plans
- Product launch timelines
- Quarterly or annual review decks
- Company history and milestone summaries
Licence
reviews
No reviews yet. Be the first!
FAQ
Will it work in Google Slides?
Are fonts embedded?
Can I use this for client work?
What's the refund policy?
Do you update the template after purchase?
Similar templates
See all PowerPoint Charts →

All 30 slides