 Click to zoom
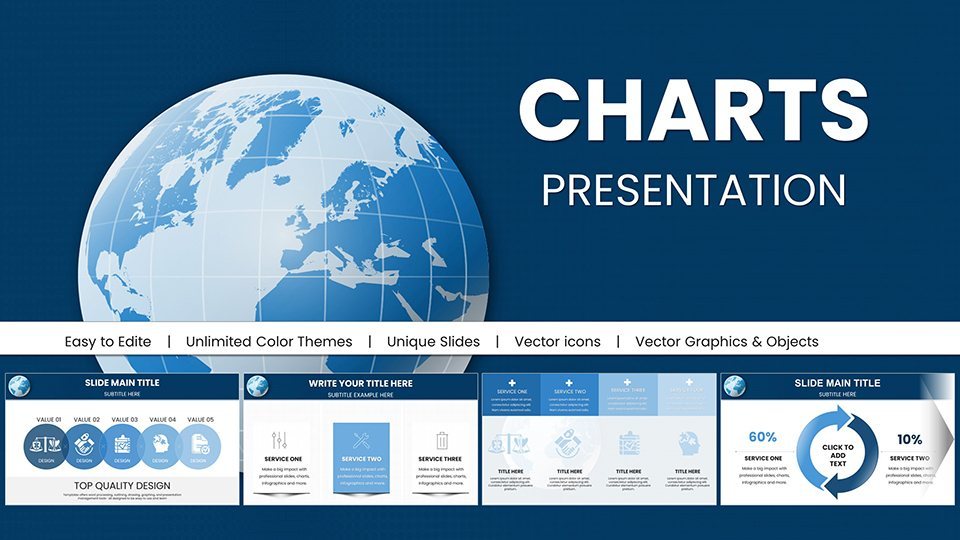
Education-Focused Keynote Charts Pack: Spark Learning with Visuals
| Format | .pptx |
| Slides | 58 unique layouts |
| Aspect ratio | 16:9 |
| Compatibility | PowerPoint |
| Animated | No |
| Language | English |
| License | Commercial |
| File size | — |
| Version | v1.0 |
| Last updated | August 2023 |
What's inside
In an era where attention spans compete with digital distractions, educators need tools that make concepts stick. Our Education-Focused Keynote Charts Pack provides 58 editable slides to visualize curricula creatively, turning lessons into adventures. Suited for teachers, trainers, and students, it draws from pedagogical best practices like Bloom's Taxonomy to foster deeper understanding through visuals.
Cross-compatible with PowerPoint and Google Slides, this pack streamlines prep, allowing focus on delivery. Whether diagramming history timelines or graphing science data, elevate education with designs that inspire curiosity.
Distinguishing Features for Classroom Magic
User-intuitive and adaptable, these charts offer diverse styles with easy tailoring.
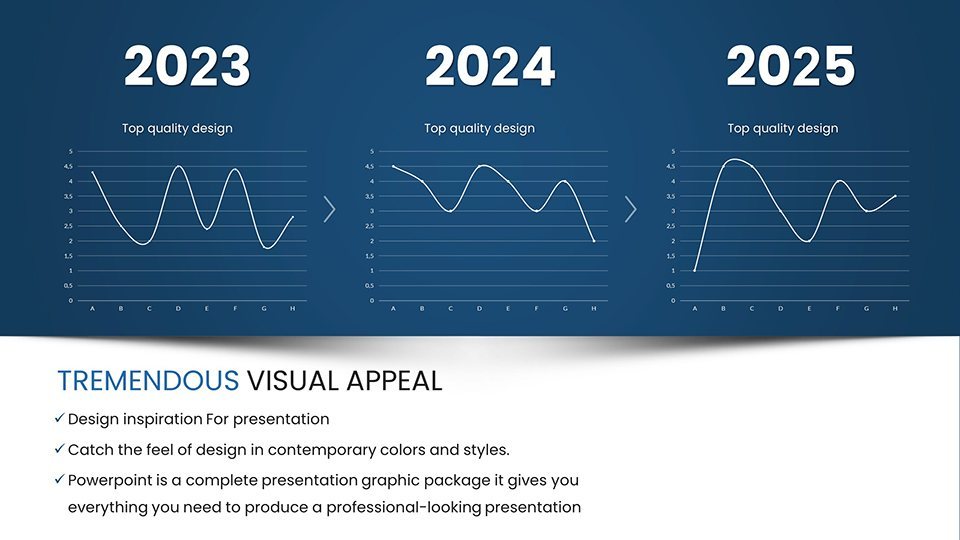
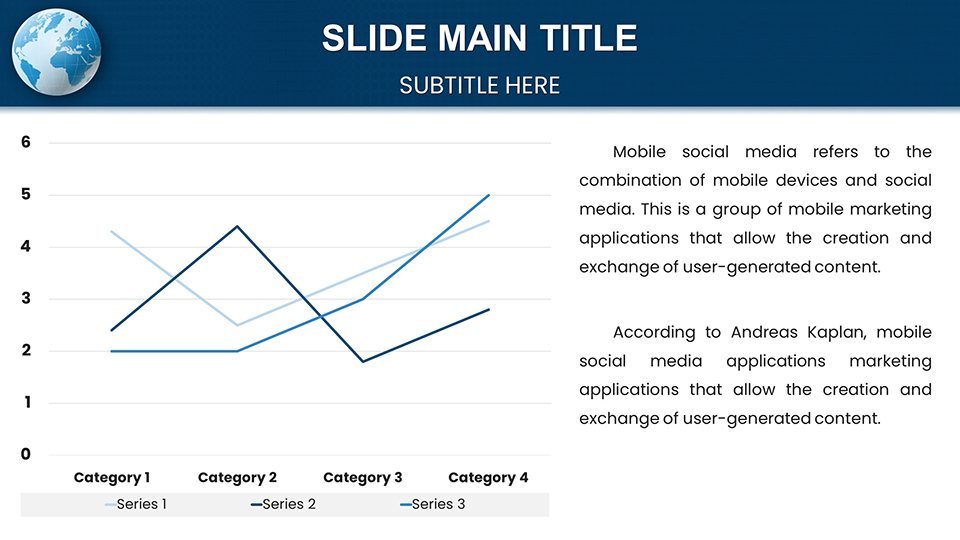
- Dynamic Graphs: Slide 8's line graphs track student progress, ideal for report cards.
- Infographics: Slide 16 creates concept maps for subjects like biology ecosystems.
- Timelines: Slide 25 sequences historical events with interactive milestones.
- Venn Diagrams: Slide 33 compares literature themes, encouraging critical thinking.
- Flowcharts: Slide 42 outlines processes, like math algorithms.
Animations build knowledge layer by layer (slide 50), while responsive designs ensure clarity on any screen.
Benefits and Educational Applications
Research from the Journal of Educational Psychology shows visuals improve recall by 20%. Teachers can customize for flipped classrooms, as in Khan Academy-style modules. Students crafting projects gain skills; think a chart on climate change impacts, mirroring IPCC reports.
Trainers in corporate settings adapt for workshops, visualizing KPIs. Integration tips: Sync with tools like Kahoot for quizzes. Use high-contrast for inclusivity, per ADA guidelines. Sidestep overload by limiting to 5 elements per slide.
Step-by-Step Classroom Integration
- Topic Selection: Choose charts aligning with objectives.
- Data Customization: Input class-specific info.
- Enhance Interactivity: Add hyperlinks to resources.
- Test Engagement: Pilot with small groups.
- Assess and Adapt: Refine based on feedback.
Outperforms basics with education-tuned aesthetics, unlike generic packs.
Edge Over Competitors
Free tools lack depth; this offers pro features without subscriptions. In e-learning, it enhances platforms like Moodle.
LSI: Learning infographics, classroom diagrams, educational visuals. Alts: "Interactive timeline chart for history lessons in Keynote."
Unleash teaching potential – download and ignite minds today.
Frequently Asked Questions
How user-friendly for beginners?Very, with intuitive drag-and-drop editing.Cross-device compatibility?Yes, adapts to tablets and projectors.Suitable for online classes?Perfect, with shareable formats.Customization limits?None – full control over elements.Alignment with standards?Supports Common Core and similar.Group editing possible?Yes, via cloud exports.Good for
- Project roadmaps and sprint plans
- Product launch timelines
- Quarterly or annual review decks
- Company history and milestone summaries
Licence
reviews
This template supported my nonprofit?s annual impact report perfectly. The charts communicated our results clearly to donors and board members.
Clean structure and harmonious color combinations make the data approachable rather than intimidating. Good attention to detail in layout spacing.
Strong on most chart types but the gauge charts felt less flexible than others. Still managed to adapt them successfully.
The editing process was intuitive and I only spent a short time learning the master slides.
FAQ
Will it work in Google Slides?
Are fonts embedded?
Can I use this for client work?
What's the refund policy?
Do you update the template after purchase?
Similar templates
See all Keynote Charts →
All 58 slides