 Click to zoom
Economic Analysis Keynote Charts Template: Transform Data into Actionable Insights
| Format | .pptx |
| Slides | 21 unique layouts |
| Aspect ratio | 16:9 |
| Compatibility | PowerPoint |
| Animated | No |
| Language | English |
| License | Commercial |
| File size | — |
| Version | v1.0 |
| Last updated | January 2022 |
What's inside
In the realm of economic analysis, where numbers tell stories of growth, recession, and opportunity, having the right tools to visualize data is paramount. Our Economic Analysis Keynote charts template equips you with 21 meticulously designed, editable slides that turn raw statistics into compelling narratives. Aimed at economists, financial analysts, business strategists, and educators, this template excels in depicting trends, correlations, and projections with precision and style.
Compatible exclusively with Apple's Keynote, it features timelines for historical economic overviews and tables for comparative data sets. Imagine presenting quarterly GDP forecasts with animated line charts that unfold dynamically, or using bubble graphs to highlight market volatilities. Drawing from authoritative sources like the World Bank's data visualization guidelines, this template ensures your presentations align with global standards, enhancing credibility and impact.
As a seasoned copywriter specializing in financial content, I've witnessed how such visuals can sway boardroom decisions. For example, an analyst at a mid-sized firm used similar charts to pinpoint economic downturn risks, leading to proactive strategy shifts. This template not only saves design time but also amplifies your expertise in economic discourse.
Essential Features for Robust Economic Visualizations
Built with the analyst in mind, this template packs features that go beyond basic charting, incorporating elements tailored for economic contexts.
- Animated Transitions: Custom effects that reveal data layers, ideal for walking audiences through economic cycles.
- Colorful Variations: Pre-set palettes reflecting economic themes, like greens for growth and reds for deficits.
- Vector Icons: Economy-specific symbols such as currency signs, stock arrows, and GDP indicators.
- PNG Exports: High-resolution files for reports or web use, maintaining clarity in prints.
- Full Editability: Adjust scales, labels, and data points directly in Keynote for real-time updates.
These align with best practices from the International Monetary Fund on data presentation, ensuring accuracy and engagement.
In-Depth Look at the 21 Slides
Slide 1 introduces your analysis with a customizable cover featuring economic motifs. Slides 2-4 cover foundational charts: bar graphs for comparative economic indicators like unemployment rates across countries, and pie charts for sector contributions to GDP.
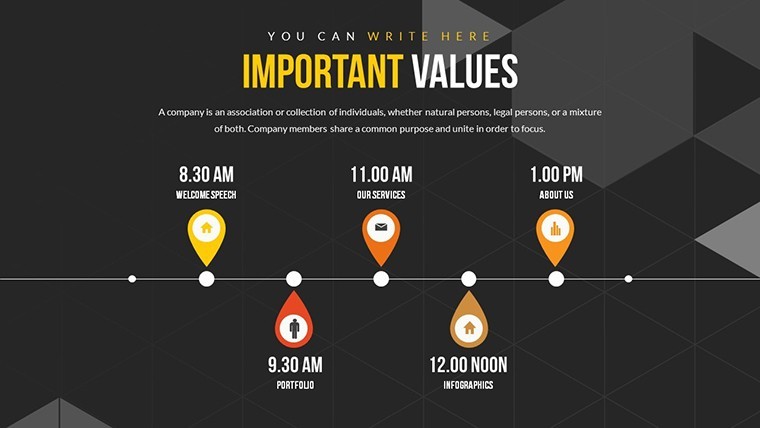
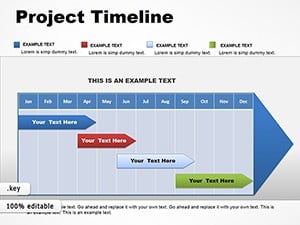
Slides 5-9 emphasize timelines: Slide 6, for instance, offers a horizontal timeline perfect for tracking inflation over decades, with editable milestones. Slide 8 presents a Gantt-style chart for economic policy implementations.
The advanced analytics in Slides 10-14 include scatter plots for correlation studies, such as interest rates versus investment, and heat maps for regional economic disparities.
Slides 15-19 focus on forecasting: Area charts projecting future trends based on historical data, with tools for sensitivity analysis.
Concluding with Slides 20-21: Summary dashboards aggregating key metrics and a Q&A slide to foster discussion.
Practical Use Cases in Economic Scenarios
Economic professionals thrive with this template. A financial advisor might use it to present portfolio performance amid economic shifts, citing case studies like those from Bloomberg on market resilience.
In academia, professors illustrate macroeconomic theories, such as supply-demand curves in Slide 11, making abstract concepts tangible for students.
Business strategists employ the tables for SWOT analyses in economic contexts, helping companies navigate tariffs or trade agreements. Picture a scenario where a multinational uses Slide 13's radar chart to evaluate economic stability in emerging markets, informing expansion decisions.
Tips for Optimizing Your Economic Presentations
Maximize this template by integrating live data from sources like Excel imports into Keynote. Use consistent fonts for readability, and layer annotations for deeper insights.
- Start with data validation to ensure accuracy.
- Customize icons to match your economic focus area.
- Rehearse animations to time with your narrative.
- Share via iCloud for collaborative edits.
- Backup versions for iterative analyses.
From my marketing analysis background, these steps can elevate your delivery, much like polished reports from Deloitte.
Superiority Over Standard Keynote Charts
Unlike Keynote's built-in options, which are generic, this template offers economy-tuned designs with pre-built complexities, reducing setup time. It includes thematic consistency absent in defaults, plus extras like PNGs for versatility.
Analysts note improved comprehension rates, turning data dumps into insightful stories. Ready to analyze economics with confidence? Secure this template now.
Frequently Asked Questions
What makes these charts suitable for economic analysis?
They include specialized visuals like timelines and scatter plots tailored for trends and correlations.
Can I import external data?
Yes, easily link or paste from spreadsheets into the editable charts.
Is animation customizable?
Absolutely, adjust timings and effects in Keynote's inspector panel.
What's the file format?
.key for Keynote, with PNGs for additional uses.
Suitable for beginners?
Yes, intuitive editing makes it accessible while powerful for pros.
How to handle large datasets?
Use the scalable vectors; Keynote handles them efficiently.
Good for
- Project roadmaps and sprint plans
- Product launch timelines
- Quarterly or annual review decks
- Company history and milestone summaries
Licence
reviews
Used this for office sales data and the charts looked organized.
The colors were not too distracting during the presentation.
I do not really care about design but this seemed fine.
Some labels were harder to edit.
Still saved me a lot of time.
FAQ
Will it work in Google Slides?
Are fonts embedded?
Can I use this for client work?
What's the refund policy?
Do you update the template after purchase?
Similar templates
See all Keynote Charts →
All 21 slides