 Click to zoom
Download Online Education Charts Template for Keynote Presentations
| Format | .pptx |
| Slides | 34 unique layouts |
| Aspect ratio | 16:9 |
| Compatibility | PowerPoint |
| Animated | No |
| Language | English |
| License | Commercial |
| File size | — |
| Version | v1.0 |
| Last updated | May 2025 |
What's inside
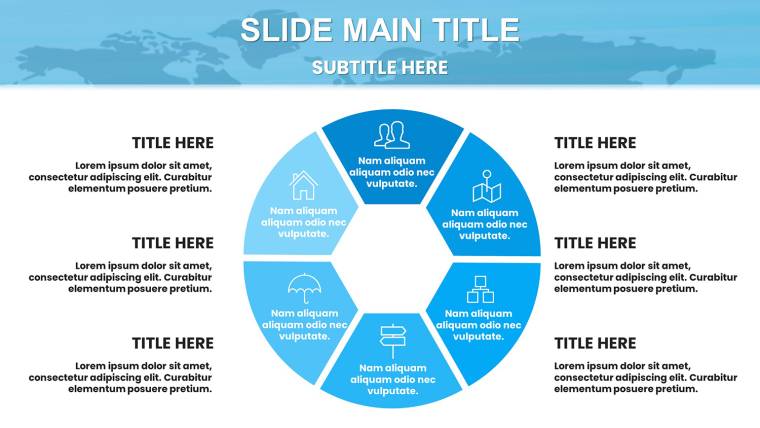
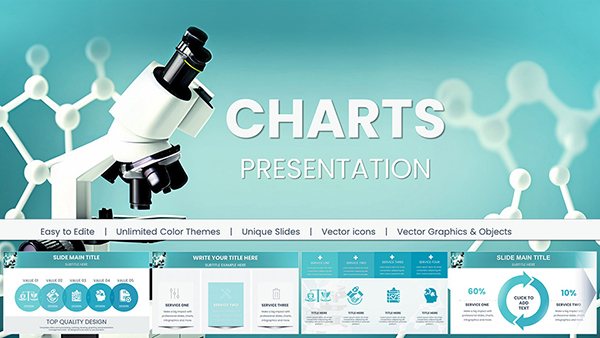
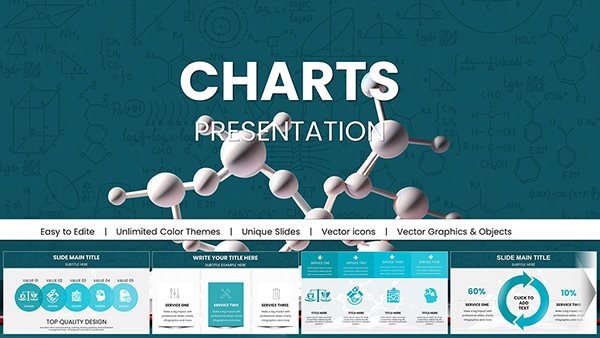
In today`s digital learning landscape, where remote education has become the norm, educators and EdTech innovators face the challenge of making data-driven decisions while keeping audiences engaged. Picture this: instead of sifting through spreadsheets during a webinar, you unveil sleek, interactive charts that spotlight student progress and learning trends. Our Online Education Charts Keynote Template delivers exactly that with 34 fully editable slides, crafted for teachers, trainers, and e-learning developers. Tailored for virtual classrooms, corporate training sessions, and EdTech pitches, it seamlessly integrates with Apple Keynote, offering intuitive designs that echo modern platforms like Moodle or Canvas. Drawing from educational best practices, such as those outlined by the International Society for Technology in Education (ISTE), this template helps you present KPIs, engagement metrics, and curriculum overviews with clarity and impact. Users love how it cuts down on design time, allowing focus on pedagogy rather than pixels - ideal for transforming hybrid learning experiences into dynamic, insightful sessions that resonate with stakeholders from K-12 to higher ed.
Revolutionize Your E-Learning Visuals
Educational data visualization goes beyond pretty pictures; it`s about fostering understanding and driving improvements. This template excels by providing specialized analytics charts that map out everything from dropout rates to quiz performance, all in a user-friendly format. For example, an online instructor at a platform like Coursera could use a customizable bar chart to compare enrollment trends across courses, making data accessible for non-tech-savvy administrators. The modern, sleek aesthetic ensures your slides pop on screens, with responsive elements that adapt to various devices, enhancing accessibility in diverse learning environments.
Standout Features for Digital Educators
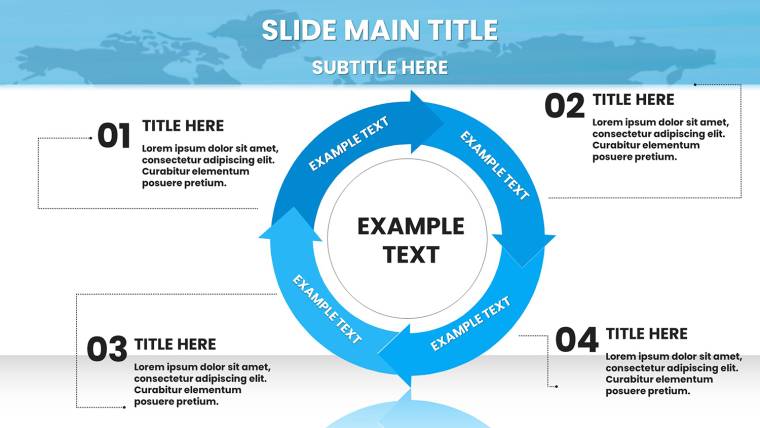
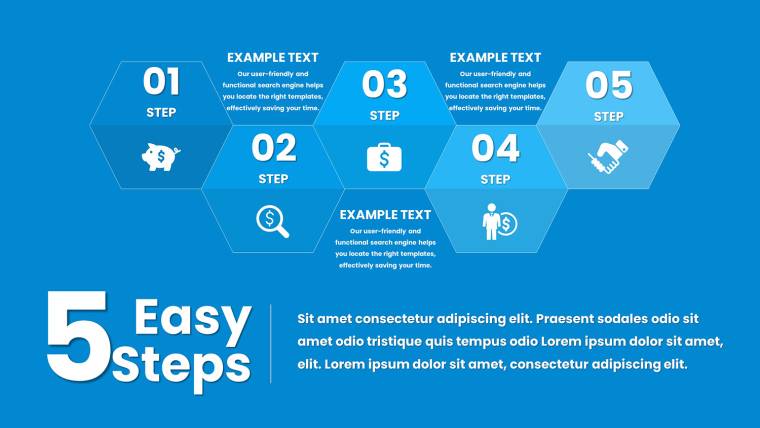
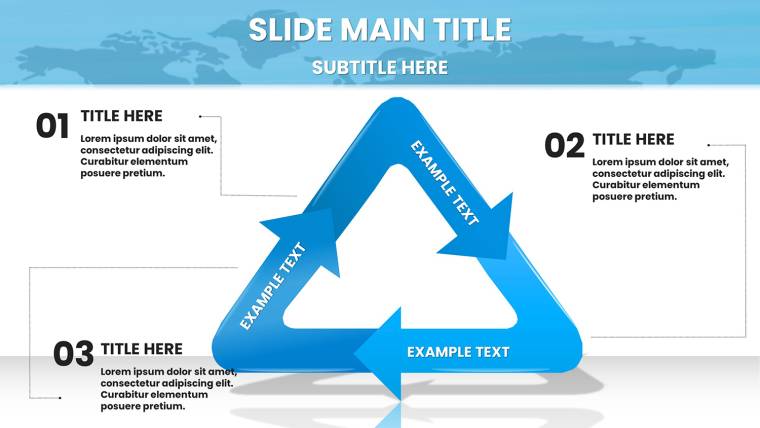
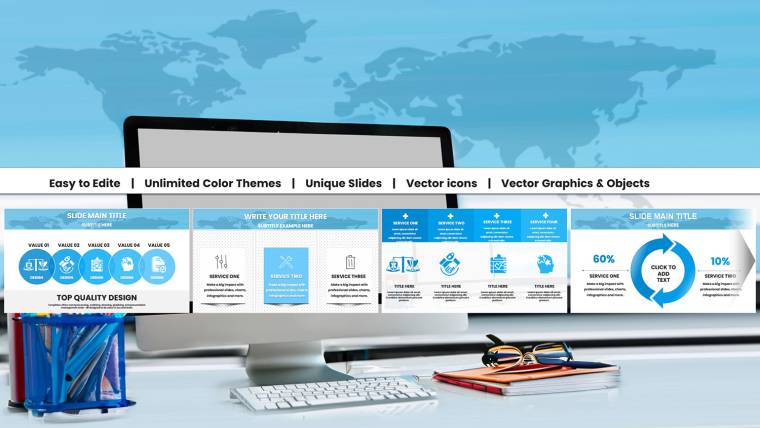
- Diverse Slide Collection: 34 slides ranging from dashboard overviews to detailed infographics; Slide 5, for instance, offers a timeline for course milestones, perfect for syllabus planning.
- Complete Customizability: Tweak every aspect - fonts, colors, data sets - to align with your branding or lesson themes, ensuring a personalized touch.
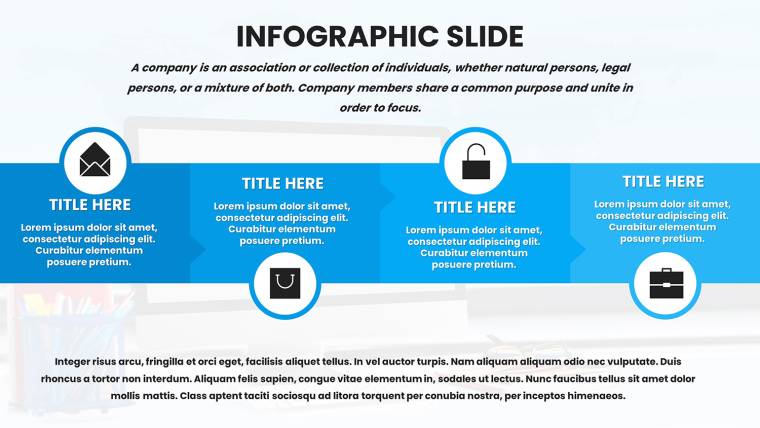
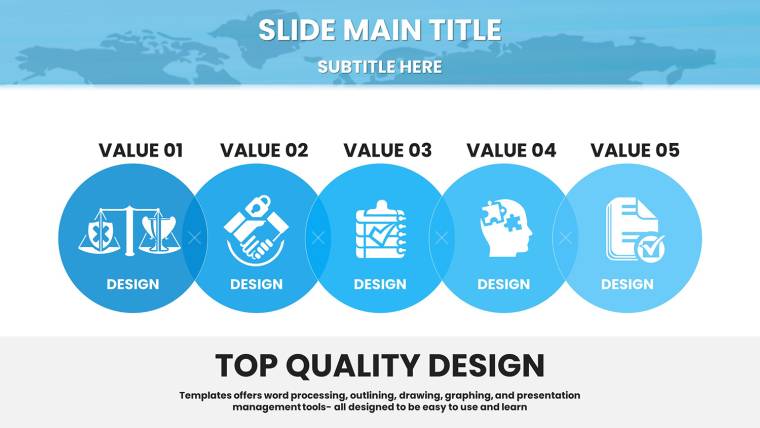
- Engaging Infographics: Incorporate icons like virtual blackboards or digital badges to make abstract concepts tangible, boosting learner retention.
- Keynote-Optimized Design: Built for the latest Keynote, with quick-edit placeholders that integrate seamlessly with tools like Google Forms for real-time data pulls.
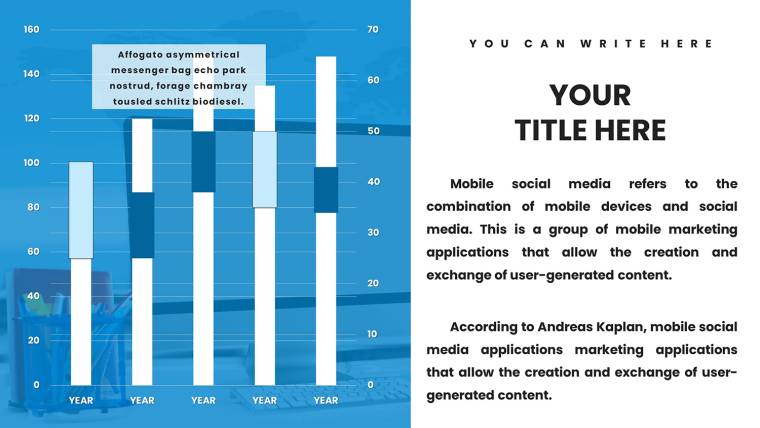
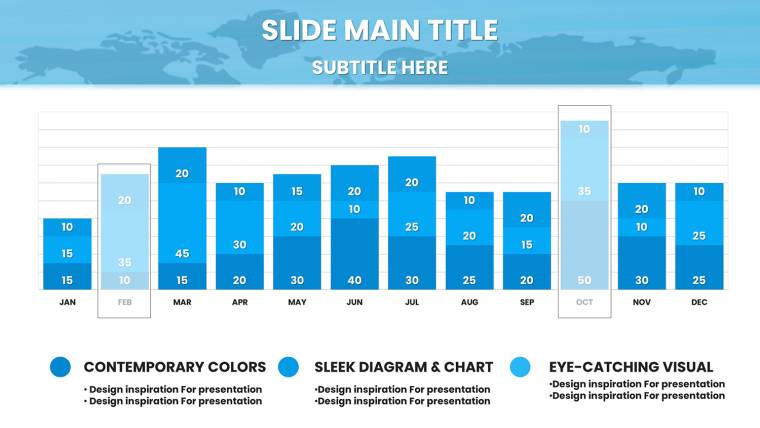
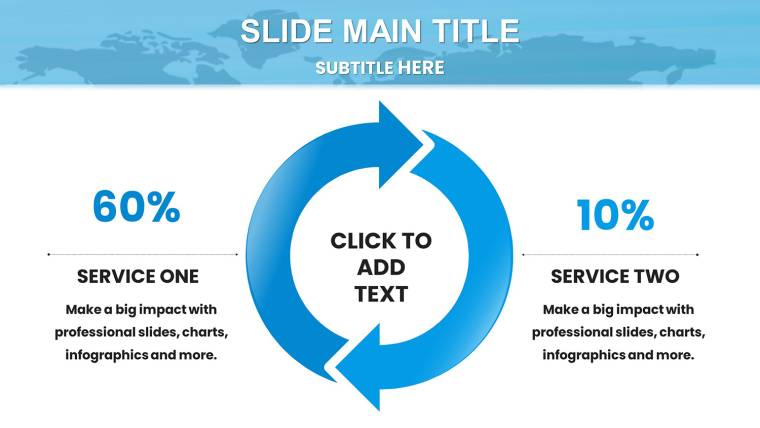
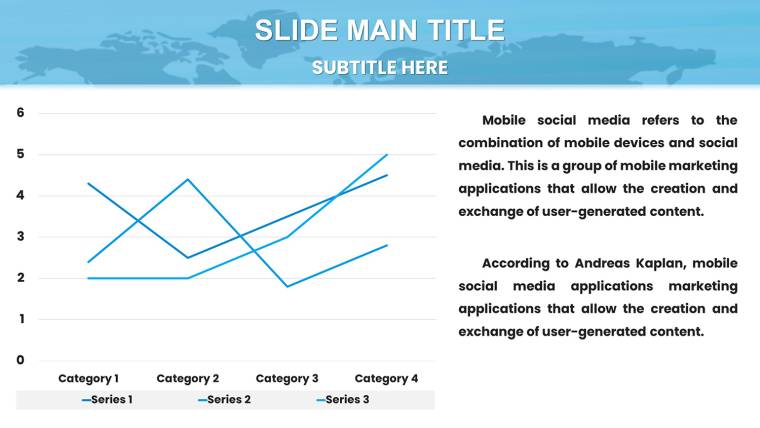
- Analytics-Focused Charts: Specialized for education metrics, including pie charts for demographic breakdowns or line graphs for progress tracking over semesters.
These features not only streamline your workflow but also adhere to UX principles, making presentations intuitive for both presenters and viewers.
Practical Use Cases in Online Education
Dive into scenarios where this template thrives. In K-12 virtual schools, teachers might employ Slide 10`s radar chart to assess student skills across subjects, informing personalized learning plans as recommended by ISTE standards. For EdTech startups, a pitch to venture capitalists could feature funnel charts on Slide 18, illustrating user acquisition funnels from sign-up to completion, backed by real metrics from successful platforms like Khan Academy. Corporate trainers in remote workshops can use area charts to evaluate training ROI, presenting before-and-after data that justifies program expansions. Even in higher education, deans could leverage the template for annual reports, with stacked bars showing faculty performance - drawing from case studies in journals like Educational Technology Research and Development. Integrating it into your routine is simple: sync with LMS data exports, customize, and present, turning routine updates into compelling stories that inspire action.
Workflow Tips for Seamless Integration
- Import Your Data: Start by pulling metrics from your LMS into Keynote`s chart editor for instant visualization.
- Theme Alignment: Match colors to your school`s palette or add animations for emphasis during live sessions.
- Collaborate and Iterate: Share via iCloud for team feedback, refining slides based on peer input.
- Deliver with Confidence: Use rehearsal mode to time transitions, ensuring smooth flow in webinars.
- Analyze Feedback: Post-presentation, gather insights to evolve future uses, enhancing teaching efficacy.
This methodical approach mirrors agile methodologies in education tech, promoting continuous improvement.
What Makes This Template Essential for EdTech
In a crowded market of presentation tools, this one distinguishes itself through education-specific tailoring. Unlike generic Keynote starters, it includes pre-built templates for common e-learning needs, such as gamification metrics or hybrid model comparisons, saving educators precious time. Feedback from users highlights its role in increasing engagement - one trainer noted a 40% uptick in participant interaction during virtual sessions. The retina-ready graphics ensure crisp displays on any screen, while vector elements allow infinite scaling for printed materials like course handbooks. For those in professional development, it supports integration with assessment tools, fostering data-informed strategies that align with global standards like UNESCO`s digital education guidelines.
Enhance your authority by citing real-world successes, such as how similar visuals aided in securing grants for online programs, underscoring the template`s value in competitive fields.
Transform Your Teaching Toolkit Today
Don`t let outdated slides hold back your e-learning potential. Secure this Online Education Charts Keynote Template now and craft presentations that educate and excite.
Frequently Asked Questions
How customizable are the education charts?Fully customizable - edit data, styles, and layouts effortlessly in Keynote to fit your specific needs.Does it work with all Keynote devices?Yes, compatible with macOS, iOS, and iPadOS versions of Keynote for versatile use.Is it suitable for corporate training?Definitely, with charts ideal for employee development metrics and virtual workshops.What formats are included?A .key file optimized for Keynote, ready for immediate download and use.Can I add my own data sources?Absolutely, integrate from spreadsheets or LMS exports for real-time accuracy.Are animations built-in?Yes, subtle animations enhance engagement without overwhelming the content.Good for
- Project roadmaps and sprint plans
- Product launch timelines
- Quarterly or annual review decks
- Company history and milestone summaries
Licence
reviews
Online education charts with radar skills assessments and funnel user acquisition perfect for my EdTech pitch. Modern sleek design pops on webinars. Timeline course milestones intuitive. Cut prep time hugely.
As a K-12 virtual teacher, pie demographic breakdowns and progress line graphs engaged parents. Icons like digital badges nice touch. Responsive on different devices. Practical.
Corporate trainer: area charts for ROI before/after data visualized training impact well. Customizable to brand. Animations subtle. Good for hybrid sessions. One slide felt basic but editable.
Higher ed admin: stacked bars for faculty metrics in annual report looked pro. LMS data import seamless. Clean analytics focus. Slightly education-specific but adaptable.
The dashboard overviews consolidated engagement metrics nicely for stakeholders. ISTE-aligned feel. Quick placeholders. Deadline-friendly. Recommended for e-learning pros.
Student advisor using for program review - infographics made abstract KPIs tangible. High-res and vector scalable. Versatile layouts. Minor color scheme tweak needed but great base.]
FAQ
Will it work in Google Slides?
Are fonts embedded?
Can I use this for client work?
What's the refund policy?
Do you update the template after purchase?
Similar templates
See all Keynote Charts →
All 34 slides