 Click to zoom
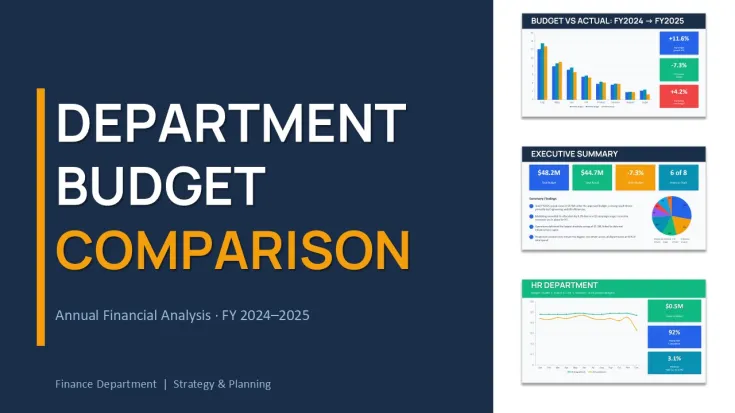
Department Budget Comparison PowerPoint Template 2026 - 30 Editable Slides
| Format | .pptx |
| Slides | 30 unique layouts |
| Aspect ratio | 130/73 |
| Compatibility | PowerPoint |
| Animated | No |
| Language | English |
| License | Commercial |
| File size | — |
| Version | v1.0 |
| Last updated | May 2026 |
What's inside
How to Compare Multiple Department Budgets in One Annual Review Slide
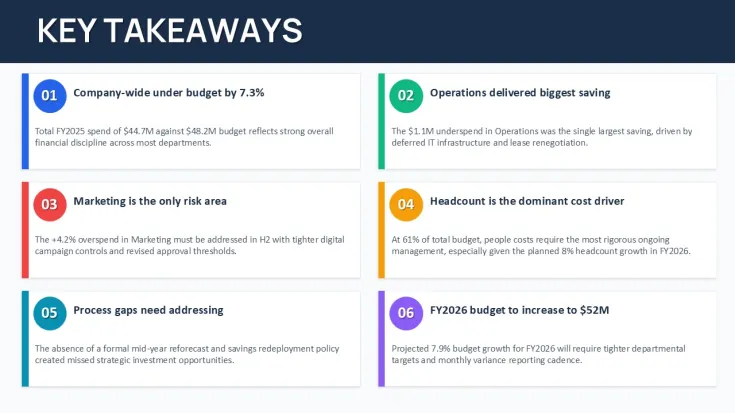
The interesting part about this department budget comparison PowerPoint template is how the layouts manage to show five or six departments at once without turning into visual noise.
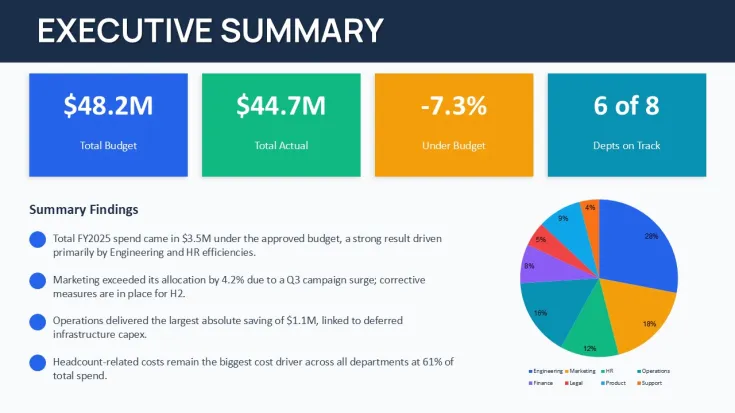
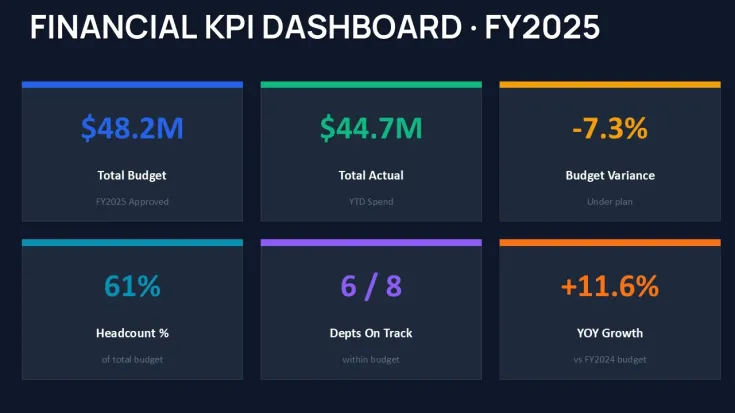
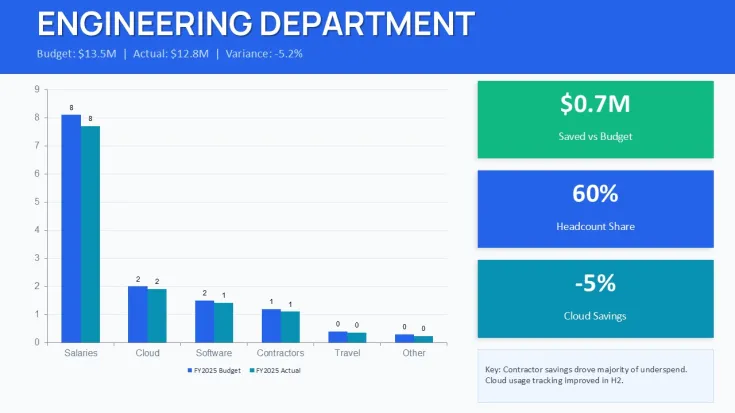
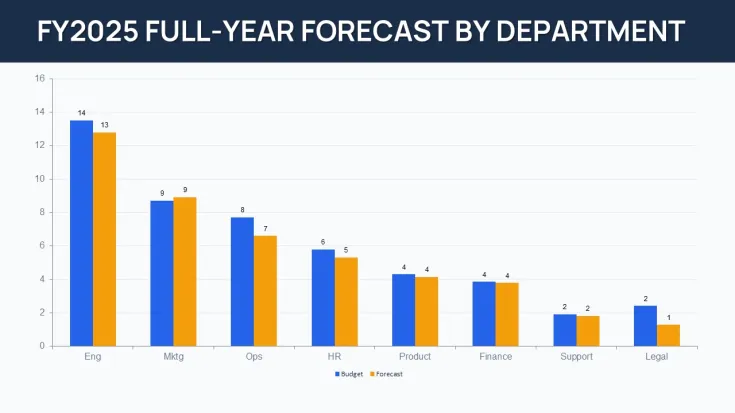
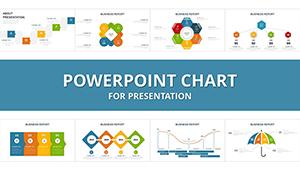
It packs 30 slides covering annual financial analysis charts - stacked bars, variance waterfalls, grouped columns, and summary dashboards. The thing about these layouts is they make the relationships between departments visible at a glance.
When I opened templates from this collection for a client quarterly review, I noticed the column alignment holds surprisingly well even after heavy data swaps. In practice the negative variance bars render in a way that draws attention without looking alarming.
But this approach isn`t perfect for every case. If your departments have wildly different structures or you track 15+ KPIs per unit, you`ll probably need extra custom work.
Why the side-by-side layout works better than expected
You know that moment when the deck is due at 9am and the summary slide still looks messy - this template handles that pressure point. The master theme makes color switching straightforward once you spot the pattern. And the aspect ratio stays 16:9 by default.
What beats starting from scratch is that someone already solved the spacing, label placement, and how bars behave when resized. You just drop in your numbers.
These annual financial analysis charts sit nicely between pure dashboards (too dense for presentations) and simple tables (not visual enough for executives).
Oh, and the data labels remain readable after resizing groups.
FeatureDetailsSlides / diagrams30 editable slides including stacked comparison bars, variance waterfalls, departmental breakdowns and KPI summary layoutsFile format.pptx - native PowerPoint formatSoftware versionPowerPoint 2016+ and Microsoft 365Color schemesMultiple themes; change once in Slide Master and colors update across all chartsEditable elementsBars, labels, connectors resize and recolor independently while preserving alignmentAspect ratio16:9 by defaultFree vs PaidPaid includes full 30 slides with complete editing rights; free shows limited preview slidesBest used forDepartment budget comparison PowerPoint template during annual financial analysis and executive budget meetingsHow do I change colors via the slide master in this department budget comparison PowerPoint template?So basically open View > Slide Master. Edit the main color palette at the top and it flows through the entire deck. Honestly the first time it feels like a lot but the logic is clear after one try. From experience this is the fastest way to adapt these annual financial analysis charts to your branding.
Can I use this template for client work?Yes, standard license permits use in client projects and presentations. Just don`t resell or redistribute the original .pptx files. Works as-is.
What are the differences between free and paid versions?Paid version unlocks all 30 slides with full layouts for department budget comparison. Free previews usually contain only 4–6 sample slides. The paid set is ready for immediate use.
When department heads push back on the consolidated numbers during budget meetingsWhen department heads push back on the consolidated numbers during budget meetings this layout helps because you can quickly clone a variance slide and add their counter-points as callouts. In most cases the structure holds, though you may need one extra row for unusual metrics.
Is this compatible with PowerPoint 365 and older versions?Fully compatible with PowerPoint 2016 through the latest Microsoft 365. Core charts and layouts work without issues. Some newer animations might need small tweaks on very old versions.
Good for
- Project roadmaps and sprint plans
- Product launch timelines
- Quarterly or annual review decks
- Company history and milestone summaries
Licence
reviews
The grouped column chart for department spending is much cleaner than what I usually hack together.
I used the variance waterfall to show HR why their budget request was too high.
The stacked comparison bars are easy to read even with 6 departments side by side.
The summary dashboard layout is a bit cluttered but you can delete the elements you dont need.
Its a great time saver for annual budget meetings.
FAQ
Will it work in Google Slides?
Are fonts embedded?
Can I use this for client work?
What's the refund policy?
Do you update the template after purchase?
Similar templates
See all PowerPoint Charts →
All 30 slides