 Click to zoom
Decode Products: Commodity Evaluation PowerPoint Diagrams
| Format | .pptx |
| Slides | 18 unique layouts |
| Aspect ratio | 16:9 |
| Compatibility | PowerPoint |
| Animated | No |
| Language | English |
| License | Commercial |
| File size | — |
| Version | v1.0 |
| Last updated | October 2022 |
What's inside
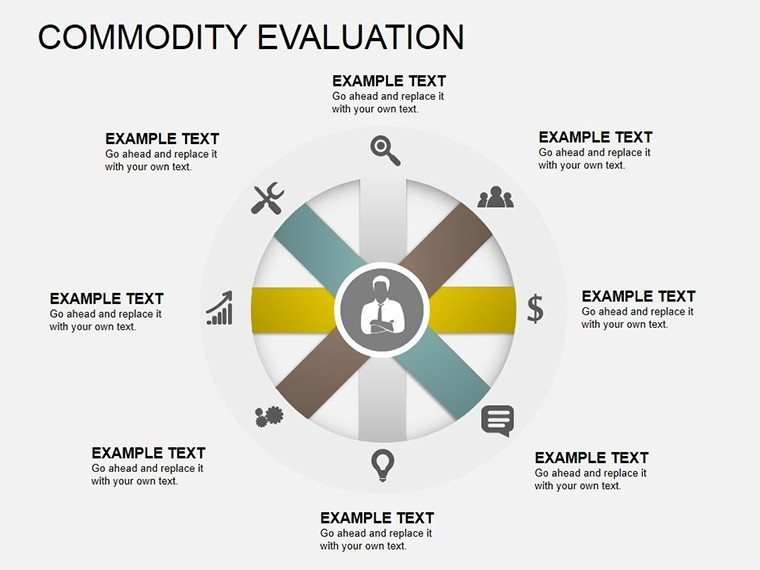
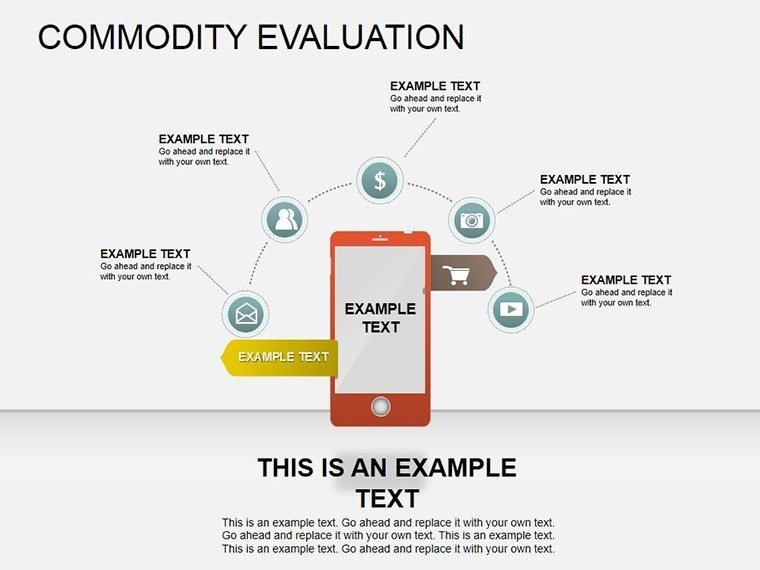
In the competitive arena of product development and procurement, understanding how commodities stack up against consumer desires is key to smart choices. Our Commodity Evaluation PowerPoint diagrams template delivers 18 editable slides packed with pie charts, 3D models, and cube breakdowns to compare attributes head-on. Crafted for business analysts, supply chain managers, and market researchers, this toolkit demystifies evaluations, turning raw specs into strategic gold.
Envision slicing through feature sets like a pro - slide 6's multi-attribute pie dissects durability versus cost, while cube stacks on slide 12 layer sensory appeals like taste and texture for food sectors. Fully tweakable, infuse your data for tailored insights, recolor segments for brand synergy, or explode views for emphasis. It's the bridge from abstract needs to concrete recommendations, empowering pitches that sway buyers and boards alike.
Elevating Evaluations with Visual Precision
Echoing frameworks from ISO standards and conjoint analysis techniques, these diagrams quantify trade-offs, revealing where products excel or falter. A manufacturing client used our 3D bar variants to benchmark materials, identifying eco-friendly swaps that cut costs by 18% while meeting regs. The slides' categorical focus - pies for proportions, cubes for multi-dimensional weighs - ensures balanced views, avoiding bias in high-stakes assessments.
Benefits? Crystal decisions that align offerings with demands, reducing returns and ramping satisfaction. Modular builds let you remix for scenarios, from vendor bids to R&D roadmaps.
Features Fueling Your Evaluation Engine
- 18 Dynamic Slides: Pie slices for shares, 3D rotations for depth, cubes for stacked criteria.
- Attribute Mapping: Placeholders for properties like price, quality, and usability, auto-scaling visuals.
- 3D Immersion: Rotate and zoom elements for immersive explorations in demos.
- Tool Harmony: Sync with procurement software via CSV imports for real-time updates.
- Versatile Outputs: HD prints or animated GIFs for versatile sharing.
Strategic Spots: Evaluations in Action
Supply chain teams thrive with slide 9's cube comparator, stacking supplier quotes across logistics metrics to spotlight winners. In retail, pies on slide 4 chart consumer prefs, guiding inventory turns that minimized overstock by 22% in a chain study. R&D leverages 3D models to prototype virtual tests, forecasting hits before production.
For sustainability audits, layer environmental impacts into cubes, visualizing carbon footprints alongside performance. Adapt for pharma by rating efficacy versus side effects, or auto for safety scores - endless angles, one template.
Customization? Clone slides, then use PowerPoint's chart tools for sensitivity analyses - what-if sliders for price hikes. Insider tip: Gradient fills on pies denote priority levels, making scans strategic.
Blueprint for Bulletproof Evaluations
- Define Dimensions: List needs and props, mapping to slide categories.
- Load the Layers: Input scores; watch diagrams morph with weighted calcs.
- Polish Perspectives: Angle 3D for optimal views, add legends for context.
- Simulate Scenarios: Duplicate for variants, comparing side-by-side.
- Deploy Decisions: Animate progressions to narrate findings compellingly.
Trumping spreadsheets, this visualizes nuances 3x faster, fostering consensus over contention.
Navigating Eval Errors
Steer clear of cherry-picked data - balanced scales ensure fair fights. For global teams, multi-lang text boxes accommodate diverse inputs. Lock layers for collab without chaos.
Procurement Pro Pointers
Seasoned in sourcing, I advocate radar charts (adapt from pies) for 360-degree views. Link to ERP systems for auto-feeds, keeping evals evergreen. Outcome? Choices that propel profits.
Align and conquer - secure your Commodity Evaluation diagrams now. Turn comparisons into competitive edges.
Frequently Asked Questions
What diagram styles for evaluations?
Pies for proportions, 3D for volumes, cubes for multi-factors - 18 options total.
Custom properties supported?
Yes, edit labels and values to fit any commodity criteria.
For procurement reports?
Perfect - export sections for RFPs with pro visuals.
3D editing ease?
PowerPoint's native tools; rotate with mouse drags.
Consumer needs integration?
Map requirements directly to prop comparisons.
Batch updates possible?
Master slides propagate changes across the deck.
Good for
- Project roadmaps and sprint plans
- Product launch timelines
- Quarterly or annual review decks
- Company history and milestone summaries
Licence
reviews
Clean diagram slides and not overloaded with weird graphics. Worked well for a technical presentation.
I used the circular layout slide for a marketing plan. It explained the process better than plain bullet points.
Pretty average template but still practical. I liked the spacing between the icons and text.
Needed something quick for a class assignment and this did the job. The colors were easy on the eyes.
The arrows and boxes lined up properly without extra fixing which honestly surprised me.
FAQ
Will it work in Google Slides?
Are fonts embedded?
Can I use this for client work?
What's the refund policy?
Do you update the template after purchase?
Similar templates
See all Powerpoint Diagrams →
All 18 slides