 Click to zoom
Customizable Middle East PowerPoint Maps: Precision for Global Insights
| Format | .pptx |
| Slides | 38 unique layouts |
| Aspect ratio | 16:9 |
| Compatibility | PowerPoint |
| Animated | No |
| Language | English |
| License | Commercial |
| File size | — |
| Version | v1.0 |
| Last updated | May 2024 |
What's inside
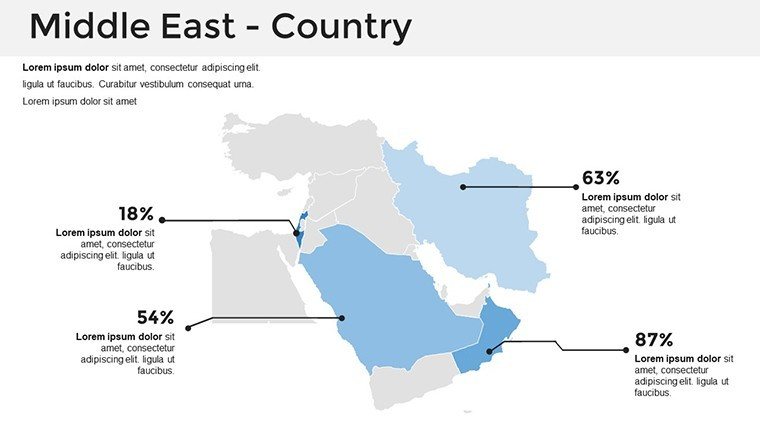
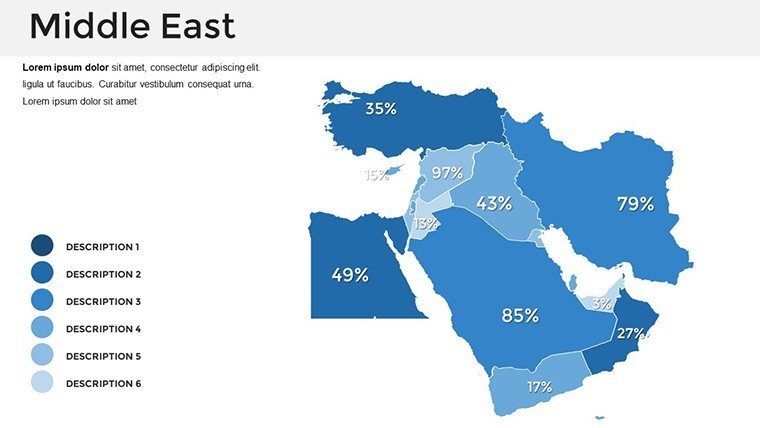
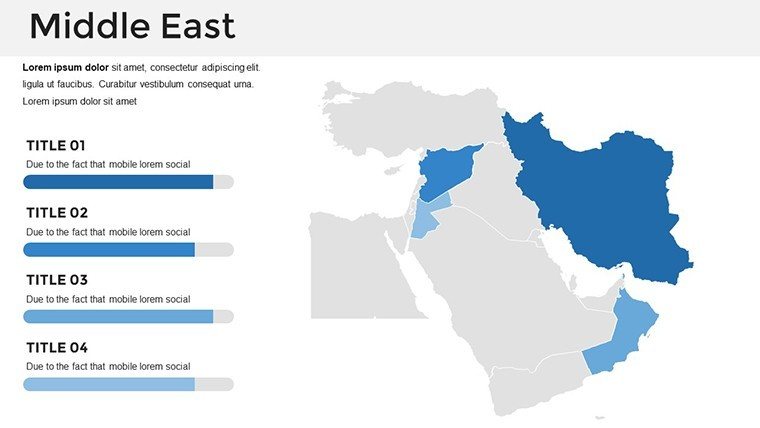
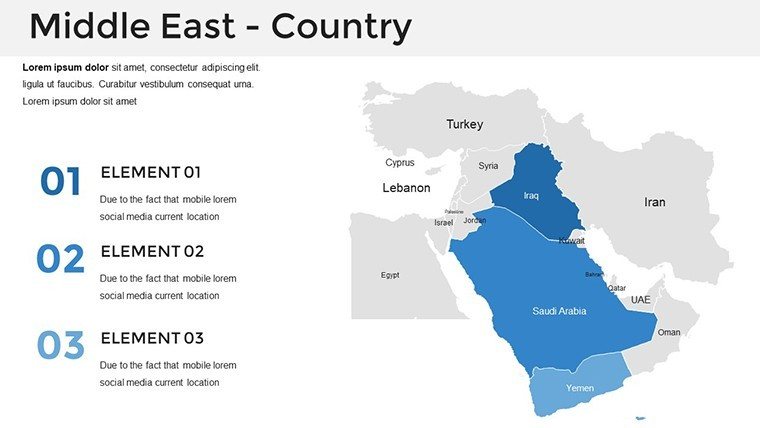
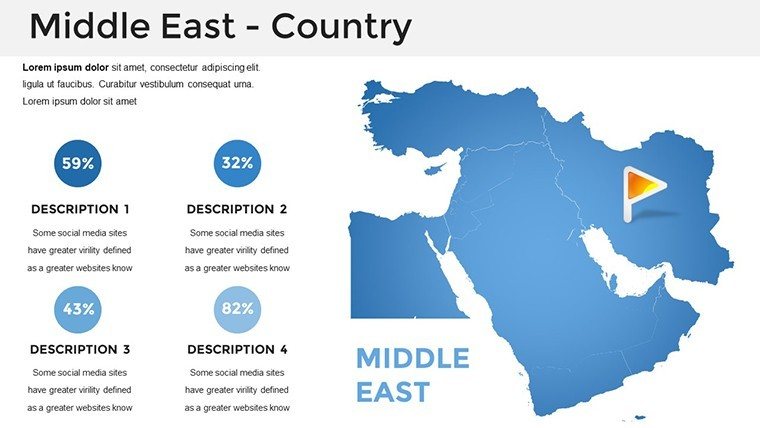
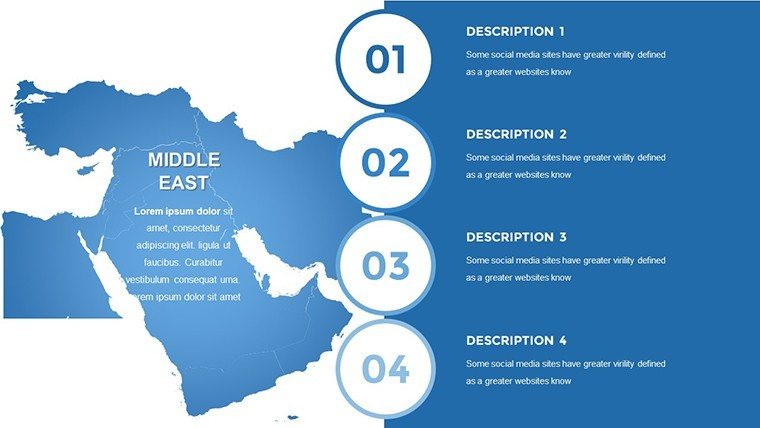
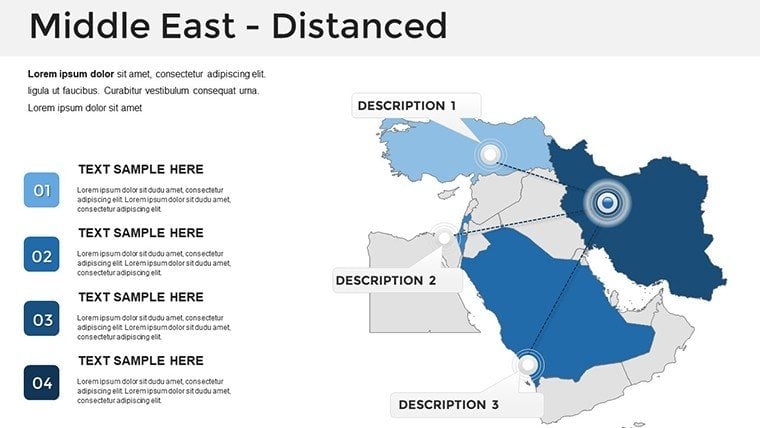
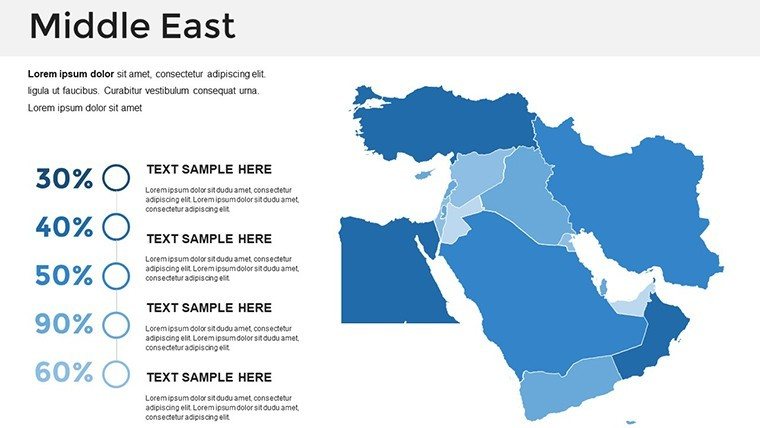
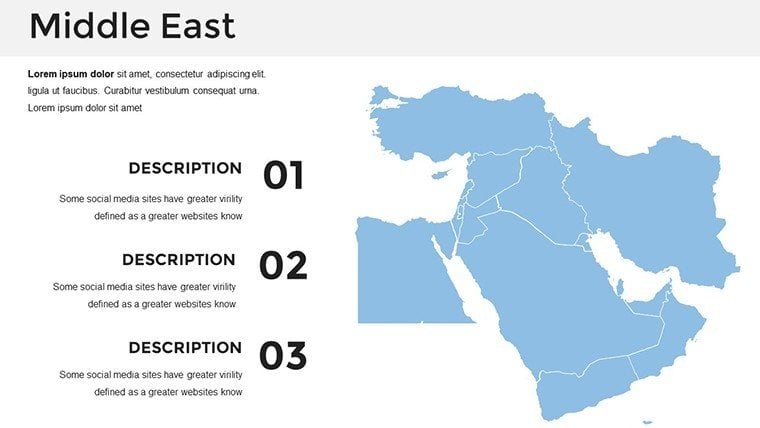
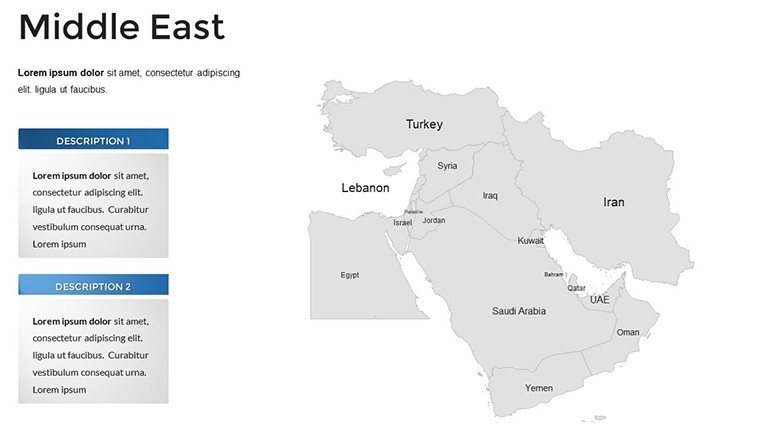
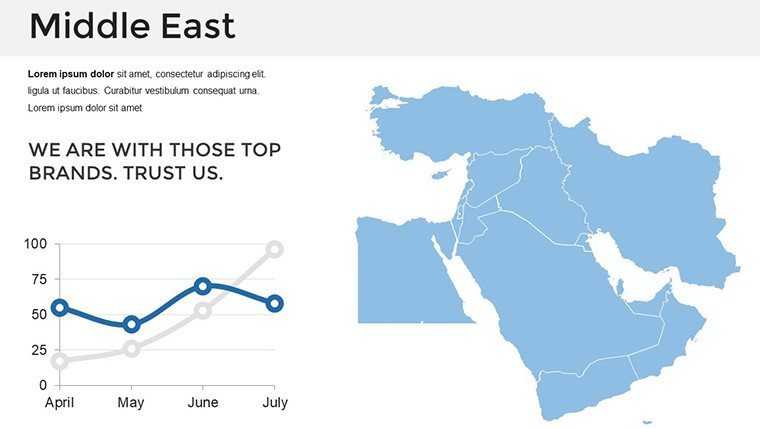
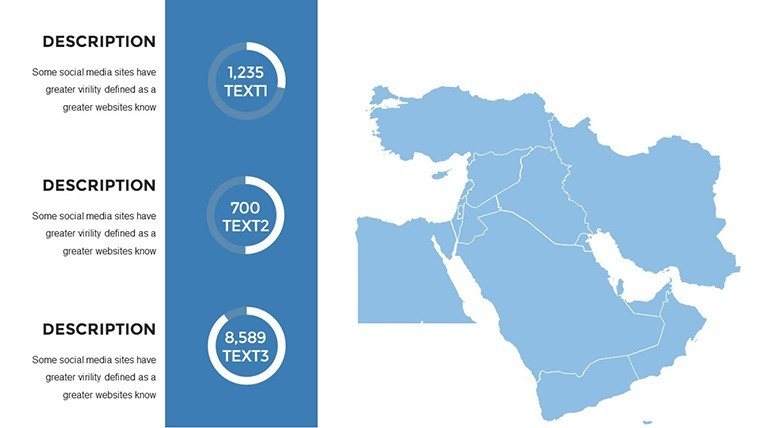
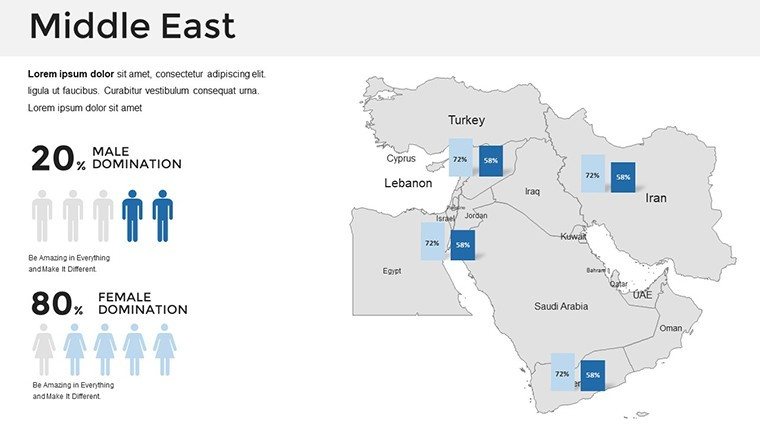
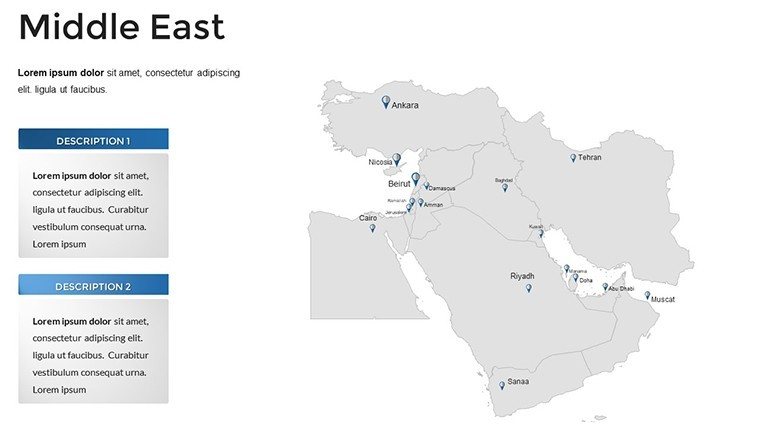
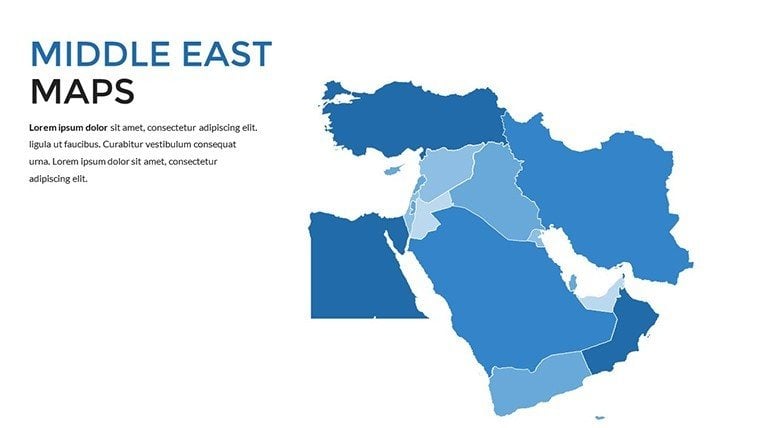
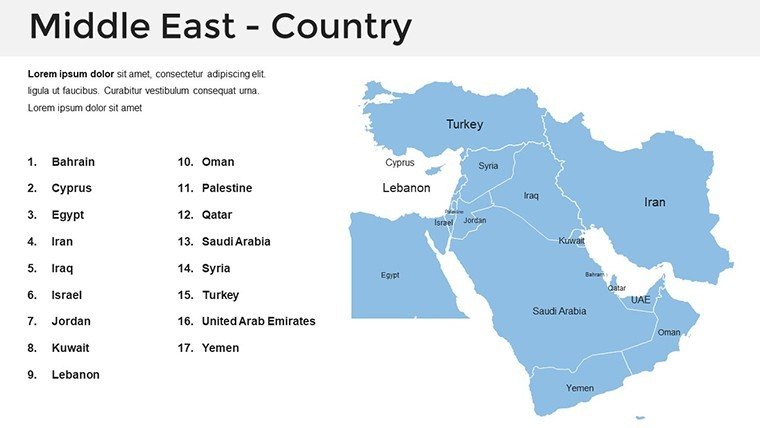
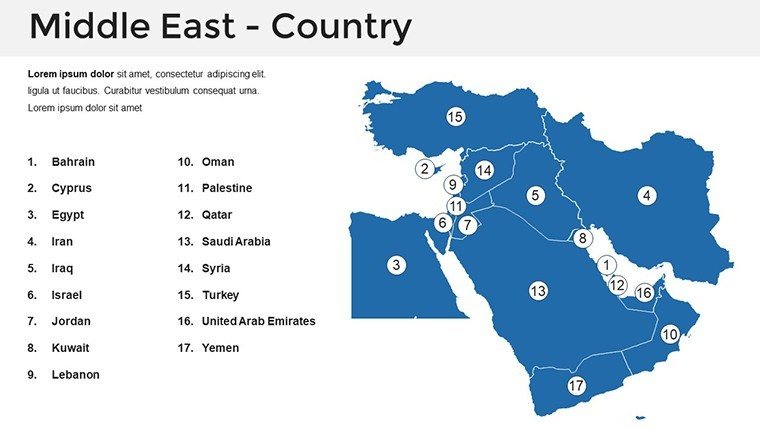
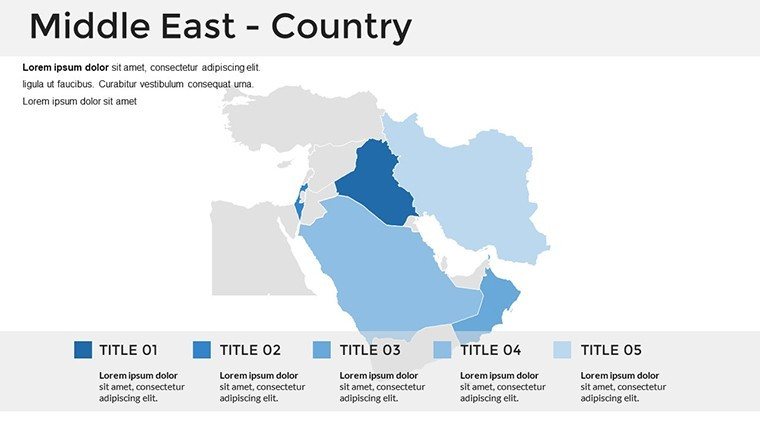
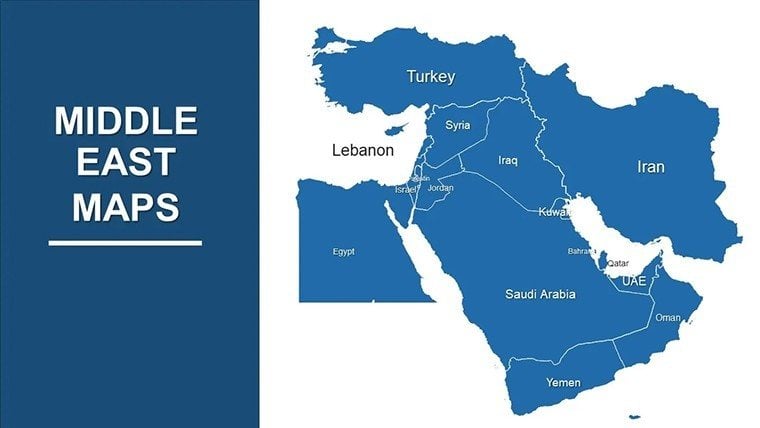
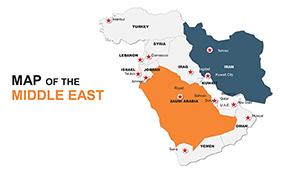
Dive into the intricate tapestry of the Middle East with a template that brings countries like Saudi Arabia, Iran, and the UAE to life on your slides. Our 38-slide PowerPoint Maps Template is engineered for those who need to convey complex geopolitical, economic, or cultural narratives with ease and elegance. Whether you're a strategist outlining oil trade routes or an educator dissecting historical conflicts, these maps offer editable vectors that adapt to your vision. Built on principles from international cartography experts, such as those from the International Cartographic Association, it provides authoritative visuals that build trust. With options for political, physical, and thematic layouts, you can highlight everything from the Arabian Peninsula's deserts to the Levant’s urban centers, all while integrating data for impactful storytelling. This isn't just a template; it's a tool to transform dense information into digestible, memorable presentations, compatible across PowerPoint and Google Slides.
Navigating Complexity: Features That Empower Your Narrative
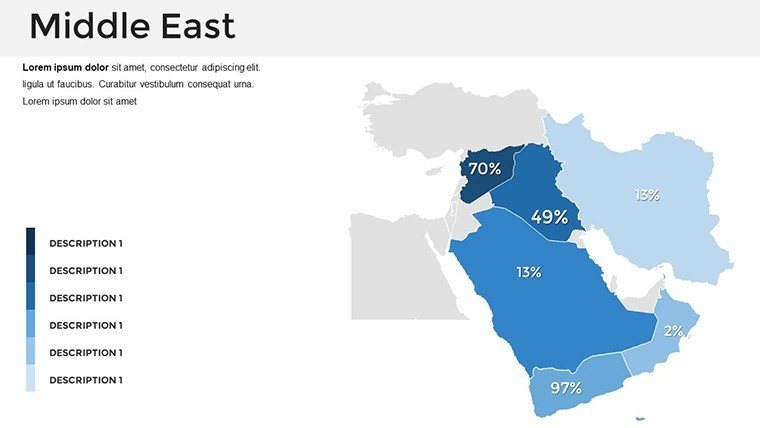
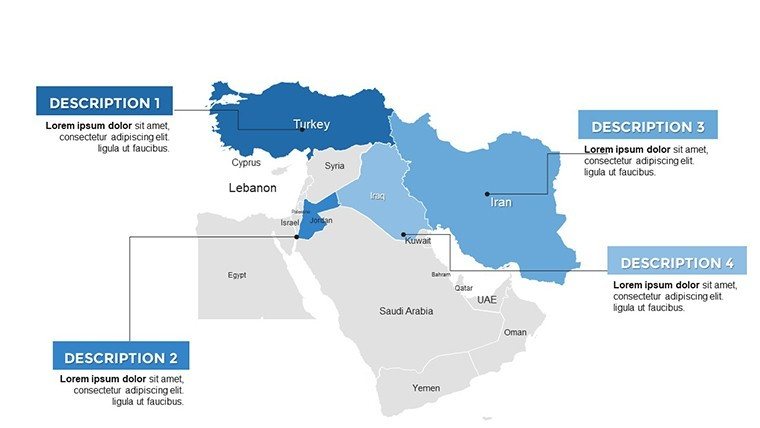
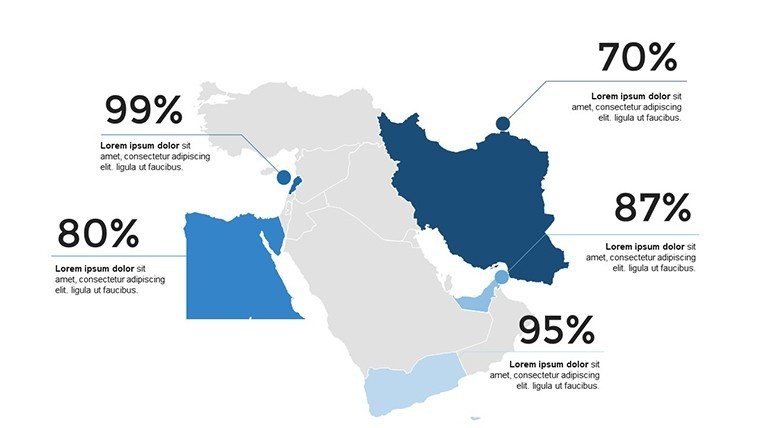
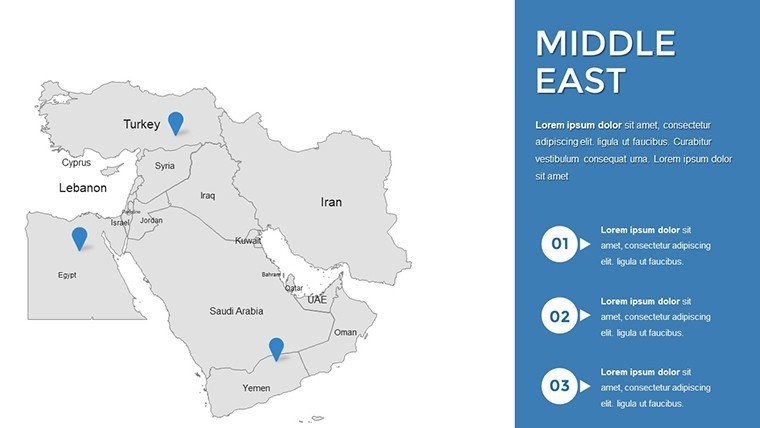
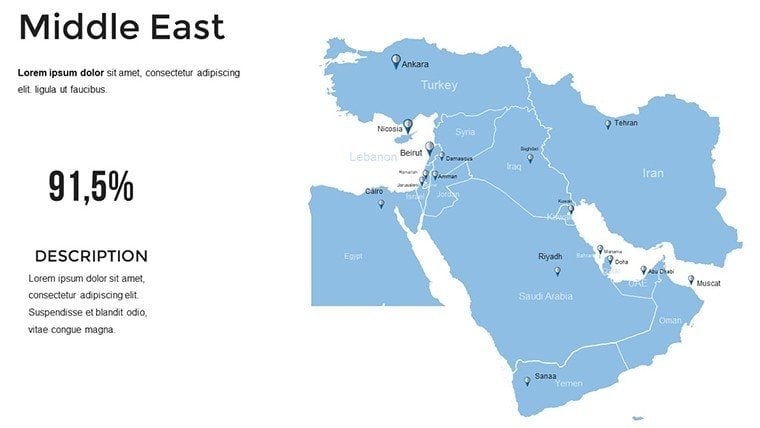
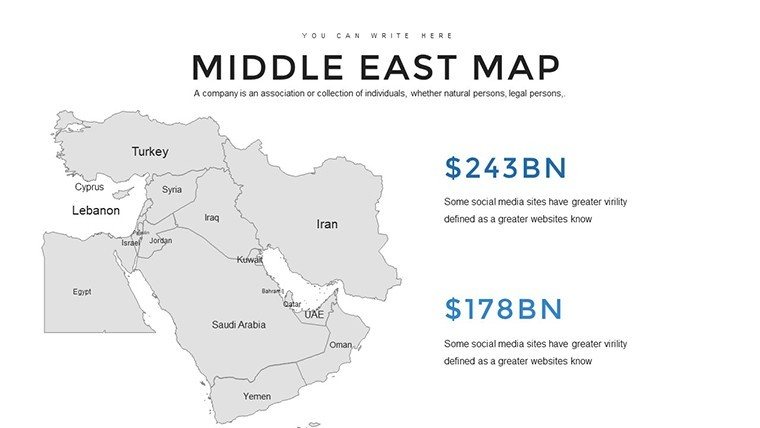
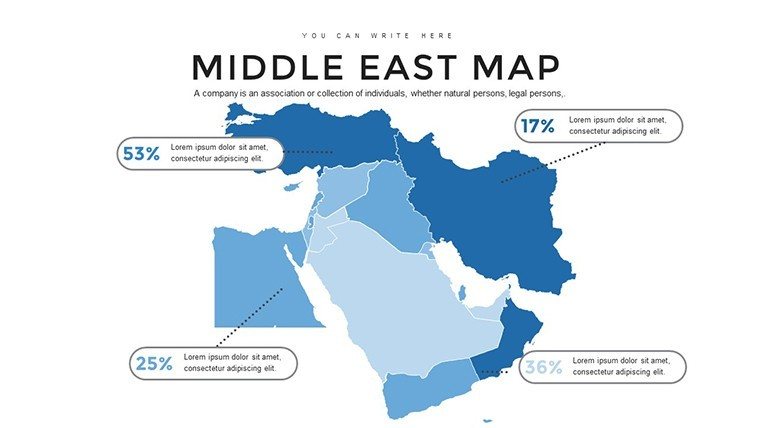
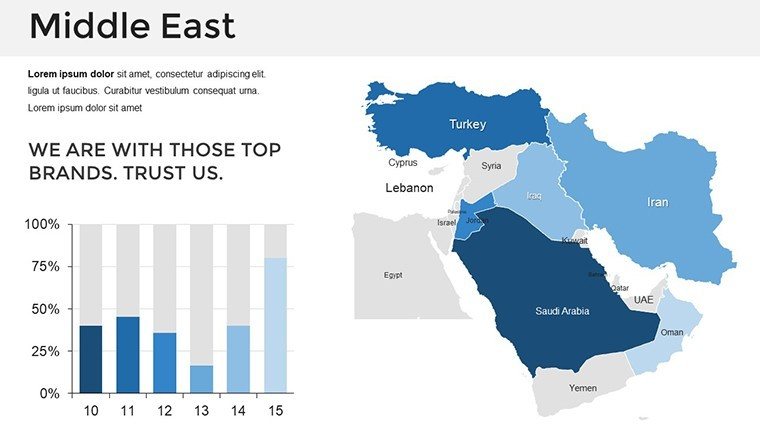
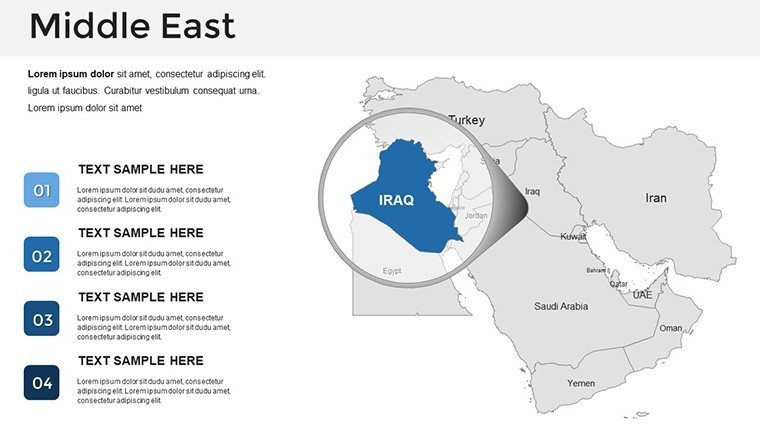
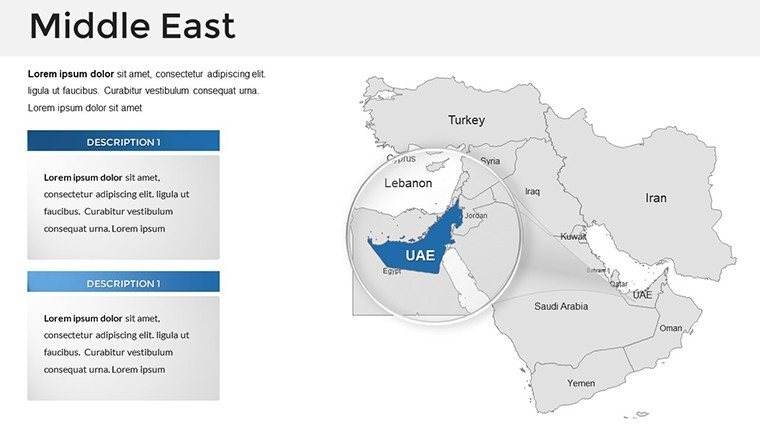
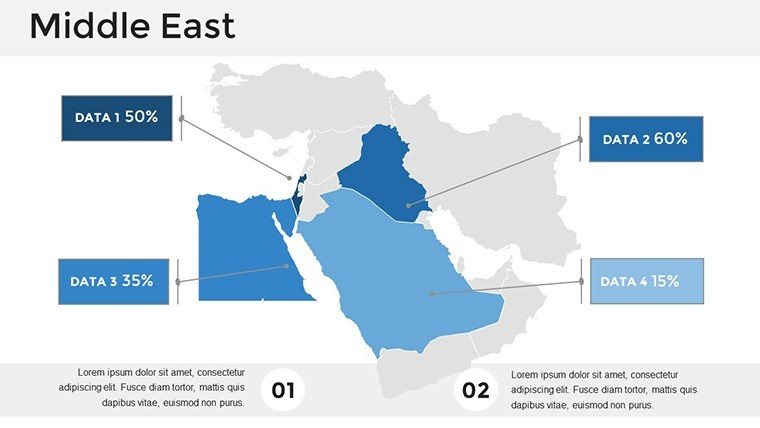
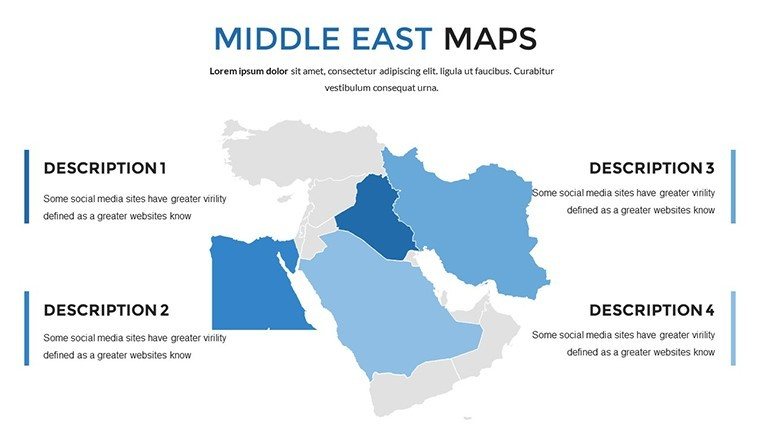
The Middle East's dynamic regions demand visuals that are both accurate and adaptable, and this template delivers with high-fidelity graphics that resist distortion at any scale. Begin with the regional overview on Slide 1, where you can color-code nations for quick identification - perhaps shading Gulf states in blues to denote economic alliances. Slides 2-15 drill down into country-specific maps, allowing annotations like marking Dubai's skyscrapers or Tehran's cultural sites with custom icons. For thematic depth, Slides 16-25 offer variations such as resource distribution, where you can overlay gradients to show oil reserves in Iraq versus water scarcity in Jordan. The latter slides, 26-38, include interactive elements like zoomable sections for detailed views of contested areas, enhancing engagement in virtual settings. Unlike generic tools that overlook nuances like disputed borders, our design incorporates up-to-date boundaries, ensuring your presentations reflect real-world realities. Integrate seamlessly with data sources: Pull in stats from Excel to populate infographics, turning raw numbers into visual stories that persuade.
Slide-by-Slide Exploration: Building Blocks for Success
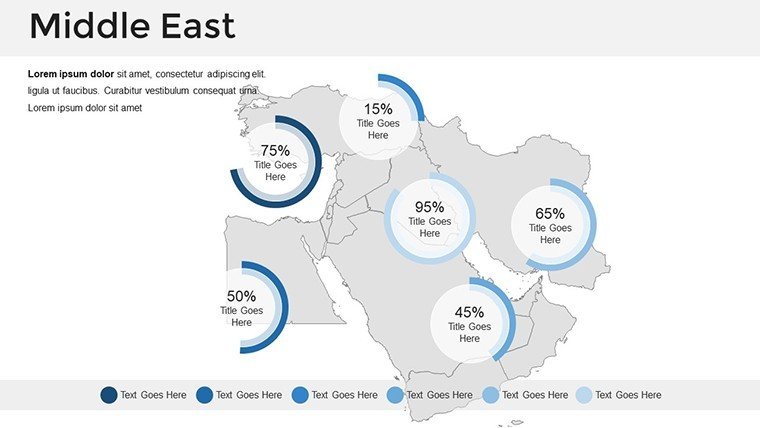
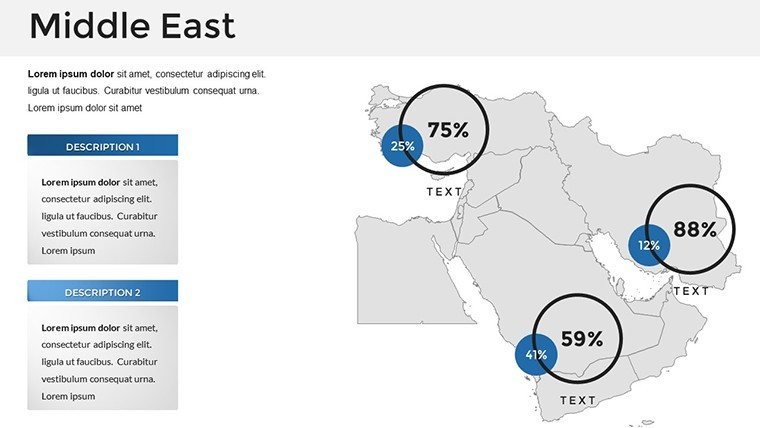
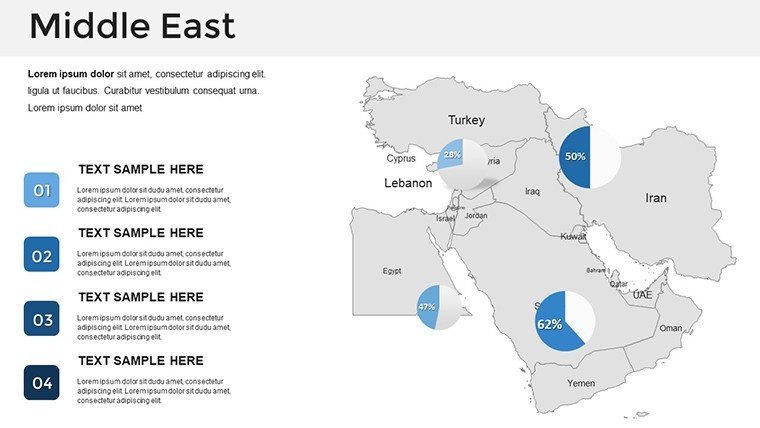
Structurally, the template flows logically: Early slides provide blank canvases for broad strokes, ideal for introductory overviews. Mid-section offerings include layered maps - add economic zones on Slide 10 for a focus on the Strait of Hormuz's strategic importance. Advanced users will appreciate Slides 20-30's thematic templates, perfect for visualizing migration patterns or trade flows across the Red Sea. Conclude with summary slides that compile insights, perhaps using pie charts embedded in maps to compare GDP contributions from Turkey to Egypt. Customization tips: Employ subtle animations to reveal layers, mimicking a journey from the Mediterranean to the Persian Gulf, and ensure color choices align with cultural sensitivities for international audiences.
Targeted Use Cases: From Boardrooms to Classrooms
Business analysts can harness this for market entry strategies, mapping consumer trends in burgeoning economies like Qatar's tech sector or Saudi Arabia's Vision 2030 initiatives. Educators find value in making geopolitics accessible - customize to illustrate the Arab Spring's ripple effects across Syria and Tunisia, sparking classroom debates. NGOs and policymakers benefit from data visualization in advocacy, such as highlighting humanitarian needs in Yemen with overlaid aid distribution points. In contrast to rudimentary PowerPoint maps that lack detail, this template's precision draws from sources like the United Nations, lending credibility to your arguments. Workflow enhancements include quick edits for last-minute updates, like adjusting for current events in Lebanon, and exporting options for collaborative reviews. Real examples shine: A think tank used similar maps to present regional stability reports, leading to informed policy discussions at forums like the World Economic Forum.
Pro Tips for Maximum Impact
- Layer data wisely: Use transparency for overlays to avoid clutter, focusing on key insights like energy corridors.
- Adapt for audience: Simplify for general viewers or add depth with hyperlinks to sources for experts.
- Ensure accessibility: High-contrast colors and alt text for images support inclusive presentations.
- Integrate tools: Combine with timeline templates for historical contexts, like Ottoman influences.
- Track effectiveness: Post-presentation surveys can guide refinements, enhancing future iterations.
This approach addresses common hurdles, such as aligning maps with narrative flow, resulting in cohesive decks that drive action.
Standing Tall: Authority in Every Pixel
Grounded in expert design, this template echoes best practices from cartographers like those at National Geographic, offering more slides and options than standard fare. Its trustworthiness stems from accurate depictions, avoiding pitfalls that could erode confidence in sensitive topics. For urban planners, it aids in visualizing infrastructure in growing cities like Abu Dhabi, per standards from the International Society for Photogrammetry and Remote Sensing. Ultimately, it fosters deeper connections, turning presentations into catalysts for understanding and collaboration. Ready to chart new territories? Secure your template and begin crafting today.
Embrace the potential of these maps to not only inform but to inspire change, bridging gaps in knowledge with every slide. Your next presentation awaits - make it unforgettable.
Frequently Asked Questions
How accurate are the country boundaries?Boundaries are based on current international standards, with options to note disputes for sensitive topics.Can I add my own data overlays?Yes, easily integrate charts, icons, or text to customize for specific analyses.Is the template suitable for non-English presentations?Absolutely, editable labels support multiple languages and fonts.What file formats are provided?PPTX files ensure compatibility and easy editing.Are there thematic map variations?Yes, including political, physical, and resource-focused layouts.Can I use it for print materials?Certainly, high-resolution vectors export well to PDFs for handouts.Good for
- Project roadmaps and sprint plans
- Product launch timelines
- Quarterly or annual review decks
- Company history and milestone summaries
Licence
reviews
Used the map of Canada for a mining report and the provinces were all separate shapes.
The template has too many decorative compass roses I deleted them all.
Had to show mineral deposits and the diamond icons worked well for that.
I'm not picky about design this worked fine for my internal presentation.
The file opened in PowerPoint and the map was easy to recolor using the fill tool.
FAQ
Will it work in Google Slides?
Are fonts embedded?
Can I use this for client work?
What's the refund policy?
Do you update the template after purchase?
Similar templates
See all PowerPoint Maps →
All 38 slides